Issue 12 · 2026-10-05
Most of this issue is about offers that arrive with one number attached and a second one left out. A $675 urea prepay looks like a price. It is also a loan, and at 7% money it costs $25.50 a ton by April, so the lock wins only if April retail tops $700.50. On Illinois' 2027 budget, the university's published flex-lease factors pay the landowner $359 an acre against $321 fixed, and leave the operator $23 instead of $61.
The same is true in the field. An extra mile to a better bid costs 0.4 to 0.5 cents a bushel at $6.53 diesel, and an extra hour in the dump line costs 3 to 12 cents. Ag lime runs 2.7 cents a pound of effective material and pelletized lime 11 to 21. Gulf TSP sits $89 a tonne under DAP, which values DAP's nitrogen at 22 cents a pound against 60 at retail.
Why now: spring nitrogen quotes, 2027 leases, fall lime and the harvest haul are all being settled this month, and some prices underneath them are not known yet. India's urea tender closes Wednesday. The fourth-quarter sulfur contract was not public when we wrote about it. We have given the break-even for each choice so the missing number can be dropped in when it arrives.
— Crop Root Zone, Editorial Desk.
Letters & Responses
No reader correspondence reached us this week. Email is the only way to write to this publication, and nothing about it arrived in the eight days since RZ-011 went up: no questions, no corrections, no pushback. We would rather say so than invent a letter.
Four questions remain open.
RZ-011's closing question is still open. We asked which input on your 2027 booking sheet you are buying without your own check strip, what it costs per acre and on what kind of ground. This issue adds three candidates. In Iowa State's six-site trials, 200 pounds of pelletized lime an acre moved soil pH by about a tenth. Across 51 site-years, none of six nematode seed treatments cut cyst nematode reproduction. Independent trials of wheat nitrogen biologicals found a significant yield gain in 1 of 10 site-years. Strip-trial results on any of them are welcome, with the yield difference and the number of replications.
RZ-010's question on drying is also unanswered. We asked at what moisture you are starting corn, what your propane is contracted or delivered at per gallon, and whether moisture or stalk quality decides which fields go to the dryer first. This issue's aeration feature prices the other side of that decision: on a 30,000-bushel bin, a point of moisture lost below 15% costs about $1,600, roughly eleven times the $146 of electricity it takes to cool the bin this fall.
RZ-009's diesel question has a new tie. We asked whether you are running your fall tillage pass, cutting it back or dropping it, and what you pay per gallon for delivered dyed diesel. This issue puts a fall chisel pass at about 5 bushels of corn and finds that long-term trials pay it back mainly on wet corn-on-corn ground. The hauling feature adds a second use for the same fuel number: at $6.53 diesel, 10 cents of basis pays for 20 to 25 extra miles.
The standing question on nitrogen hedging remains open. A reader wrote to RZ-004 that a grower has no practical way to hedge a nitrogen bill the way grain can be hedged. This issue's lead feature bears on it directly. A prepay is the hedge most growers are actually offered, and at 7% money it costs $25.50 a ton of urea by April, the same $25.50 the Gulf curve charges from October to March. The feature's cheapest hedge costs nothing: a written spring quote that stays open past Wednesday's India tender. The correspondent asked to remain anonymous and remains so.
Corrections, disagreements and quotes from your own operation are all welcome by email. We answer the sharpest ones here the following week.
In This Issue
This week's features, by department.
- A $675 Urea Prepay Costs $25.50 a Ton in Interest by April. The Gulf Curve Charges the Same $25.50 From October to March. Locking Wins Only if April Retail Tops $700.At 7% operating money, a $675 urea prepay must beat $700.50 in April. The Gulf curve implies $599 to $685, or $673 to $735 if it misses as in the last two springs. Early-October prices beat April in three of five seasons. India's tender closes Wednesday.
- Gulf TSP Sits $89 a Tonne Under DAP. That Pays 22 Cents a Pound for Nitrogen That Costs 60 at Retail. TSP Is the Cheaper Fall Phosphate Only Below $858 a Ton.World Bank August benchmarks put Gulf TSP $89 a tonne under DAP, valuing DAP's nitrogen at 22 cents a pound; at September retail prices TSP must be quoted under $858 a ton to beat MAP with no nitrogen credit, and under $710 with full credit.
- The Fourth-Quarter Sulfur Price Is Not Public Yet. Every $100 a Long Ton It Settles Adds $36 to a Ton of DAP — and Lands on Spring 2027, Not This Fall.As of October 1 no public relay carries the Q4 Tampa sulfur settlement. Even a rollover at $705/lt is up 127% from a year ago. We convert each plausible outcome into dollars per ton of DAP, MAP, AMS and ATS, and per acre.
- India's Phosphate Subsidy Rates Expire Today With No Rabi Rates Published. Kharif Alone Used 77% of the Year's ₹54,000 Crore Budget Line.India has published no rabi 2026-27 subsidy rates, and Kharif already used 77% of the year's ₹54,000 crore line. With 22.83 lakh tonnes of DAP against a 55.07 lakh tonne need, a quiet October means a delayed decision, not lower demand.
- The Tampa Ammonia Contract Fell $10 for October. In the Last Two Falls It Rose $30 and $50, and Retail Anhydrous Followed It Up.Yara and Mosaic cut the October contract to an implied $545 a tonne, the first September-to-October decline in three years. In 2024 and 2025 the contract rose $27 and $100 a short ton between September and November, and retail anhydrous rose $33 and $81 over the same weeks. The supply shock that drove last fall's climb, Nutrien's Trinidad shutdown, is now in the base: Trinidad produced 26% less ammonia in the first quarter, while two new Texas plants add about 2.4 million tonnes of capacity, one of them now being bought by Yara. Without that seasonal wholesale push, waiting from September to November changes a 150-pound anhydrous bill by about $1 to $2.50 an acre unless November settles above $585.
- At $5.00 Corn and $12.00 Soybeans, Illinois' Published Flex-Lease Factors Pay the Landowner $359 an Acre, $38 More Than the $321 Fixed Rent. The Operator Keeps $23 Instead of $61.On Illinois' 2027 central Illinois budget, a 30%/38% share-of-revenue lease out-pays $321 fixed rent above 89% of budget revenue; a base-plus-bonus lease needs 99%. The operator breaks even at 97% of budget revenue under the percent lease, 94% under fixed rent, 92% under the bonus lease.
- The Final 2025 Corn Price Is $4.16, a Penny Above FSA's Projection. PLC Pays 26 Cents, About $33 a Base Acre at 160 Bushels. ARC-CO Beats It on Roughly Half of Corn Base.NASS's final 2025/26 averages fix PLC at $0.26 a bushel for corn, $0.21 for soybeans and $1.29 for wheat; FSA's county yields put ARC-CO ahead on roughly half of corn and soybean base and almost no wheat, and no payment is yet confirmed issued.
- Old-Crop Corn Counted 2.095 Billion Bushels, 173 Million Over USDA. The Summer Quarter Grew 3.4%, Not the 9.1% USDA's Figure Needed.NASS's September 1 count beat every trade guess and our own most bearish scenario. Implied 2025/26 corn use drops about 230 million bushels, lifting the 2026/27 carry-in toward 1.74 billion. Soybeans came in 10 million tight.
- Nebraska Pivot Corn Covers Full Cost at $4.38 for 2027. On a Diesel Pivot at September's Fuel Price, Pumping Now Costs More Than Fertilizer.At 2027 prices, UNL's electric pivot corn acre covers full cost at $4.38 cash. Fertilizer repricing moves every budget $3 an acre or less. At $5.50 diesel, a diesel pivot's pumping fuel costs $154 an acre, more than its $147 fertilizer.
- A Dryland High Plains Cotton Acre Needs 446 Pounds at 2027 Prices. It Still Beats Sorghum and Wheat on the Same Ground.We repriced Texas A&M's 2026 South Plains budgets to a December 2027 cotton settlement of 79.66 cents, less West Texas spot basis, and to September retail fertilizer. At about 72 cents lint, dryland cotton covers its variable costs above 293 pounds and its full cost above 446. Pivot cotton needs 1,113 pounds for full cost. Only drip cotton clears full cost at its budget yield. Fertilizer repricing adds $0 to $3.19 an acre to cotton, against $7.69 to $9.96 for irrigated sorghum and wheat. On every class of ground, cotton returns the most above variable cost: $70 dryland against $13 for sorghum and $28 for wheat, and $131 under a pivot against a loss for sorghum.
- An Extra Mile to a Better Bid Costs 0.4 to 0.5 Cents a Bushel at $6.53 Diesel. An Extra Hour in the Dump Line Costs 3 to 12 Cents, and Iowa's $1 Soybean Premium Had a Delivery Date of October 2.Iowa's and USDA's surveys both price a grain haul as a 9-to-12-cent stop charge plus a marginal mile. Repriced to $6.53 diesel, 10 cents of basis buys 20 to 25 extra miles, and a half-hour longer line on a hired truck takes 14 back.
- Cooling a 30,000-Bushel Corn Bin This Fall Takes About $146 of Electricity. A Point of Shrink Below 15% Costs $1,600, and a Musty Load Costs $3,000.With a 3-horsepower fan on a 30,000-bushel bin, each cooling cycle takes about 88 hours and 304 kWh. Three cycles cost half a cent a bushel at Iowa's July rate; each 10°F roughly doubles storage life. Shrink and quality discounts run three to thirty times larger.
- A Fall Chisel Pass Now Costs About 5 Bushels of Corn. Long-Term Trials Pay It Back on Wet Corn-on-Corn Ground, and Almost Nowhere Ahead of Soybeans.Iowa's $20.75 chisel rate, repriced to $5.61 farm diesel, takes 4.9 bushels of $4.59 corn; a disk ripper takes about 7. University plots clear that mainly on poorly drained corn-on-corn. Ahead of soybeans, a 1.8-bushel bar is rarely met.
- Every Soybean Left on a Square Foot Costs $3.13 an Acre This Fall. A 15-Minute Loss Check Pays if It Saves a Tenth of a Bushel.At Sep 29 bids, each soybean per square foot left behind costs $3.13 an acre and each corn kernel $2.40. Most loss happens at the head. Slowing from 5 to 4 mph and a $3.95 air-reel premium both pay back.
- Ag Lime Costs 2.7 Cents a Pound of Effective Neutralizing Material, Delivered and Spread. Pelletized Lime Costs 11 to 21. In Six Iowa Trials, 200 Pounds an Acre Moved pH by a Tenth.At Missouri's surveyed $30.58 a ton delivered and spread, ag lime costs 2.7 cents per pound of effective calcium carbonate; public pelletized prices work out to 11 to 21. In Iowa State's six-site trials, 100 to 400 pounds of pellets left average pH at 5.71 or lower.
- A $15 Nematode Seed Treatment Needs 1.2 Bushels of 2027 Soybeans. Across 51 Site-Years, None of Six Products Cut Cyst Nematode Reproduction. Peking Varieties Averaged 1.9 Bushels More in Iowa.At November 2027 soybeans of $12.56, fluopyram and pydiflumetofen seed treatments need 1.1 to 1.2 bushels; a 51-site-year trial found none of six products reduced nematode reproduction, while Peking varieties out-yielded PI 88788 varieties at seven of nine Iowa State sites in 2025.
- Mosaic's New $10 Residue Enzyme Needs 1.9 Bushels of 2027 Corn. Its Best Published Stand Gain Is Worth About 1.5.At December 2027 corn of $5.17, fall residue products need 1.9 to 4.2 bushels and nitrogen on stalks 5.8 to 7.6. Of seven independent studies that weighed the residue, one found a significant spray effect, at one farm in five.
- A $15.50 Wheat Nitrogen Biological Must Return 2.3 Bushels or 21.5 Pounds of Urea N. Independent Trials Found a Significant Yield Gain in 1 of 10 Site-Years.At $6.70 Kansas wheat, a $15.50/acre N biological must return 2.3 bushels or 21.5 lb urea N. Independent trials: a significant yield gain in 1 of 10 site-years, none on protein. No independent, replicated North American winter wheat trial exists.
State of the Industry
Last week we wrote that crop prices had outrun every nutrient over the past year, nitrogen only just. That lasted seven days. Corn gave back about 6% while retail nitrogen kept climbing, and on the year anhydrous is now ahead of corn again.
Retail nitrogen rose into a falling wholesale market. DTN's survey for September 21–25 put anhydrous at $977 a ton, up 6% in a month and 25% in a year, and urea at $675, up 9% on the year [1]. The barge underneath went the other way. NOLA urea traded at $450–455 a short ton on September 25, down from $458–478 a week earlier [2], and the Gulf benchmark was $446.50 a tonne on October 2, 2.4% below the prior Friday [3][4]. The October Tampa ammonia contract settled $10 a tonne lower [5]. Phosphate and potash barely moved: DAP was flat at $802.50 [6], and NOLA potash barges were $345–360 against $340–350 [2]. Two prices the market is waiting on are not out. India's 1.7-million-tonne urea tender closes October 7 [7]. We found no public relay of the fourth-quarter Tampa sulfur contract, and the last posted price is still the third quarter's $705 a long ton [2].
Grain fell hard. USDA counted 2.095 billion bushels of old-crop corn on September 1, which was 171 million above the average trade estimate and above the highest one [8]. December corn finished October 2 at $4.97¾, down 30½ cents on the week. November soybeans lost 40¾ cents to $12.78¼ and December Chicago wheat lost 20¼ cents to $6.83 [9][4]. Friday's selling came from funds and from a drier forecast that should speed harvest [10]. North-central Illinois elevators bid an average $4.62 for corn and $12.47 for soybeans on October 2, down 31 and 42 cents in a week [11][4]. Corn there is still 21% above a year ago, but anhydrous is up 25%. A ton of anhydrous now costs about 212 bushels of that corn, against roughly 204 a year ago (our arithmetic from [1][11]).
Moving the crop got a little cheaper. U.S. diesel fell 14.7 cents to $6.382 a gallon in the week of September 28, still $2.63 above a year earlier [12]. The Illinois River barge rate dropped 10% to 811% of tariff, or $37.63 a ton, though it is 22% higher than last year [13]. Harvest is at its average national pace, with 18% of corn and 17% of soybeans cut by September 27. Iowa is not: 5% of corn against a 10% average and 3% of soybeans against 17% [14]. That gap is why Iowa crushers brought beans in by rail and bid $1 over futures for prompt delivery [13].
Policy and add-ons. The farm bill extension expired on September 30, and Senate Agriculture leaders are now aiming at the lame-duck session, with a dispute over state cost-sharing for nutrition assistance unresolved [15]. Corteva agreed on September 28 to pay $35 million to 12 states and dismantle its crop-protection loyalty program [16]. For buyers of add-on products the week's arithmetic went the wrong way: a $10-an-acre product needs 2.2 bushels at $4.62 corn, against 2.0 a week ago (our arithmetic from [11][4]).
| Benchmark | Level | Basis | Move |
|---|---|---|---|
| Anhydrous | $977/ton | Delivered retail, Sep 21–25 | +6% MoM; +25% YoY |
| Urea | $675/ton | Delivered retail, Sep 21–25 | +1% MoM; +9% YoY |
| UAN28 | $423/ton | Delivered retail, Sep 21–25 | −1% MoM; +1% YoY |
| Urea | $450–455/st | NOLA barge, Sep 25 | $458–478 a week earlier |
| Urea | $446.50/t | Gulf benchmark, Oct 2 | −2.4% w/w; +0.7% m/m |
| Ammonia | $545/t* | Tampa CFR contract, October | −$10 m/m |
| DAP | $926/ton | Delivered retail, Sep 21–25 | +1% MoM; +3% YoY |
| DAP | $802.50/t | Benchmark, Oct 2 | 0.0% w/w; +1.3% m/m |
| Potash | $498/ton | Delivered retail, Sep 21–25 | +1% MoM; +2% YoY |
| Potash | $345–360/st | NOLA barge, Sep 25 | $340–350 a week earlier |
| Dec corn | $4.97¾/bu | CBOT settlement, Oct 2 | −30½¢ w/w |
| Nov soybeans | $12.78¼/bu | CBOT settlement, Oct 2 | −40¾¢ w/w |
| Dec Chicago wheat | $6.83/bu | CBOT settlement, Oct 2 | −20¼¢ w/w |
| Corn, cash | $4.62/bu | N-central Illinois elevator avg, Oct 2 | −31¢ w/w; +21% YoY |
| Soybeans, cash | $12.47/bu | N-central Illinois elevator avg, Oct 2 | −42¢ w/w; +28% YoY |
| U.S. diesel | $6.382/gal | On-highway retail, wk Sep 28 | −14.7¢ w/w; +$2.63 YoY |
| Illinois River barge | 811% of tariff | $37.63/ton, wk ended Sep 29 | −10% w/w; +22% YoY |
| Barge cost indicator | 248 | USDA GTR index, wk ended Sep 30 | −9.5% w/w |
Sources: DTN/Progressive Farmer, Sep 30, 2026 (retail, Sep 21–25); Advanced Turf Solutions, Sep 28, 2026 (NOLA barges, Sep 25); Trading Economics, accessed Oct 5, 2026 (urea and DAP, Oct 2; week-on-week moves computed against the Sep 25 prints in our last issue); Quantum Commodity Intelligence, Sep 28, 2026, and Fertilizer Daily, Sep 10, 2026 (Tampa ammonia); Brownfield Ag News, Oct 2, 2026 (futures; week-on-week moves computed against the Sep 25 settlements); USDA AMS Illinois Grain Bids, Oct 2, 2026 (year-on-year moves computed from the report's year-ago averages); U.S. Energy Information Administration, Sep 29, 2026; USDA AMS Grain Transportation Report, Oct 1, 2026. *Implied: September's $555 contract less the reported $10 decline; the settlement text itself was not openly available.
The week's verdict: grain futures fell 3% to 6% while retail nitrogen kept rising above a falling barge, so the nitrogen bill is larger in bushels than it was seven days ago, and Wednesday's tender is the next number that can change it.
References
- DTN/Progressive Farmer, "Anhydrous Leads Fertilizer Prices Higher, Up 25% From a Year Ago," Sep 30, 2026. https://www.dtnpf.com/agriculture/web/ag/crops/article/2026/09/30/anhydrous-leads-fertilizer-prices-25
- Advanced Turf Solutions, "U.S. Fertilizer Market Summary," Sep 28, 2026 (prices as of Sep 25, 2026). https://www.advancedturf.com/wp-content/uploads/2026/04/ATS-Fertilizer-Market-Update-9_28_2026.pdf
- Trading Economics, Urea, accessed Oct 5, 2026. https://tradingeconomics.com/commodity/urea
- Crop Root Zone, RZ-011, "State of the Industry" (Sep 25 prints for Gulf urea, CBOT settlements and north-central Illinois cash bids, with their original sources).
- Quantum Commodity Intelligence, "Tampa ammonia falls $10/mt for October," Sep 28, 2026 (headline and summary only; full text not openly available). https://www.qcintel.com/ammonia/article/tampa-ammonia-falls-10-mt-for-october-74032.html
- Trading Economics, Di-ammonium Phosphate, accessed Oct 5, 2026. https://tradingeconomics.com/commodity/di-ammonium
- Fertilizer Daily, "India urea tender: IPL seeks 1.7 million tonnes," Sep 29, 2026. https://www.fertilizerdaily.com/20260929-india-urea-tender-ipl-1-7-million-tonnes-december/
- DTN/Progressive Farmer, "USDA Releases Quarterly Grain Stocks, Small Grains Summary Reports," Sep 30, 2026. https://www.dtnpf.com/agriculture/web/ag/crops/article/2026/09/30/usda-releases-quarterly-grain-stocks
- Brownfield Ag News, "Closing Grain and Livestock Futures: October 2, 2026." https://www.brownfieldagnews.com/market-news/closing-grain-and-livestock-futures-october-2-2026/
- Brownfield Ag News, "Soybeans, corn down, expecting better harvest weather," Oct 2, 2026. https://www.brownfieldagnews.com/market-news/soybeans-corn-down-expecting-better-harvest-weather/
- USDA Agricultural Marketing Service, Illinois Grain Bids, Oct 2, 2026. https://www.ams.usda.gov/mnreports/ams_3192.pdf
- U.S. Energy Information Administration, Gasoline and Diesel Fuel Update, Sep 29, 2026 (week of Sep 28). https://www.eia.gov/petroleum/gasdiesel/
- USDA Agricultural Marketing Service, Grain Transportation Report, Oct 1, 2026. https://ams-prod.azureedge.us/sites/default/files/media/GTR10012026.pdf
- USDA National Agricultural Statistics Service, Crop Progress, Sep 28, 2026 (week ending Sep 27). https://release.nass.usda.gov/reports/prog3926.txt
- Agri-Pulse, "Senate Ag leaders press for farm bill talks as SNAP feud threatens passage," Oct 2, 2026. https://www.agri-pulse.com/articles/25330-senate-ag-leaders-press-for-farm-bill-talks-as-snap-feud-threatens-passage
- DTN/Progressive Farmer, "Corteva to Pay $35M to 12 States, End Crop Loyalty Program," Sep 28, 2026. https://www.dtnpf.com/agriculture/web/ag/crops/article/2026/09/28/corteva-pay-35m-12-states-end-crop-2
Weekly Briefing
Fertilizer
Anhydrous leads retail higher, up 25% on the year — DTN's survey for September 21–25 had six of eight products above a month earlier. Anhydrous averaged $977 a ton, up 6% on the month, and no other product moved more than about 1%. Urea was $675, DAP $926, MAP $970 and potash $498. (DTN/Progressive Farmer, Sep 30, 2026)
India's 1.7-million-tonne urea tender closes Wednesday — Indian Potash Limited wants 1.0 million tonnes for the west coast and 0.7 million for the east. Offers are due October 7, price bids open the same day and must stay valid to October 15. The latest sailing date was pulled forward to December 1 from December 15. (Fertilizer Daily, Sep 29, 2026)
SABIC picks KBR technology for a Jubail ammonia train — SABIC Agri-Nutrients will build a single-train, 3,500-tonne-a-day ammonia plant at Jubail, about 1.2 million tonnes a year, with Samsung E&A as contractor. The project lifts the company's urea capacity from 4.8 million to 7.4 million tonnes a year. No start-up date was given. (World Fertilizer, Oct 2, 2026)
First Belarusian potash cargo since sanctions nears New Orleans — Belarus is delivering 30,000 tonnes of potash to New Orleans, the first arrival since U.S. sanctions were imposed in 2021. It follows the president's September statement that Washington was negotiating a larger purchase. No vessel or arrival date was named. (World Fertilizer, Oct 5, 2026)
Crops
Old-crop corn stocks beat every trade estimate — USDA counted 2.095 billion bushels of corn on September 1, against an average trade guess of 1.924 billion and a high of 2.005 billion. Soybeans came in at 315 million bushels against 323 million expected, and wheat at 1.846 billion against 1.849 billion. (DTN/Progressive Farmer, Sep 30, 2026)
December corn ends the week back under $5 — December corn settled at $4.97¾ on October 2, November soybeans at $12.78¼ and December Chicago wheat at $6.83. Fund selling and a drier forecast for the western Corn Belt drove the close. Mexico bought 218,600 tons of U.S. corn, and USDA's next supply and demand estimates are due October 9. (Brownfield Ag News, Oct 2, 2026)
Iowa has cut 3% of its soybeans, not 17% — Nationally, 18% of corn and 17% of soybeans were harvested by September 27, both at the five-year average. Iowa stood at 5% and 3%, against averages of 10% and 17%. Iowa processors took soybeans in by rail, and one Council Bluffs plant bid $1 over futures for delivery by October 2 while bidding 25 under for October–November. (USDA NASS, Sep 28, 2026; USDA AMS Grain Transportation Report, Oct 1, 2026)
Red crown rot reaches Iowa soybean fields — Iowa confirmed its first cases in Des Moines County in mid-August and mid-September. Iowa State pathologist Daren Mueller cites losses of 50% to 70% in badly affected patches. The advice is to harvest confirmed fields last, clean equipment between fields and rotate to corn or small grains. (DTN/Progressive Farmer, Oct 2, 2026)
Home & Garden
Garlic goes in this month almost everywhere — A regional guide puts planting at mid to late October in the mid-Atlantic and one to two weeks after the first killing frost in the Upper Midwest, with warmer areas running into winter. Set cloves pointed end up, four to six inches apart, then mulch. Buy seed garlic from a nursery, not the grocery store. (Farmers' Almanac, Sep 29, 2026)
Mow the verge twice a year, not four times — University of Ottawa researchers compared rural roadsides mowed twice a year and spot-sprayed with ones mowed four times and broadly sprayed. The lighter regime had 45% more pollinators and 23% more species, across 3,773 bees and flower flies at 31 sites. (Insect Conservation and Diversity, via Phys.org, Oct 2, 2026)
Some beech trees shrug off leaf disease — Given equal doses of the nematode behind beech leaf disease, Japanese beech showed symptoms on about 4% of leaf area and American and European beech on 40% to 50%, with differences among American trees too. That points to genetic resistance. The work was done in a greenhouse, and whether the resistance is inherited is not yet confirmed. (Forest Pathology, via Phys.org, Oct 2, 2026)
Micronutrients
Zinc metal slips to a six-week low — Zinc traded near $3,712 a tonne on October 5, down 6.6% in a month and up 23% on the year, on weak orders from Chinese galvanizers and a stronger dollar. Exchange stocks remain low. The metal is the raw material for zinc sulfate and zinc oxide fertilizers, though we found no public zinc sulfate quote this week. (Trading Economics, Oct 5, 2026)
Fourth-quarter Tampa sulfur is still not public — As of October 5 we found no public relay of the fourth-quarter Tampa molten sulfur contract, and the posted price is still the third quarter's $705 a long ton. U.S. Gulf prilled sulfur eased to $950–1,100 a tonne FOB in late September. Chinese spot sulfur was about CNY 7,702 a tonne on October 5, down 6.1% on the month and up about 190% on the year. (Advanced Turf Solutions, Sep 28, 2026; Trading Economics, Oct 5, 2026)
Organics
USDA adds $1 billion to its regenerative pilot — The expansion would run through the EQIP and CSP conservation programs. The Senate farm bill would cut $2 billion from those same two programs, and the conservation group Invest in Our Land says more than 56,500 valid applications could go unfunded. (Brownfield Ag News, Oct 2, 2026)
Poultry-litter amendments keep E. coli alive longer — In a two-year field study on Georgia onion ground, E. coli survived longer in soil amended with heat-treated poultry pellets or composted litter than in unamended soil. Humidity, rain and warm soil extended survival, and wind shortened it. The authors say extreme weather mattered more than seasonal averages. (Risk Analysis, via Phys.org, Sep 30, 2026)
The organic standards board meets October 27–29 — The National Organic Standards Board's fall meeting will be virtual, with public comment webinars on October 20 and 22. On the agenda are petitions to add or remove National List substances and the substances due to sunset in 2028. Written comments closed October 1. (USDA Agricultural Marketing Service, accessed Oct 5, 2026)
Up and Coming
Allergen-reduced peanuts come out of a Georgia field — Minneapolis startup Nurtured Nuts is harvesting CRISPR-edited peanuts with three allergenic proteins removed (Ara h 2, 6 and 7), and is aiming for a 2027 launch pending FDA review. Early-stage: this is one location and one season, no yield or allergenicity data have been published, and the peanuts are not allergen-free. (Fertilizer Daily, Oct 5, 2026)
A desert alga that grows fast under stress — University of Kaiserslautern-Landau researchers describe how Chlorella ohadii, from the Negev, combines rapid growth with tolerance of extreme heat and light. They report a 30% seed-yield gain in plants carrying traits transferred from it. Early-stage: the modified plants are in the patent process and the report gives no field data. (New Phytologist, via Phys.org, Oct 1, 2026)
Camelina turns out to have a fourth subgenome — University of Saskatchewan researchers mapped a fourth subgenome in the oilseed and showed routes for bringing diversity from wild relatives into a crop with very little of it. Research-stage: the authors say linking these findings to field traits is still ahead. (Nature Communications, via Phys.org, Oct 1, 2026)
A simpler lab method for DNA-bound soil phosphorus — A team led by Sultan Qaboos University dropped the enzyme steps from the procedure and tested it on 32 UK soils. DNA-bound phosphorus tracked pH, microbial biomass phosphorus and organic matter. Research method only: it is a small share of soil organic phosphorus and not a commercial soil test. (Journal of Agricultural and Marine Sciences, via ScienceDaily, Sep 27, 2026)
Interesting
Gulf soybeans for China are sailing around Africa — USDA says all 24 China-bound soybean vessels inspected at Mississippi Gulf terminals from September 4 to 24, carrying about 1.6 million tonnes, are routed past the Cape of Good Hope. The Panama Canal is allowing 32 transits a day against a normal 36 to 40, and will go to 33 on October 15. (USDA AMS Grain Transportation Report, Oct 1, 2026)
Fifteen states and Guam sue Corteva over PFAS liabilities — The suit, filed in Indiana state court on October 1, the day Corteva launched its seed spinoff Vylor, alleges the company moved billions in assets to the new firm while keeping PFAS liabilities inherited from DuPont. Corteva calls the suit "entirely without merit." (Brownfield Ag News, Oct 2, 2026; Reuters, Oct 1, 2026)
Dutch farmers try rice on sinking peat — A 0.6-hectare pilot between Amsterdam and The Hague expects about 3 tonnes of short-grain rice, with some 30 cultivars under test. The aim is to keep peat wet so that it stops subsiding and releasing carbon. Wageningen researchers are still measuring whether methane from the paddy cancels the gain. (AFP, via Phys.org, Oct 1, 2026)
Off the Wall Discovery
Bark-and-moss bricks for city birds to peck apart — A Melbourne designer has set out 100 bricks of bark, casuarina needles, twigs, coconut fibre and moss for birds to take as nesting material. Human-made material in Australian museum nests rose from 4% in 1832 to 30% in 2018. Installation, not a result: cameras are recording which birds use the bricks, and no outcome data exist yet. (Phys.org, Oct 2, 2026)
Broccoli grown under magenta solar panels — In a Swedish farm trial, broccoli under tinted panels used sunlight 4.5 times as efficiently as open-field plants and reached normal size, 25 days later. Prototype, one season: the authors say the results need more seasons and suit small plots or greenhouse roofs for now. (Cell Reports Physical Science, via Phys.org, Oct 2, 2026)
Fabric from army-uniform research covers strawberries — North Carolina State researchers laid a knitted insect-barrier textile, developed from work on military clothing, over strawberries in tunnel trials across three seasons. Yields ran as much as 3.56 times those of uncovered plants. Unusual, and an upper bound: that is the best case, in tunnels only. (Agriculture, via ScienceDaily, Oct 1, 2026)
A $675 Urea Prepay Costs $25.50 a Ton in Interest by April. The Gulf Curve Charges the Same $25.50 From October to March. Locking Wins Only if April Retail Tops $700.
At 7% operating money, a $675 urea prepay must beat $700.50 in April. The Gulf curve implies $599 to $685, or $673 to $735 if it misses as in the last two springs. Early-October prices beat April in three of five seasons. India's tender closes Wednesday.
Retail urea averaged $675 a ton in the week of September 21–25, (DTN/Progressive Farmer, Sep 30, 2026) [1], up $16 from the $659 of the week before [23]. In the same week the barge it is priced from went the other way. NOLA urea traded at $450–455 a short ton on September 25, down from $458–478 a week earlier (Advanced Turf Solutions, Sep 28, 2026) [3]. By October 2 the October futures contract had settled at $437 and March 2027 at $462.50, which is $12.50 lower than March stood on September 23 (Farmbucks, Oct 2, 2026) [2]. A grower offered a spring urea price this week is therefore being quoted off a retail number that is still rising and a wholesale number that has been falling for two weeks. India's next import tender closes on Wednesday. This piece works out what locking costs, what waiting costs, and what April has to look like for either to win. It extends our September 24 curve piece [23] by adding the interest bill, five seasons of fall-to-spring retail history, and the tender.
1. Three prices, moving in two directions
What's new: Retail nitrogen rose in late September. The Gulf barge and the futures curve fell. The gap between retail urea and the barge is now wider than at any spring reading we have measured.
Evidence: DTN's national averages for September 21–25 put nitrogen at $0.60 a pound as anhydrous, $0.73 as urea, $0.74 as UAN32 and $0.76 as UAN28 [1]. At a 180-pound corn rate, the rate this desk uses for a spring-applied program, that is $107 to $136 an acre.
| Product | Retail, $/ton | $/lb N | $/acre at 180 lb N | |
|---|---|---|---|---|
| Anhydrous 82-0-0 | 977 | 0.596 | 107.23 | ████████░░ |
| Urea 46-0-0 | 675 | 0.734 | 132.07 | ██████████ |
| UAN32 | 479 | 0.748 | 134.72 | ██████████ |
| UAN28 | 423 | 0.755 | 135.96 | ██████████ |
Source: DTN/Progressive Farmer, Sep 30, 2026 (national average retail, delivered to farm, week of Sep 21–25). Per-pound and per-acre values are Crop Root Zone calculations at 1,640, 920, 640 and 560 lb N per ton. Bars scale $/acre, with UAN28 at ten blocks.
The state dealer surveys are higher for dry and liquid nitrogen. USDA's Illinois report for the week ending October 2 has the urea ask averaging $770 a ton, up $48 in two weeks, in a range of $650 to $890. Anhydrous averaged $945, up $37.50. UAN28 averaged $466.67, down $40.21, and the single UAN32 quote was $530 (USDA AMS, Oct 2, 2026) [4]. Iowa's latest posted report is still the one for September 18. It lists anhydrous at $823.40 and UAN32 at $456.20 and has no urea line (USDA AMS, Sep 18, 2026) [5].
| Illinois dealer ask, week ending Oct 2 | $/ton | Two-week change | $/lb N | $/acre at 180 lb N |
|---|---|---|---|---|
| Anhydrous | 945.00 | +37.50 | 0.576 | 103.72 |
| Urea | 770.00 | +48.00 | 0.837 | 150.65 |
| UAN32 | 530.00 | +5.00 | 0.828 | 149.06 |
| UAN28 | 466.67 | −40.21 | 0.833 | 150.00 |
Source: USDA AMS, Illinois Production Cost Report (Bi-weekly), Oct 2, 2026. Distributor ask, f.o.b. dealer, average of the reported range. Per-pound and per-acre values are Crop Root Zone calculations.
The wholesale side moved down over the same days. The table sets the futures chain on September 23, as we reported it then [23], against the October 2 settlements [2].
| Contract month | Sep 23, $/st | Oct 2, $/st | Change | Oct 2 premium to October, $/st |
|---|---|---|---|---|
| Oct 2026 | 460.00 | 437.00 | −23.00 | — |
| Nov 2026 | 455.00 | 446.50 | −8.50 | +9.50 |
| Dec 2026 | 454.00 | 447.00 | −7.00 | +10.00 |
| Jan 2027 | 475.00 | 450.00 | −25.00 | +13.00 |
| Feb 2027 | 475.00 | 457.50 | −17.50 | +20.50 |
| Mar 2027 | 475.00 | 462.50 | −12.50 | +25.50 |
| Apr 2027 | 407.50* | 455.00* | — | +18.00* |
| May 2027 | 407.50* | 450.00* | — | +13.00* |
Source: Farmbucks urea (US Gulf) futures chain, data from DTN, CME Group and ICE, last trade date shown Oct 2, 2026, 3:36 p.m. CT; Sep 23 column as published in our Sep 24 piece from the same page. Basis: granular urea, FOB US Gulf, $/short ton, monthly-average settlement. *April and May showed no change on the day and no trades. On Sep 23 both carried a placeholder $407.50. We treat the new values as indicative, not traded.
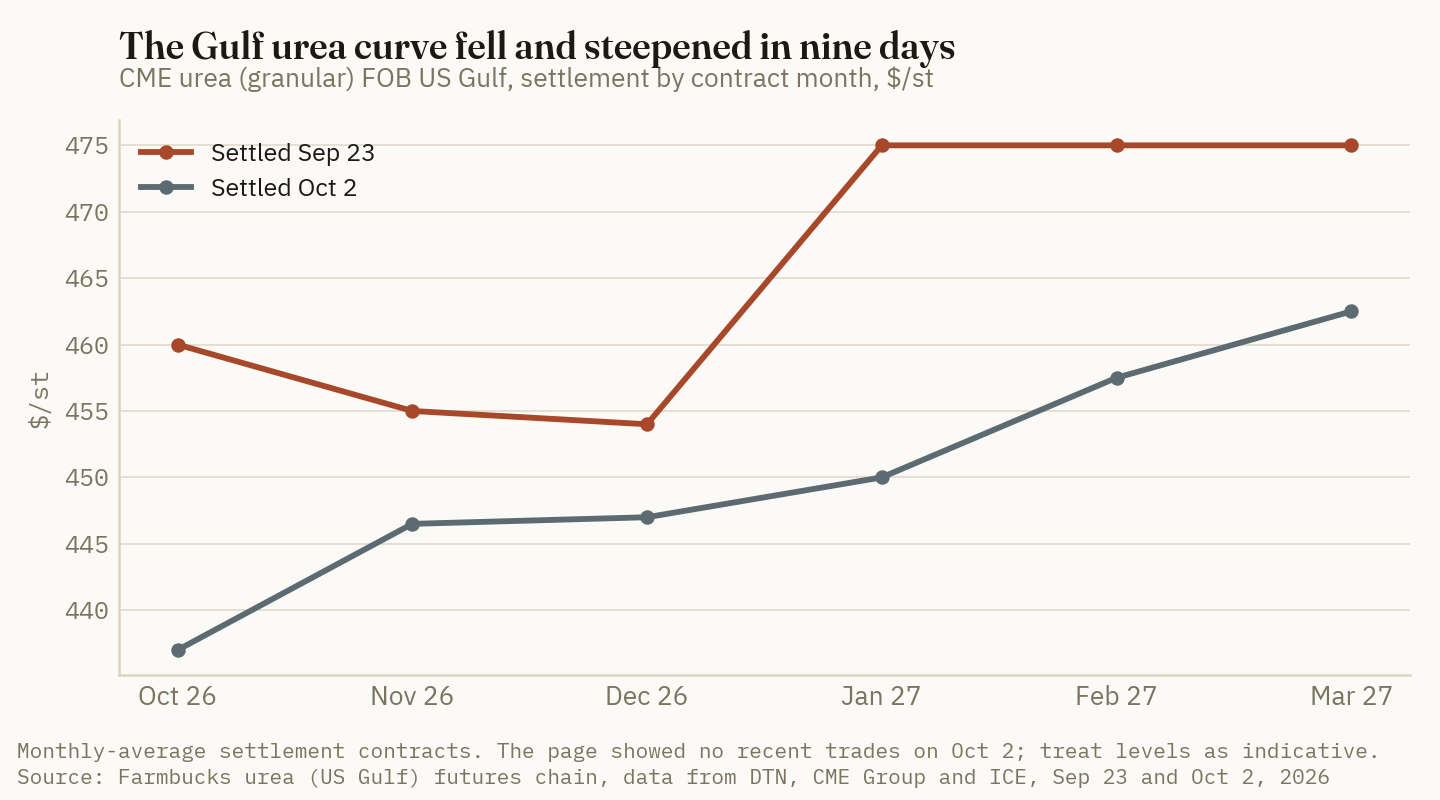
Two cautions on that chain. The page showed zero volume, open interest of 238 contracts and "no recent trades" on October 2, and the whole strip had bounced $5 to $14 that day from a lower close [2]. The levels are thin. The direction is not in doubt, because the physical barge fell too [3].
Put retail and barge side by side. Retail at $675 against a prompt barge midpoint of $452.50 on September 25 is a spread of $222.50 a ton. Against the October 2 contract it is $238. Our September 24 piece measured $201 a week earlier and $136 to $167 at three spring readings in 2025 and 2026 [23]. Retail is still passing through the barge rally that ran from about $380 in mid-August to $458–478 in mid-September. It has not yet seen the decline.
2. What it costs to hold a paid ton until April
What's new: A prepay is a purchase plus a loan. At the current farm operating rate, the loan adds $25.50 to a ton of urea between now and mid-April. That is exactly the premium the futures curve puts on March over October.
Evidence: The Kansas City Fed's survey of farm lending terms for the second quarter put the average rate on non-real-estate farm loans above $100,000 at slightly under 7%, and on smaller loans slightly above 7% (Federal Reserve Bank of Kansas City, Jul 10, 2026) [10]. We use 7%, with 5% and 9% alongside. From October 5 to an April 20 application is 197 days.
| Product | Price today, $/ton | Carry at 5% | Carry at 7% | Carry at 9% | Carry at 7%, $/acre | April break-even at 7%, $/ton |
|---|---|---|---|---|---|---|
| Urea | 675 | 18.22 | 25.50 | 32.79 | 4.99 | 700.50 |
| Anhydrous | 977 | 26.37 | 36.91 | 47.46 | 4.05 | 1,013.91 |
| UAN32 | 479 | 12.93 | 18.10 | 23.27 | 5.09 | 497.10 |
| UAN28 | 423 | 11.42 | 15.98 | 20.55 | 5.14 | 438.98 |
Source: Crop Root Zone calculation. Price today is the DTN/Progressive Farmer national average for Sep 21–25, 2026. Carry is simple interest for 197 days (Oct 5, 2026 to Apr 20, 2027), in $/ton. The 7% rate follows the Kansas City Fed's second-quarter survey; 5% and 9% are sensitivity cases. Per-acre values at 180 lb N. Break-even is the April retail price at which paying today and paying in April cost the same.
$700.50 a ton
The April retail urea price above which a $675 prepay made today comes out ahead, at 7% money and 197 days. That is 3.8% above today, or $0.761 a pound of nitrogen. (Crop Root Zone calculation from DTN/Progressive Farmer, Sep 30, 2026, and Federal Reserve Bank of Kansas City, Jul 10, 2026)
Three conditions change this number. A program that takes a deposit and bills the balance at delivery carries interest only on the deposit, and a lock with no money down has no carry at all. A grower paying from cash should use what that cash would otherwise earn. And a prepay quote is not the DTN average. The arithmetic is the same for any quote: add 3.8% for interest and ask whether April will be higher than that.
The coincidence in the numbers is worth a sentence. The October 2 curve charges $25.50 a short ton to move a barge from October to March [2]. A bank charges $25.50 to carry a retail ton from October to April. The futures market, in other words, is pricing spring urea at about today's price plus the cost of holding it, and nothing for a spring rally.
3. What the curve implies for April, set against that break-even
What's new: Taken at face value, the curve puts April retail urea below the break-even in every spread case. Add the amounts by which the curve missed the last two springs and the break-even lands in the middle of the range.
Evidence: A March contract at $462.50 becomes a retail price only after a spread is added. We use the three spring spreads and today's, then repeat the exercise with the two spring misses we documented on September 24, when the curve two to three months out came in $74 and $105 a short ton under the realized price [23].
| Case | Spring barge, $/st | Spread, $/ton | Implied April retail, $/ton | $/lb N | Lock today vs. wait, $/acre |
|---|---|---|---|---|---|
| Curve, tightest spring spread | 462.50 | 136 | 598.50 | 0.651 | −19.96 |
| Curve, widest spring spread | 462.50 | 167 | 629.50 | 0.684 | −13.89 |
| Curve, today's spread holds | 462.50 | 222.50 | 685.00 | 0.745 | −3.03 |
| Curve misses by $74, tightest spread | 536.50* | 136 | 672.50* | 0.731 | −5.48 |
| Curve misses by $74, widest spread | 536.50* | 167 | 703.50* | 0.765 | +0.59 |
| Curve misses by $105, tightest spread | 567.50* | 136 | 703.50* | 0.765 | +0.59 |
| Curve misses by $105, widest spread | 567.50* | 167 | 734.50* | 0.798 | +6.65 |
Source: Crop Root Zone calculation. March 2027 settlement from Farmbucks, Oct 2, 2026. Spring spreads of $136 and $167 are the late-February 2026 and mid-April 2025 retail-minus-barge readings from our Sep 24 piece; $222.50 is DTN retail for Sep 21–25 minus the Sep 25 NOLA midpoint from Advanced Turf Solutions. Last column is implied April retail minus $700.50, at 920 lb N per ton and 180 lb N per acre; negative means waiting was cheaper. *Scenario values that assume the curve under-calls spring by the same dollars as in 2025 or 2026. These are assumptions, not forecasts.
For the lock to break even at a normal spring spread, the spring barge has to reach $534 to $565 a short ton. That is $71 to $102 above the March contract, almost exactly the size of the last two misses. One outside reference sits in the same place. Agricultural economist Greg Ibendahl's gas-driven model has national retail urea peaking near $705 in April 2027, with a stated twelve-month error of $109 a ton (Ibendahl, Sep 8, 2026) [22].
Ground Truth: Locking urea at $675 today is not a bet that nitrogen goes up. It is a bet that the futures curve is wrong about spring for a third year running, by about as much as it was wrong in 2025 and 2026. If the curve is right, waiting saves $14 to $20 an acre. If it repeats its recent error, the two choices land within $7 an acre of each other. The payoffs are lopsided in favor of waiting, unless a grower believes in a shock larger than the last two. The one thing that narrows the gap is the retail spread. At $222.50 it is $56 to $87 wider than a spring spread, and a prepay quote that already gives some of that back is a better quote than the survey average suggests. Ask the retailer what barge value the spring price is built on.
4. How early-October buyers did in the last five seasons
What's new: We matched DTN's first October survey to the mid-to-late April survey that followed for five seasons. After interest, the October buyer of urea came out ahead three times, lost by under $2 an acre once and lost $45 an acre once.
Evidence: The prices are DTN national averages [11][12][13][14][15][16][17][18][19][20]. The result column charges every season the same 3.8% carry used above, which is a simplification: borrowing rates were lower in 2021.
| Season | Early October, $/ton | Following April, $/ton | Change, $/ton | Change | October buyer's result after carry, $/acre |
|---|---|---|---|---|---|
| 2021–22 | 653 | 1,004 | +351 | +53.8% | +63.85 |
| 2022–23 | 826 | 626 | −200 | −24.2% | −45.24 |
| 2023–24 | 573 | 585 | +12 | +2.1% | −1.89 |
| 2024–25 | 485† | 577 | +92 | +19.0% | +14.41 |
| 2025–26 | 609 | 858 | +249 | +40.9% | +44.22 |
| Five-season average | +101 | +15.07 |
Source: DTN/Progressive Farmer Retail Fertilizer Trends, national average retail urea. October weeks: Oct 4–8, 2021; Oct 3–7, 2022; Oct 2–6, 2023; Oct 7–11, 2024; Sep 29–Oct 3, 2025. April weeks: Apr 25–29, 2022; Apr 17–21, 2023; Apr 15–19, 2024; Apr 14–18, 2025; Apr 13–17, 2026. Result is a Crop Root Zone calculation: April price minus October price plus 3.78% carry, at 920 lb N per ton and 180 lb N per acre. †The Oct 7–11 week is the earliest October 2024 survey we could retrieve.
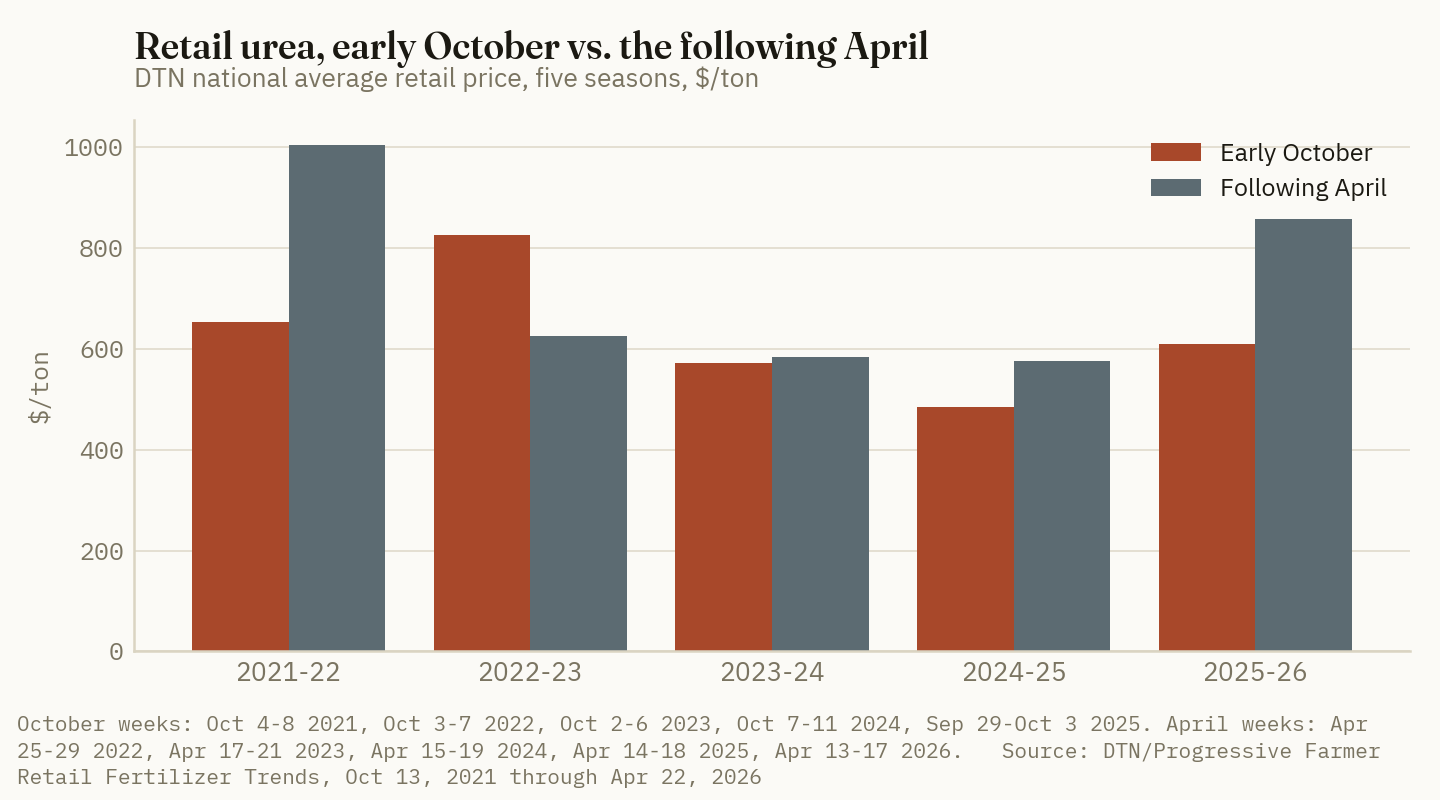
Anhydrous and UAN32 give the same count. October anhydrous beat April after carry by $76.90, $7.35 and $29.67 an acre in 2021–22, 2024–25 and 2025–26, and lost $49.12 and $2.84 in the other two. UAN32 won by $72.22, $23.84 and $27.12 and lost $47.71 and $3.27 (our calculations from the same DTN reports). Our September 23 piece ran the anhydrous comparison from mid-September and added the agronomic cost of fall application [23]. The point here is narrower: the pattern is common to all three products, so it is a nitrogen pattern and not a urea one.
The average flatters the October buyer. Two of the three wins contain a war. In 2025–26, retail urea was $611 in the last week of February, $2 above October, and the entire gain came after the Hormuz escalation (DTN/Progressive Farmer, Mar 4, 2026) [21]. In 2021–22, urea was already $887 by early December, so $234 of the $351 was in place before the invasion of Ukraine [12]. Sort the five seasons by what a buyer could have known in October and the record is one supply-driven rally (2021), one ordinary seasonal rise (2024), one flat year (2023), one year that was flat until a shock in March (2025) and one collapse from a shocked starting price (2022).
That last case deserves attention this year. The October 2022 buyer paid $826 for urea six months after a price spike, and April came in $200 lower. This October follows an April spike as well. The difference is how much has already come out. Retail urea has fallen from $858 in April to $675 [20][1], a 21% decline before the fall-to-spring window opens. In 2022 the October price was still within 18% of that spring's $1,004 [12][13].
5. India's tender closes Wednesday, inside most quote windows
What's new: Indian Potash Limited is seeking 1.7 million tonnes of urea in a tender that closes October 7, with price bids opened the same day and offers valid to October 15 (Fertilizer Daily, Sep 29, 2026) [6]. It is the first dated price event of the spring 2027 buying season.
Evidence: The tender asks for 1.0 million tonnes for the west coast and 0.7 million for the east. An amendment moved the latest sailing date to December 1 from December 15 [6]. India's previous tender in August cleared at $390.25 a tonne CFR on the east coast and $393.65 on the west, with Chinese suppliers taking about two-thirds of the volume (Fertilizer Daily, Sep 7, 2026) [9].
Prices have moved since, but not evenly across grades. Chinese granular urea rose from under $390 a tonne f.o.b. in mid-August to $450–455, while Chinese prilled urea gained only about $30, to roughly $380 (Profercy, Sep 23, 2026) [8]. Middle East granular was about $465 f.o.b. on September 25 (Fertilizer Daily, Sep 28, 2026) [7]. India buys both grades. A tender priced off granular would have to clear $56 to $75 above August just to match f.o.b. values before freight. A tender filled largely with Chinese prilled could clear much closer to the last one. Profercy notes that most Chinese output is prilled and has few outlets besides India [8]. We do not forecast the result.
What the result is worth to a US buyer can be bounded. Each $10 a tonne is $9.07 a short ton, 0.99 cents a pound of nitrogen, or $1.77 an acre at 180 lb, if it passes through to the barge and the retail counter in full. This desk measured retail urea capturing under a third of a large international move over five months this summer [23]. At one-third, $10 a tonne is about 59 cents an acre. A $50 swing in the tender, in either direction, is therefore worth $3 to $9 an acre, about the size of the interest bill in section 2.
Ground Truth: The cheapest hedge available this week costs nothing. It is a written spring quote that stays open past Wednesday. The barge fell $23 on the front contract in nine days while retail rose $16, so a price locked today is built on September's barge, not October's. If the tender clears near August's level, the barge has little reason to recover, and the retail spread of $222.50 has room to give back $50 or more before spring. If it clears $50 higher, the quote in hand is already priced for that. A retailer who will not hold a quote for three days is telling the buyer which way the retailer expects Wednesday to go.
What to watch after Wednesday:
- The tender's lowest offers and the volume booked. A price in the low $400s CFR with full volume says prilled supply set it. A price above $450 says India paid for granular.
- DTN's survey for September 28–October 2, due this week. If retail urea rises again while the October contract sits at $437, the spread passes $240.
- The April and May 2027 contracts. They moved from a placeholder $407.50 to $455 and $450 without trading [2]. A real print there would be the first market price for the application window.
- The next Illinois and Iowa dealer reports, due October 16. Illinois urea asks rose $48 in two weeks into a falling barge [4]. That does not usually last.
References
- DTN/Progressive Farmer, "Anhydrous Leads Fertilizer Prices Higher, Up 25% From a Year Ago," Sep 30, 2026 (retail survey Sep 21–25, 2026). https://www.dtnpf.com/agriculture/web/ag/crops/article/2026/09/30/anhydrous-leads-fertilizer-prices-25
- Farmbucks, "Urea (US Gulf) Futures (CBOT UFV)" contract chain, last trade date shown Oct 2, 2026, 3:36 p.m. CT, data from DTN, CME Group and ICE; accessed Oct 5, 2026. https://farmbucks.com/futures/fertilizer/urea-us-gulf
- Advanced Turf Solutions, "U.S. Fertilizer Market Summary," Sep 28, 2026 (prices as of Sep 25, 2026). https://www.advancedturf.com/wp-content/uploads/2026/04/ATS-Fertilizer-Market-Update-9_28_2026.pdf
- USDA AMS, Illinois Production Cost Report (Bi-weekly), week ending Oct 2, 2026. https://www.ams.usda.gov/mnreports/ams_3195.pdf
- USDA AMS, Iowa Production Cost Report (Bi-Weekly), week ending Sep 18, 2026 (latest edition posted when accessed Oct 5, 2026). https://www.ams.usda.gov/mnreports/ams_2863.pdf
- Fertilizer Daily, K. Clarksen, "India urea tender: IPL seeks 1.7 million tonnes," Sep 29, 2026. https://www.fertilizerdaily.com/20260929-india-urea-tender-ipl-1-7-million-tonnes-december/
- Fertilizer Daily, "India opens 1.7m tonne urea tender as Q4 prices rebound," Sep 28, 2026 (prices as of Sep 25, 2026). https://www.fertilizerdaily.com/20260928-india-opens-1-7m-tonne-urea-tender-as-q4-prices-rebound/
- Profercy, "Urea: Chinese prilled availability to be tested as India returns with fresh tender," Sep 23, 2026. https://www.profercy.com/insights/urea-chinese-prilled-availability-to-be-tested-as-india-returns-with-fresh-tender
- Fertilizer Daily, K. Clarksen, "China to ship 1.2 million tonnes of urea to India as prices plunge 58% from April's $935 peak," Sep 7, 2026. https://www.fertilizerdaily.com/20260907-china-urea-india-tender-1-2-million-tonnes-2026/
- Federal Reserve Bank of Kansas City, F. Scott, "New Farm Loan Originations Ease Slightly," Jul 10, 2026 (National Survey of Terms of Lending to Farmers, second quarter 2026). https://www.kansascityfed.org/center-for-agriculture-and-the-economy/agricultural-finance/new-farm-loan-originations-ease-slightly/
- DTN/Progressive Farmer, DTN Retail Fertilizer Trends, Oct 13, 2021 (retail survey Oct 4–8, 2021). https://www.dtnpf.com/agriculture/web/ag/crops/article/2021/10/13/anhydrous-breaks-800-per-ton-prices
- DTN/Progressive Farmer, DTN Retail Fertilizer Trends, Jun 1, 2022 (price tables including Dec 6–10, 2021 and Apr 25–29, 2022). https://www.dtnpf.com/agriculture/web/ag/crops/article/2022/06/01/stagnant-retail-fertilizer-prices-2
- DTN/Progressive Farmer, DTN Retail Fertilizer Trends, Oct 12, 2022 (retail survey Oct 3–7, 2022). https://www.dtnpf.com/agriculture/web/ag/crops/article/2022/10/12/average-price-10-34-0-starter-6-2022
- DTN/Progressive Farmer, DTN Retail Fertilizer Trends, Apr 26, 2023 (retail survey Apr 17–21, 2023). https://www.dtnpf.com/agriculture/web/ag/crops/article/2023/04/26/anhydrous-drops-1-000-per-ton-first
- DTN/Progressive Farmer, DTN Retail Fertilizer Trends, Oct 11, 2023 (retail survey Oct 2–6, 2023). https://www.dtnpf.com/agriculture/web/ag/crops/article/2023/10/11/anhydrous-leads-half-fertilizer
- DTN/Progressive Farmer, DTN Retail Fertilizer Trends, Apr 24, 2024 (retail survey Apr 15–19, 2024). https://www.dtnpf.com/agriculture/web/ag/crops/article/2024/04/24/major-fertilizer-prices-continue
- DTN/Progressive Farmer, DTN Retail Fertilizer Trends, Oct 15, 2024 (retail survey Oct 7–11, 2024). https://www.dtnpf.com/agriculture/web/ag/crops/article/2024/10/15/retail-fertilizer-prices-continue
- DTN/Progressive Farmer, "UAN32 Retail Price Up 9%, UAN28 Price Up 7% From Last Month," Apr 23, 2025 (retail survey Apr 14–18, 2025). https://www.dtnpf.com/agriculture/web/ag/crops/article/2025/04/23/uan32-retail-price-9-uan28-price-7
- DTN/Progressive Farmer, DTN Retail Fertilizer Trends, Oct 8, 2025 (retail survey Sep 29–Oct 3, 2025). https://www.dtnpf.com/agriculture/web/ag/crops/article/2025/10/08/anhydrous-dap-lead-retail-fertilizer
- DTN/Progressive Farmer, "6 Fertilizer Prices See Sizeable Moves Higher," Apr 22, 2026 (retail survey Apr 13–17, 2026). https://www.dtnpf.com/agriculture/web/ag/news/article/2026/04/22/6-fertilizer-prices-see-sizeable
- DTN/Progressive Farmer, "Seven of Eight Major Fertilizers are Higher Priced to End February," Mar 4, 2026 (retail survey Feb 23–27, 2026). https://www.dtnpf.com/agriculture/web/ag/crops/article/2026/03/04/seven-eight-major-fertilizers-higher
- Greg Ibendahl, "The Nitrogen Forecast," Agricultural Economics (Substack), Sep 8, 2026. https://agricultural.substack.com/p/the-nitrogen-forecast
- Crop Root Zone, "The Urea Curve Charges $17 a Ton to Carry Nitrogen From September to March. In the Last Two Springs It Missed by $74 and $105," Sep 24, 2026 (Sep 23 futures chain, retail-to-barge spreads, spring forecast misses); "September Anhydrous Beat the Following April in Three of the Last Four Seasons. At $938 a Ton, Fall Wins Only if Spring Tops About $1,041," Sep 23, 2026; "World Urea Fell 61% Since April. US Retail Urea Fell 18%. Less Than a Third Got Through," Aug 24, 2026 (retail pass-through).
Disclosures
Crop Root Zone is an independent publication. Nothing here is investment advice. Market calls, where included, reflect the editors' own read and are not a recommendation to buy or sell any security.
Gulf TSP Sits $89 a Tonne Under DAP. That Pays 22 Cents a Pound for Nitrogen That Costs 60 at Retail. TSP Is the Cheaper Fall Phosphate Only Below $858 a Ton.
World Bank August benchmarks put Gulf TSP $89 a tonne under DAP, valuing DAP's nitrogen at 22 cents a pound; at September retail prices TSP must be quoted under $858 a ton to beat MAP with no nitrogen credit, and under $710 with full credit.
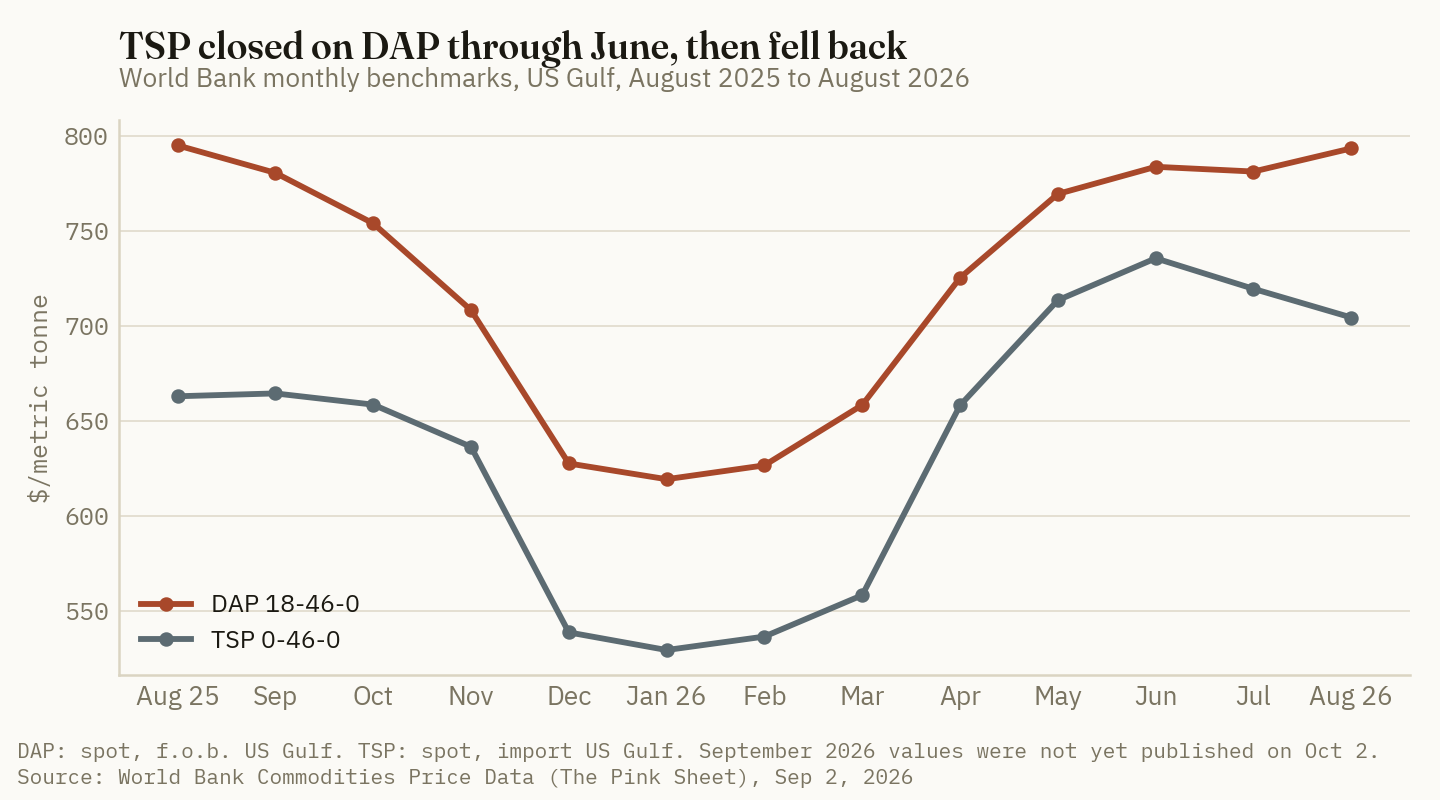
The World Bank's September fertilizer prices are not out. As of this morning, October 2, the October edition of the Pink Sheet had not been posted. The latest edition is dated September 2 and carries August averages (World Bank, Sep 2, 2026) [1]. This piece therefore uses August benchmarks and late-September retail surveys. On those numbers, triple superphosphate (TSP, 0-46-0) at the US Gulf averaged $704.40 a tonne in August and DAP averaged $793.50. The gap is $89.10. A year earlier it was $132.20, and in June it was $48.20. Mid-August also brought a 54,000-tonne Moroccan TSP cargo into New Orleans, the first Moroccan phosphate shipment since duties were suspended and after five years of restricted access (World Fertilizer, Aug 24, 2026) [10]. So more TSP is on offer this fall, and the question for a buyer is whether it is the cheaper phosphate. The short answer is that it depends on what the nitrogen in DAP and MAP is worth on the field in question.
1. The benchmark: TSP fell for a second month while DAP rose
What's new: August TSP was down 2.1% from July and down $31.20 from its June high of $735.60. DAP went the other way, up 1.6% on the month. The gap between them nearly doubled in two months.
Evidence: The World Bank series are monthly averages in dollars per metric tonne. DAP is spot, f.o.b. US Gulf. TSP is spot, import US Gulf. Phosphate rock is f.o.b. North Africa. Urea is f.o.b. Middle East (World Bank, Sep 2, 2026) [2].
| Benchmark | Aug 2026, $/t | MoM | YoY | Basis |
|---|---|---|---|---|
| DAP 18-46-0 | 793.50 | +1.6% | −0.2% | Spot, f.o.b. US Gulf |
| TSP 0-46-0 | 704.40 | −2.1% | +6.3% | Spot, import US Gulf |
| Phosphate rock | 170.00 | 0.0% | +11.5% | F.o.b. North Africa |
| Urea | 390.00 | −2.5% | −23.2% | F.o.b. Middle East |
Source: World Bank Commodities Price Data (The Pink Sheet), Sep 2, 2026, and the accompanying monthly data file. Percent changes are Crop Root Zone's. $/metric tonne.
Two details are easy to miss. First, over twelve months DAP is flat and TSP is up 6.3%. The product without nitrogen gained on the product with it, in a year when nitrogen spiked. Second, the rock price has started to move. It sat at $152.50 a tonne every month from December 2023 through May 2026, then went to $156.90 in June and $170.00 in July and August [2].
2. The gap pays 22 cents a pound for nitrogen that costs 60
What's new: DAP and TSP carry the same 46% P2O5. The only nutrient difference is DAP's 18% nitrogen. That makes the price gap a price for nitrogen, and it is a low one.
Evidence: A tonne of DAP holds 180 kg of nitrogen, or 396.8 lb. An $89.10 gap spread over 396.8 lb is $0.225 per pound of N. The same month, urea at $390 a tonne f.o.b. Middle East put nitrogen at $0.385 a pound before freight [1]. At the US retail counter, DTN's survey for September 21–25 has nitrogen at $0.60 a pound as anhydrous, $0.73 as urea, $0.74 as UAN32 and $0.76 as UAN28 (DTN/Progressive Farmer, Sep 30, 2026) [3].
| Where the nitrogen is bought | $/lb N | |
|---|---|---|
| Inside DAP, at the Gulf TSP gap (Aug) | 0.22 | ███░░░░░░░ |
| Urea, f.o.b. Middle East (Aug) | 0.38 | █████░░░░░ |
| Retail anhydrous (Sep 21–25) | 0.60 | ████████░░ |
| Retail urea (Sep 21–25) | 0.73 | ██████████ |
| Retail UAN32 (Sep 21–25) | 0.74 | ██████████ |
| Retail UAN28 (Sep 21–25) | 0.76 | ██████████ |
Source: World Bank Pink Sheet, Sep 2, 2026 (first two rows, Crop Root Zone calculation); DTN/Progressive Farmer, Sep 30, 2026 (retail rows, national average). Benchmark rows are wholesale, f.o.b. or import basis; retail rows are delivered to farm.
$0.22 per pound of nitrogen
What the August gap between Gulf DAP and Gulf TSP pays for the nitrogen in DAP. Retail anhydrous nitrogen cost $0.60 in late September. (Crop Root Zone calculation from World Bank Pink Sheet, Sep 2, 2026; DTN/Progressive Farmer, Sep 30, 2026)
The gap has not followed nitrogen at any point in the past year. When urea more than doubled between January and April, the DAP–TSP gap shrank.
| Month | DAP, $/t | TSP, $/t | Gap, $/t | TSP as % of DAP | N value in the gap, $/lb | Urea N, $/lb |
|---|---|---|---|---|---|---|
| Aug 2025 | 795.10 | 662.90 | 132.20 | 83.4% | 0.333 | 0.501 |
| Nov 2025 | 708.30 | 636.30 | 72.00 | 89.8% | 0.181 | 0.404 |
| Feb 2026 | 626.50 | 536.30 | 90.20 | 85.6% | 0.227 | 0.465 |
| Apr 2026 | 725.30 | 658.10 | 67.20 | 90.7% | 0.169 | 0.845 |
| Jun 2026 | 783.80 | 735.60 | 48.20 | 93.9% | 0.121 | 0.447 |
| Jul 2026 | 781.30 | 719.50 | 61.80 | 92.1% | 0.156 | 0.394 |
| Aug 2026 | 793.50 | 704.40 | 89.10 | 88.8% | 0.225 | 0.385 |
Source: World Bank monthly commodity price data, updated Sep 2, 2026. Gap, ratio and per-pound nitrogen values are Crop Root Zone calculations (396.8 lb N per tonne of DAP; 1,014 lb N per tonne of urea). US Gulf basis for DAP and TSP; Middle East f.o.b. for urea.
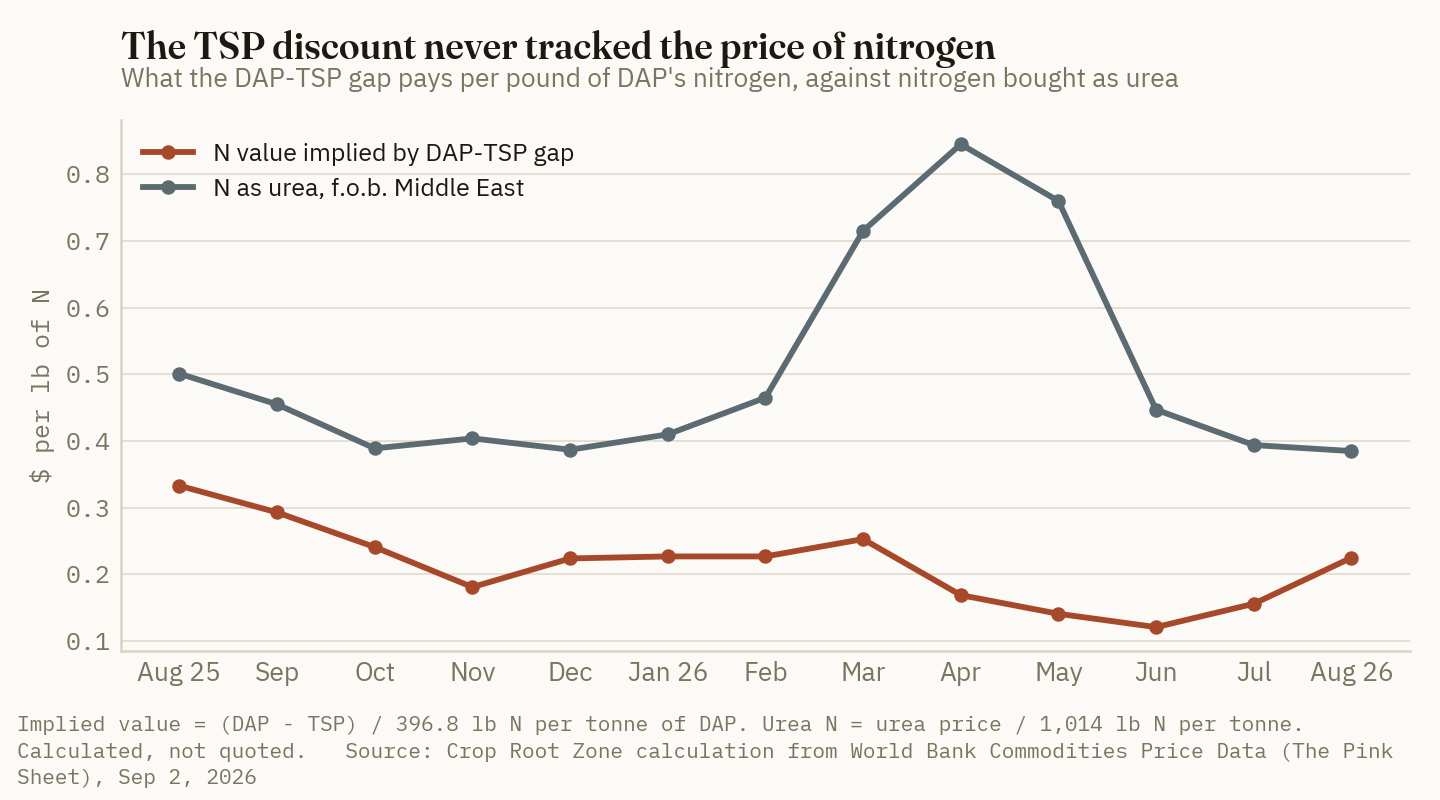
In April, urea nitrogen cost $0.845 a pound and the gap paid $0.169 for the nitrogen in DAP, a fifth as much. August's 88.8% ratio is ordinary by longer standards. Across the 120 months from 2015 through 2024, TSP averaged 89.4% of the DAP price in the same World Bank series (our calculation) [2].
Ground Truth: The TSP discount is not a nitrogen price and does not behave like one. At the benchmark level a DAP buyer gets nitrogen for about 22 cents a pound, a little over a third of what the same pound costs as retail anhydrous. That reverses the usual instinct. TSP is not cheap phosphate with the nitrogen stripped out. DAP is phosphate with cheap nitrogen attached. TSP comes out ahead only for a buyer whose field will not use that nitrogen, so the first question to ask about a TSP quote is agronomic: how much of the 18% will the next crop actually get?
3. Why the gap closed to $48 and reopened to $89
What's new: Three sourced developments line up with the move: an input-cost shock that pushed the largest exporter toward TSP, thin TSP supply into the United States, and the return of Moroccan product in August.
Evidence: The cost shock came first. The World Bank reported in May that DAP rose more than 10% in April, that sulfur prices had doubled since January, and that China's tighter export controls added pressure (World Bank Data Blog, May 14, 2026) [6]. TSP rose faster than DAP through that stretch. From February to June DAP gained $157.30 a tonne and TSP gained $199.30 [2].
Morocco's OCP responded by changing its product mix. Reuters reported in June that the company cut output by about 30% in the second quarter because of sulfur costs, that TSP now makes up 65% of the fertilizer volumes of its OCP Nutricrops unit, and that TSP needs "much less sulphur and no ammonia" (Reuters via Hespress, Jun 19, 2026) [7].
US supply of TSP was thin while this happened. S&P Global reported that US TSP imports fell 20.16% in the first half to 179,326 tonnes, with Israel the largest supplier at 124,309 tonnes, about 69% of the total (S&P Global, Aug 11, 2026) [8]. We could not open that page and are relying on the indexed summary. Moroccan product was shut out by countervailing duties until Commerce published a notice on July 8 allowing duty-free entry under a June 29 emergency proclamation, for eight months or the length of the emergency (Federal Register, Jul 8, 2026) [9]. Our earlier piece, "Washington Suspended the 16.60% Moroccan Phosphate Duty on July 8. Ten Weeks Later Retail DAP Is $923/st," covered what that did to DAP. Its effect on TSP is clearer.
The first cargo under the suspension was TSP. About 54,000 tonnes arrived at the Port of New Orleans in mid-August (World Fertilizer, Aug 24, 2026) [10]. That single vessel equals 30% of all the TSP the country imported in the first half. OCP has said more cargoes will follow during the suspension, subject to customs requirements and customer demand (Hespress, Aug 2026) [11]. The benchmark moved with it. Between June and August TSP fell $31.20 a tonne while DAP rose $9.70 [2]. That timing is a coincidence of dates, not proof of cause. The US Gulf TSP market is small enough that one vessel can plausibly move a monthly average.
Demand is the limit. Progressive Farmer noted when the cargo landed that TSP "is not as popular in the U.S. marketplace as MAP or DAP" (Farm Policy News, University of Illinois, Aug 2026) [12].
The cost side says the gap could be wider than it is. This is our estimate, and the inputs are engineering assumptions. A tonne of DAP takes about 0.219 t of ammonia. At the September Tampa contract of $555 a tonne (Fertilizer Daily, Sep 10, 2026) [13] that is about $122. TSP uses none. On sulfur, roughly a third of the phosphate in TSP comes straight from rock that phosphoric acid dissolves, so it needs about two-thirds to three-quarters of the sulfur per unit of P2O5. With the Tampa sulfur contract still at $705 a long ton (Advanced Turf Solutions market summary, Sep 28, 2026) [14], and using the 0.405 t of sulfur per tonne of DAP from our earlier sulfur coverage, DAP carries about $281 of sulfur a tonne and TSP about $187 to $211. Add the two and DAP costs roughly $190 to $215 a tonne more to make than TSP**. The Gulf pays $89 more for it.
*Crop Root Zone engineering estimate from published contract prices; not a reported production cost.
Ground Truth: TSP is priced against DAP, not against its own cost. On our estimate a seller keeps about $100 to $125 a tonne more on TSP than on DAP at August Gulf values, which is reason enough for the largest exporter to move two-thirds of its volume there. It also tells a US buyer what to expect. The discount will widen only as fast as competing cargoes arrive, and the duty-free window that lets them in runs to about the end of February 2027. If two or three more Moroccan vessels land before the river closes, a Gulf gap back above last August's $132 is plausible. If they do not, TSP will go on tracking DAP at about 89% of its price, and the retail discount will stay too small to matter for anyone who can use the nitrogen.
4. At the retail counter there is no public TSP price. Here is what a quote has to beat.
What's new: DTN's weekly retail survey covers eight fertilizers and TSP is not one of them [3]. The USDA dealer surveys for Illinois and Iowa do not list it either [4][5]. A grower offered TSP this fall has no public number to check it against. The break-evens below are meant to fill that gap.
Evidence: DTN's national averages for September 21–25 were $926 a ton for DAP and $970 for MAP, up 3% and 5% on the year [3]. USDA's Illinois report for the week ending September 18 had dealer asks averaging $928.57 for DAP and $935.00 for MAP, f.o.b. (USDA AMS, Sep 18, 2026) [4]. Iowa's had MAP at $950.00 and no DAP line (USDA AMS, Sep 18, 2026) [5]. The next bi-weekly reports had not been posted when this was written.
For a TSP figure we can only estimate. Applying the August Gulf ratio of 88.8% to retail DAP gives $822 a ton. Subtracting the Gulf gap, converted to $81 a short ton, gives $845. We use $822 to $845 a ton* and mark it as an estimate throughout. A real quote may sit outside that range.
The nitrogen credit is the other variable, and the research on it is specific. A three-year study at Urbana, Illinois and Waseca, Minnesota found that 31% to 35% of the nitrogen in fall-applied DAP, MAP and ammonium sulfate was recovered in the soil by late May, against 90% to 100% for spring applications. The authors concluded that about one-third is available to the next corn crop (Fernández et al., Agronomy Journal, 2010) [15]. The University of Illinois's Emerson Nafziger has written that full credit is reasonable when these products go on after soils cool, around November 1 or later, and that it is reasonable to subtract 20% to 30% for early October applications (farmdoc daily, Mar 29, 2019) [16]. Ahead of soybeans we assign the nitrogen no value. That gives four cases: none, one-third, 75% and full. We value the nitrogen at $0.60 a pound, the retail anhydrous price, because that is the cheapest nitrogen it would replace.
| Product | $/st | Lb P2O5 per ton | No N credit | One-third credit | 75% credit | Full credit |
|---|---|---|---|---|---|---|
| DAP 18-46-0 | 926 | 920 | 1.007 | 0.928 | 0.830 | 0.772 |
| MAP 11-52-0 | 970 | 1,040 | 0.933 | 0.890 | 0.838 | 0.806 |
| TSP 0-46-0 | 822–845* | 920 | 0.89–0.92* | 0.89–0.92* | 0.89–0.92* | 0.89–0.92* |
Source: DTN/Progressive Farmer, Sep 30, 2026 (DAP and MAP, national average retail, delivered, week of Sep 21–25). Credit columns are $ per lb of P2O5 after valuing nitrogen at $0.60/lb (DTN retail anhydrous) and are Crop Root Zone calculations. *TSP is a Crop Root Zone estimate from the World Bank August Gulf ratio and gap applied to retail DAP; no public retail survey quotes it.
With no credit, MAP is the cheaper of the two ammoniated products and TSP only has to beat MAP. With full credit, DAP is the cheaper and TSP has to beat a much lower number. DAP overtakes MAP once about 68% of its nitrogen is counted at $0.60, a crossover we worked through in "MAP Costs $43 More Per Ton Than DAP and Is Cheaper Per Pound of Phosphate. Then You Credit the Nitrogen and It Flips Back."
For a rate we use Iowa State's default yields and removal coefficients: 210 bushels of corn at 0.32 lb P2O5 and 70 bushels of soybeans at 0.72 lb, or about 118 lb P2O5 an acre for a single application covering both crops (Iowa State University, PM 1688, Feb 2023) [17]. At that rate DAP delivers 46 lb of nitrogen an acre and MAP delivers 25 lb.
| Nitrogen credit case | DAP, $/acre | MAP, $/acre | TSP, $/acre | TSP break-even, $/st |
|---|---|---|---|---|
| None (ahead of soybeans) | 118.77 | 110.06 | 105–108* | 858 |
| One-third (fall, warm soil, ahead of corn) | 109.53 | 105.07 | 105–108* | 819 |
| 75% (early October, ahead of corn) | 97.99 | 98.83 | 105–108* | 764 |
| Full (after soils cool, or spring) | 91.07 | 95.08 | 105–108* | 710 |
Source: Crop Root Zone calculation at 118 lb P2O5 an acre from DTN/Progressive Farmer retail prices, Sep 30, 2026, with nitrogen at $0.60/lb. Break-even is the TSP price per short ton that matches the cheaper of DAP and MAP in that row. Credit fractions follow Fernández et al. (2010) and Nafziger (2019). *Estimated TSP price of $822–845/st; not a surveyed retail price.
Read across the rows. With no credit, estimated TSP saves $2 to $5 an acre against MAP and $10 to $13 against DAP. At one-third credit it is level with MAP to $3 an acre worse. At 75% credit it costs $7 to $10 an acre more than DAP. At full credit it costs $14 to $17 more. Valuing the nitrogen at retail urea's $0.73 instead of $0.60 lowers the full-credit break-even to $663 a ton.
Local prices move the line. At Illinois dealer asks, where MAP is only $6.43 over DAP, the no-credit break-even falls to about $827 a ton. At Iowa's MAP ask it is about $840 [4][5].
5. Where TSP earns its place this fall, and what to watch
What's new: The arithmetic sorts fall acres into those where TSP can pay and those where it cannot, and the dividing line is rotation and soil temperature more than price.
Evidence: The break-evens above give three working rules.
- Ahead of soybeans, TSP wins at any quote under about $858 a ton, and under about $827 to $840 where MAP is priced close to DAP. The saving is small, a few dollars an acre at our estimated price. It is the only case where the benchmark gap of $81 a short ton is wide enough.
- Ahead of corn in early fall, it is close to a wash. If only a third of the nitrogen survives, TSP needs to be under about $819. If 70% to 80% survives, it needs to be under about $764. Our estimated retail range is above both.
- After soils cool, or in spring, DAP is the cheaper phosphate unless TSP is quoted under about $710 a ton. That is $216 below retail DAP. The Gulf gap is $81.
There is one non-price argument for TSP. It lets a grower apply phosphate without applying nitrogen in the fall, a point made in coverage of the August cargo, which described TSP as a fit for 4R nutrient management [10]. On ground where fall nitrogen is restricted or simply unwanted, the product has a use even at parity. That is an agronomic choice, and the tables above show what it costs.
What would change the read:
- The September Pink Sheet figures, due within days. A TSP price below $690 with DAP holding near $790 would put the gap above $100 and the nitrogen value above $0.25 a pound.
- More Moroccan cargoes. OCP has said they are coming [11]. The duty-free window closes around the end of February 2027 unless it is extended [9].
- The fourth-quarter Tampa sulfur contract, which we covered in "The Fourth-Quarter Sulfur Price Is Not Public Yet. Every $100 a Long Ton It Settles Adds $36 to a Ton of DAP." Because TSP needs less sulfur per unit of phosphate, a higher settlement widens its cost advantage. Whether the price gap follows depends on supply, as section 3 argues.
- A published retail TSP price. There is none today. If your retailer quotes one, the break-even column in section 4 is the comparison.
References
- World Bank, Commodities Price Data (The Pink Sheet), Sep 2, 2026 (August 2026 monthly averages; latest edition available on Oct 2, 2026). https://thedocs.worldbank.org/en/doc/74e8be41ceb20fa0da750cda2f6b9e4e-0050012026/related/CMO-Pink-Sheet-September-2026.pdf
- World Bank, Commodity Markets: monthly prices data file (CMO Historical Data Monthly), updated Sep 2, 2026 (monthly DAP, TSP, phosphate rock and urea series, 1960 to present; series definitions). https://thedocs.worldbank.org/en/doc/74e8be41ceb20fa0da750cda2f6b9e4e-0050012026/related/CMO-Historical-Data-Monthly.xlsx
- DTN/Progressive Farmer, "Anhydrous Leads Fertilizer Prices Higher, Up 25% From a Year Ago," Sep 30, 2026 (retail prices for the week of Sep 21–25, 2026). https://www.dtnpf.com/agriculture/web/ag/crops/article/2026/09/30/anhydrous-leads-fertilizer-prices-25
- USDA AMS, Illinois Production Cost Report (Bi-weekly), week ending Sep 18, 2026. https://www.ams.usda.gov/mnreports/ams_3195.pdf
- USDA AMS, Iowa Production Cost Report (Bi-Weekly), week ending Sep 18, 2026. https://www.ams.usda.gov/mnreports/ams_2863.pdf
- World Bank Data Blog, J. Baffes and K. Temaj, "Fertilizer prices surge as Strait of Hormuz disruptions tighten supplies," May 14, 2026. https://blogs.worldbank.org/en/opendata/fertilizer-prices-surge-as-strait-of-hormuz-disruptions-tighten-
- Hespress (Reuters), "Morocco's OCP shifts to low-sulphur fertiliser, resumes full output," Jun 19, 2026. https://en.hespress.com/140246-moroccos-ocp-shifts-to-low-sulphur-fertiliser-resumes-full-output.html
- S&P Global Commodity Insights, "US ammonium phosphate fertilizer imports drop in H1 as demand sinks," Aug 11, 2026 (page not reachable at time of writing; figures taken from the publicly indexed summary). https://www.spglobal.com/energy/en/news-research/latest-news/agriculture/081126-us-ammonium-phosphate-fertilizer-imports-drop-in-h1-as-demand-sinks
- US Department of Commerce, International Trade Administration, "Countervailing Duty Order of Phosphate Fertilizers From the Kingdom of Morocco: Temporary Duty Free Importation," 91 FR 42180, Jul 8, 2026. https://www.govinfo.gov/content/pkg/FR-2026-07-08/html/2026-13796.htm
- World Fertilizer, "First new shipment of TSP from OCP arrives in US," Aug 24, 2026. https://www.worldfertilizer.com/phosphates/24082026/first-new-shipment-of-tsp-from-ocp-arrives-in-us/
- Hespress, "First Moroccan fertilizer shipment reaches US after duty suspension," Aug 2026. https://en.hespress.com/143927-143927.html
- Farm Policy News, University of Illinois, "Morocco Phosphate Fertilizer Returns to U.S. Market," Aug 2026 (relaying Progressive Farmer and AgWeb reporting). https://farmpolicynews.illinois.edu/2026/08/morocco-phosphate-fertilizer-returns-to-u-s-market/
- Fertilizer Daily, K. Clarksen, "Tampa ammonia price drops to $555/t in September — 4th straight monthly decline from $825 peak," Sep 10, 2026. https://www.fertilizerdaily.com/20260910-tampa-ammonia-price-555-september-2026-fourth-monthly-decline/
- Advanced Turf Solutions, "U.S. Fertilizer Market Summary," Sep 28, 2026 (prices as of Sep 25, 2026). https://www.advancedturf.com/wp-content/uploads/2026/04/ATS-Fertilizer-Market-Update-9_28_2026.pdf
- F. G. Fernández, R. G. Hoeft, G. W. Randall, J. Vetsch, K. Greer, E. D. Nafziger and M. B. Villamil, "Apparent Nitrogen Recovery from Fall-Applied Ammoniated Phosphates and Ammonium Sulfate Fertilizers," Agronomy Journal 102(6): 1674–1681, 2010. https://doi.org/10.2134/agronj2010.0166
- E. Nafziger, "Managing Nitrogen for Corn in 2019," farmdoc daily, University of Illinois, Mar 29, 2019. https://farmdocdaily.illinois.edu/2019/03/managing-nitrogen-for-corn-in-2019.html
- Iowa State University Extension and Outreach, PM 1688, "A General Guide for Crop Nutrient and Limestone Recommendations in Iowa," revised Feb 2023. https://store.extension.iastate.edu/product/A-General-Guide-for-Crop-Nutrient-and-Limestone-Recommendations-in-Iowa
Disclosures
Crop Root Zone is an independent publication. Nothing here is investment advice. Market calls, where included, reflect the editors' own read and are not a recommendation to buy or sell any security.
The Fourth-Quarter Sulfur Price Is Not Public Yet. Every $100 a Long Ton It Settles Adds $36 to a Ton of DAP — and Lands on Spring 2027, Not This Fall.
As of October 1 no public relay carries the Q4 Tampa sulfur settlement. Even a rollover at $705/lt is up 127% from a year ago. We convert each plausible outcome into dollars per ton of DAP, MAP, AMS and ATS, and per acre.
The fourth-quarter contract for molten sulfur delivered into Tampa covers October through December, and in a normal year it is settled around October 1. As of this morning it has not been published in any public relay we could reach. Green Markets' public sulfur listing dated September 25 still showed the Tampa contract at $705 per long ton CFR, the third-quarter record (Green Markets, Sep 25, 2026). Argus, ICIS and CRU had no public Q4 headline. Neither did the producers' newsrooms. Middle East producers' October posted prices, which buyers use as a cross-check, normally come out around month-end and had not reached public summaries either (Global Agriculture, Sep 24, 2026).
So this piece will not report a number that does not yet exist. It does the next most useful thing. It sets out the published record, shows when a Tampa settlement actually reaches the price of phosphate, and converts every plausible Q4 outcome into dollars per ton of finished fertilizer and dollars per acre. When the settlement prints, a reader can find it in the tables below and skip the arithmetic.
1. What is published, and the year-ago comparison nobody is quoting
What's new: Nothing yet, and that is itself the update. The previous quarter's contract is the latest firm print. The year-ago comparison is the one that matters for a fall budget, and the trade coverage has mostly skipped it.
Evidence: The fourth-quarter 2025 Tampa contract settled at $310/lt delivered, up $58 on the quarter (Argus Media, Oct 2025). Argus's year-end viewpoint confirmed $310/lt as the prevailing level and projected Q1 2026 at $475–520/lt (Argus Media, Dec 30, 2025). The first quarter came in at $495.69/lt CFR, a 13-year high (Green Markets, Mar 6, 2026). Then came $655 and the record $705/lt (Argus Media, Jul 13, 2026).
| Tampa molten sulfur contract | $/lt delivered | vs. year-ago Q4 | |
|---|---|---|---|
| Q4 2025 | 310 | — | ████░░░░░░ |
| Q1 2026 | 495.69 | +60% | ███████░░░ |
| Q2 2026 | 655 | +111% | █████████░ |
| Q3 2026 | 705 | +127% | ██████████ |
| Q4 2026 | Not yet published | — | — |
Source: Argus Media, Oct 2025 and Dec 30, 2025 (Q4 2025); Green Markets, Mar 6, 2026 (Q1 2026); Argus Media, Jul 13, 2026 (Q2, Q3 2026); Green Markets, Sep 25, 2026 (Q3 still posted). Percent changes are Crop Root Zone's.
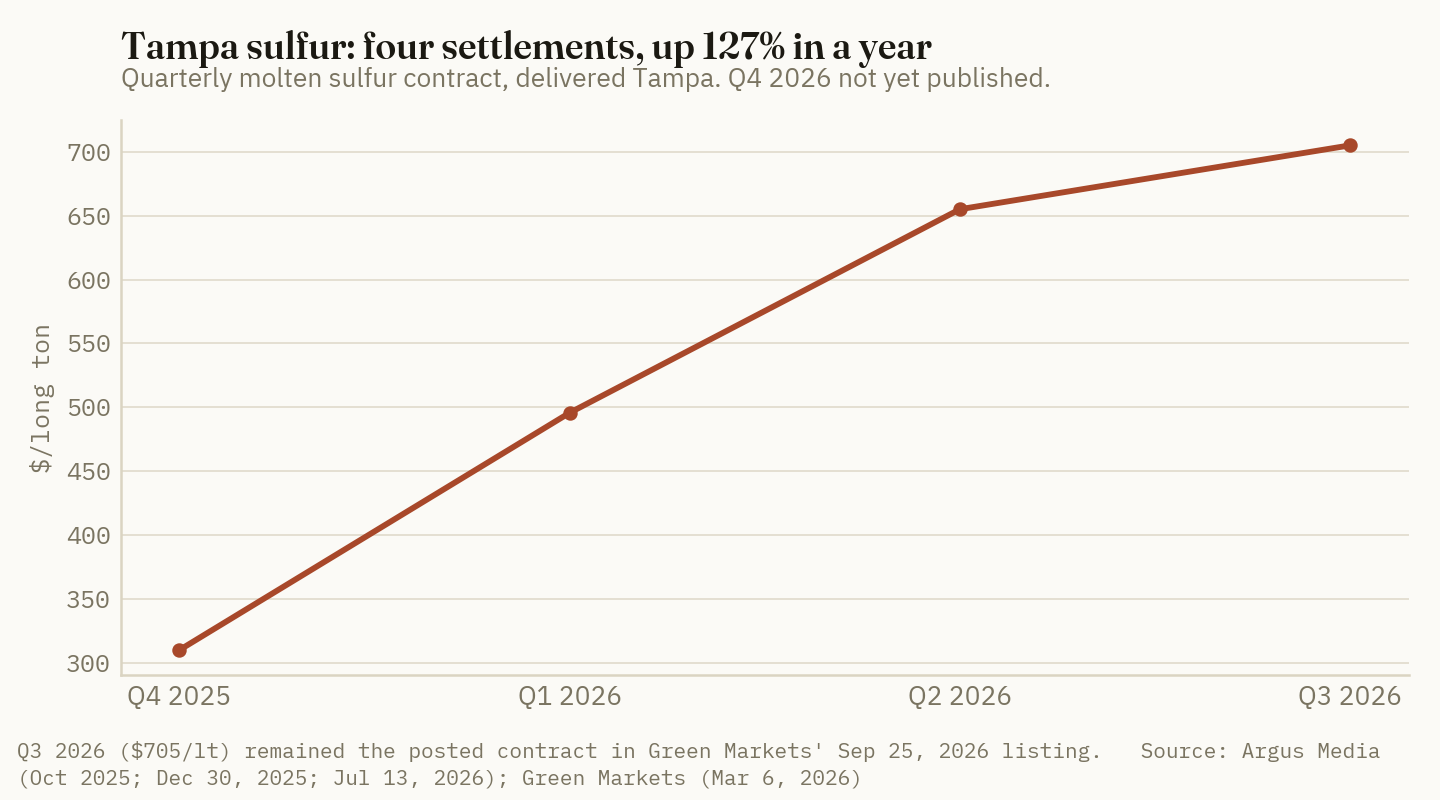
The practical meaning is simple. Even a flat rollover at $705/lt is a 127% year-on-year increase in the Q4 contract. Any Q4 settlement short of a collapse below $310 is a year-on-year increase. A grower comparing this fall's phosphate quote with last fall's is comparing two different sulfur regimes, whatever the October print turns out to be.
What would move the number is also on the record. Argus assessed US Gulf export spot at $1,100–1,150 per tonne fob on July 9, about 60% above the contract (Argus Media, Jul 13, 2026). That gap has since narrowed from the spot side. By the week to September 18 the Middle East fob average was $855/t, South Asia CFR $1,050/t, and Chinese ex-works sulfur in Shandong had fallen 7.2% in a week and about 16% in a month (Global Agriculture, Sep 24, 2026). Trading Economics shows Chinese sulfur futures down 10.5% on the month to October 1 and still up about 190% on the year (Trading Economics, Oct 1, 2026). The softening came from buyers refusing to pay, not from new supply. Hormuz transits were still running at two commercial vessels a day on September 22, against about 125 before the conflict (The National, Sep 22, 2026).
2. A Tampa contract reaches phosphate costs a quarter after it settles
What's new: The largest US phosphate producer has said in its own filings when a Tampa contract shows up in its costs, and the answer is not "the quarter it covers."
Evidence: Mosaic's second-quarter release said it had settled third-quarter sulfur with Gulf Coast refiners at $705/lt and that "this new contract will primarily be reflected in fourth quarter operating results" (Mosaic, Aug 4, 2026). The realized figures show the same lag. Sulfur in Mosaic's first-quarter cost of goods was $379/lt, while the first-quarter contract was $495.69. Sulfur in second-quarter cost of goods was $522/lt, while the second-quarter contract was $655 (Mosaic, Q1 and Q2 2026 releases). In each quarter the realized cost sat between the previous contract and the current one. That is what inventory accounting does to a quarterly input.
| Quarter | Tampa contract, $/lt | Sulfur realized in Mosaic COGS, $/lt | Realized as % of same-quarter contract |
|---|---|---|---|
| Q1 2026 | 495.69 | 379 | 76% |
| Q2 2026 | 655 | 522 | 80% |
| Q3 2026 | 705 | Due with Q3 results | — |
| Q4 2026 | Not yet published | $705 contract "primarily" lands here | — |
Source: Mosaic Company Q1 2026 and Q2 2026 earnings releases (Form 8-K, Exhibit 99.1; Q2 dated Aug 4, 2026); Argus Media, Jul 13, 2026; Green Markets, Mar 6, 2026. Percentages are Crop Root Zone's.
Follow that through the calendar. The $705 contract becomes phosphate cost in October–December, which is the fall application window now under way. The Q4 contract that has not yet printed becomes cost in January–March 2027. That is the period in which spring MAP and DAP is priced, positioned and moved upriver.
Ground Truth: The fall phosphate price is already fixed on the sulfur side. It was set in July at $705. The Q4 settlement is a spring 2027 number, and a buyer should read it that way. The practical consequence: anyone deciding between booking spring phosphate now or after the turn of the year should watch the Q4 Tampa print more closely than the fall retail series. Retail DAP at $926/st (DTN, Sep 30, 2026) is mostly a third-quarter sulfur price. The next sulfur price sits in January's.
3. Converting the contract into dollars per ton of product
What's new: Trade coverage quotes the Tampa number in dollars per long ton of sulfur and leaves the conversion to the reader. Here it is, for the four sulfur-bearing products a North American buyer actually purchases.
Evidence: The conversion depends on how much sulfur each product consumes or contains. For phosphate it is the sulfuric acid used to digest rock: roughly 2.7 tonnes of acid per tonne of P2O5, or about 0.88 tonnes of sulfur per tonne of P2O5. That works out to about 0.405 t of sulfur per tonne of DAP (46% P2O5) and 0.458 t per tonne of MAP (52%). This is our engineering estimate. It agrees with the rule of thumb Global Agriculture cites of 4 tonnes of sulfur for every 10 tonnes of DAP or MAP (Global Agriculture, Sep 24, 2026). For ammonium sulfate (24% S) and ATS (26% S) we use the sulfur in the analysis. That treats the sulfur as if it were bought at contract, which is closer to an opportunity cost than an accounting one, since much North American AMS is a caprolactam byproduct and much ATS is made from refinery tail gas.
There is a cross-check on the AMS figure. In December Argus estimated that the expected Q1 rise of roughly $165–210/lt would add $40–50/st to ammonium sulfate production costs (Argus Media, Dec 30, 2025). That is about $24 per short ton per $100/lt. Our stoichiometric figure is $22.
| Product | Sulfur per short ton, lt | Cost per $100/lt move, $/st | Q4 2025 ($310) | Rollover ($705) | Half the spot gap ($910) | Spot parity (~$1,118) |
|---|---|---|---|---|---|---|
| DAP 18-46-0 | 0.361 | 36 | 112 | 255 | 329 | 404 |
| MAP 11-52-0 | 0.409 | 41 | 127 | 288 | 372 | 457 |
| AMS 21-0-0-24S | 0.217 | 22 | 67 | 153 | 197 | 242 |
| ATS 12-0-0-26S | 0.232 | 23 | 72 | 164 | 211 | 260 |
Source: Crop Root Zone model. Contract inputs from Argus Media (Dec 30, 2025; Jul 13, 2026); spot parity converts Argus's $1,100/t fob US Gulf assessment of Jul 9, 2026 to long tons. Sulfur ratios are engineering estimates; the "half the spot gap" and "spot parity" columns are illustrative scenarios, not forecasts. All values are $ per short ton of product.
$36 a short ton of DAP
What each $100/lt move in the Tampa sulfur contract adds to the sulfur cost inside a ton of DAP. For MAP it is $41. (Crop Root Zone model on Argus Media contract prints, 2025–2026)
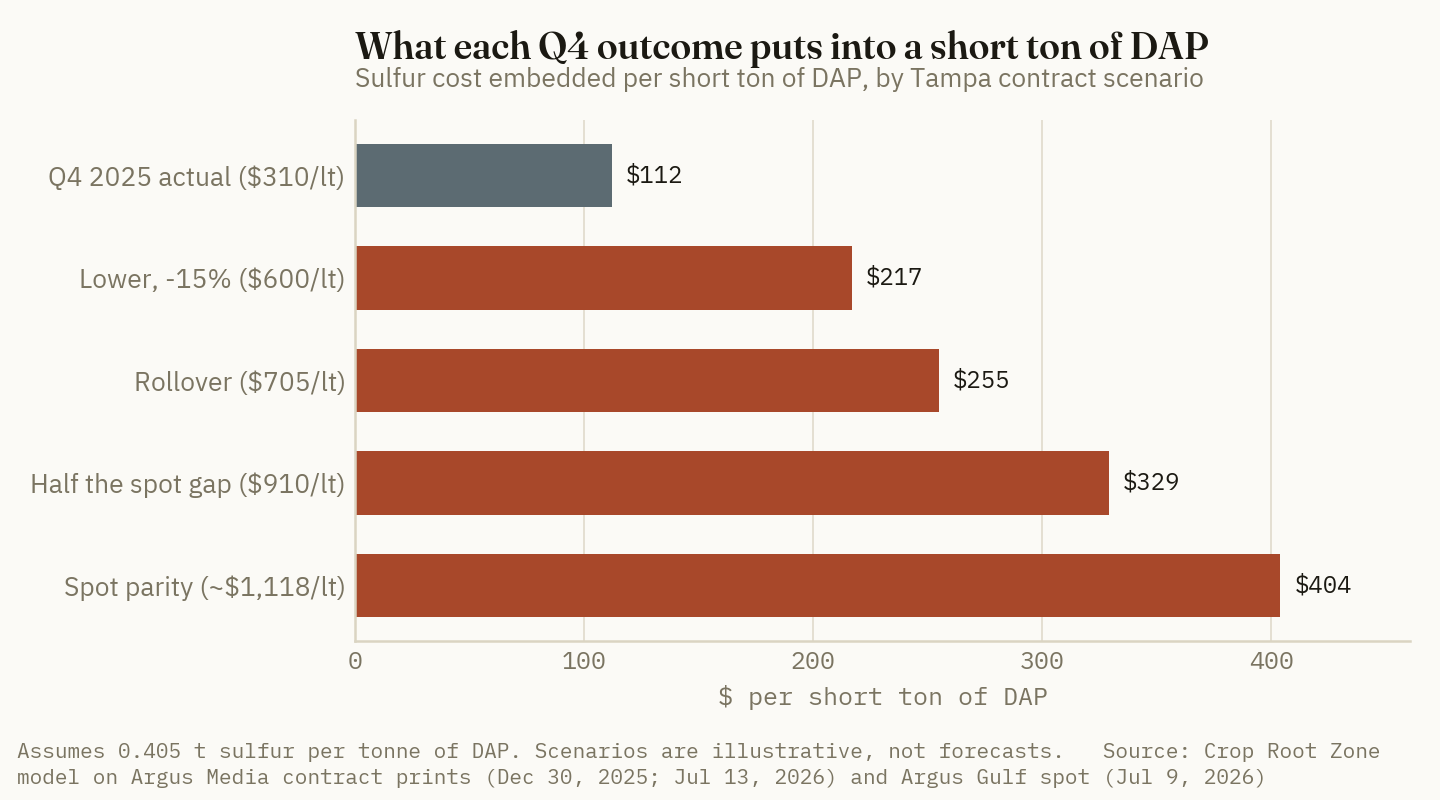
Two things stand out. First, the year-on-year move is already large without any Q4 increase. At a rollover, sulfur inside a ton of DAP costs about $143 more than it did on the Q4 2025 contract. Over the same year, DTN's retail DAP average rose about 3%, roughly $27 a ton, to $926 (DTN, Sep 30, 2026). Most of the sulfur increase has not reached the retail counter. The producer side has paid for it in margin and lost tonnes, which this publication has covered before. Second, the per-ton spread between scenarios is wider than the whole year-on-year retail move. The gap between a rollover and a half-gap settlement is $74 a ton of DAP.
4. What it does per acre, and to the sulfur products
What's new: Per acre, the phosphate exposure is large and the sulfur-product exposure is small. The posted prices of the sulfur products are currently moving the other way.
Evidence: We use three typical program components: 100 lb P2O5 an acre, 100 lb of AMS an acre (24 lb S), and 5 gallons of ATS an acre (about 14 lb S at 11.1 lb/gal). Because the acid requirement is set by the P2O5, the sulfur cost per pound of phosphate is the same whether it arrives as DAP or MAP. That makes the phosphate line one figure, not two.
| Program component | Q4 2025 ($310) | Rollover ($705) | Half the spot gap ($910) | Spot parity (~$1,118) | Per $100/lt |
|---|---|---|---|---|---|
| 100 lb P2O5 as DAP or MAP | 12.18 | 27.70 | 35.75 | 43.92 | 3.93 |
| 100 lb AMS | 3.36 | 7.64 | 9.86 | 12.11 | 1.08 |
| 5 gal ATS | 2.00 | 4.54 | 5.86 | 7.20 | 0.64 |
Source: Crop Root Zone model, $ per acre of embedded sulfur cost, built on the contract and spot inputs in the table above. Application rates are our assumptions for a representative corn program. These are cost-stack values, not retail price forecasts.
On a 100 lb P2O5 program, the year-ago to rollover move is about $15.50 an acre of embedded sulfur cost. A half-gap Q4 settlement adds another $8 or so, landing in spring 2027 product. The AMS and ATS lines move by single-digit dollars per acre in every scenario. The Q4 contract is a phosphate budget question far more than a sulfur-fertilizer question.
The sulfur products are not following their own cost stack at the moment. USDA's Oklahoma report for the week ending September 18 showed ammonium sulfate at $553/st, down $3, and ATS at $415/st, down $10, while DAP rose to $955.80 and the report noted that phosphorus production costs "have risen sharply in recent weeks" (USDA AMS, Sep 18, 2026). At a $705 contract the sulfur content alone accounts for about 28% of that AMS price and 40% of that ATS price.
| Product | $/st | Change vs prior report | Sulfur content at $705 contract, $/st | Share of price | Basis |
|---|---|---|---|---|---|
| DAP 18-46-0 | 955.80 | +2.55 | 255 | 27% | Distributor ask, FOB, Oklahoma |
| MAP 11-52-0 | 942.25 | +0.63 | 288 | 31% | Distributor ask, FOB, Oklahoma |
| Ammonium sulfate | 553.00 | −3.00 | 153 | 28% | Distributor ask, FOB, Oklahoma |
| ATS | 415.00 | −10.00 | 164 | 40% | Distributor ask, FOB, Oklahoma |
Source: USDA AMS Oklahoma Production Cost Report (Bi-Weekly), week ending Sep 18, 2026; sulfur-content values are the Crop Root Zone model above.
The obvious caveat is that AMS and ATS are priced against nitrogen and against import parity as much as against sulfur. Nitrogen has been soft for much of the season outside anhydrous. A softening sulfur-fertilizer price under a record sulfur contract is not a contradiction. It says the byproduct supply chains behind AMS and ATS are not paying Tampa prices for their sulfur. Prices vary widely by region: the Pacific Northwest report for the same week had AMS asks ranging from $600 to $1,110/st, averaging $770.20 (USDA AMS, Sep 18, 2026).
5. The ceiling on the Q4 settlement, and what to watch
What's new: The buyer's own cost structure puts a practical ceiling on the Q4 contract. On our estimate it sits near $1,050/lt.
Evidence: We build a simplified cash cost per tonne of DAP from Mosaic's disclosed inputs. Ammonia at $615/t (the midpoint of its $610–620 third-quarter range) times 0.219 t per tonne of DAP is about $135. Rock at its blended $90/t cost, at an assumed 1.65 t of rock per tonne of DAP, is about $148. Conversion cost is $129/t (Mosaic, Aug 4, 2026; Q2 2026 earnings call). Add sulfur at each contract level and compare the total with Mosaic's third-quarter DAP guidance of $820–840/t FOB plant.
| Tampa contract scenario | Sulfur, $/t DAP | Ammonia + rock + conversion, $/t | Cash cost, $/t DAP | Margin vs $830/t guidance | |
|---|---|---|---|---|---|
| $310/lt (Q4 2025) | 124 | 412 | 536 | +294 | ██████████ |
| $705/lt (rollover) | 281 | 412 | 693 | +137 | █████░░░░░ |
| $910/lt (half the spot gap) | 363 | 412 | 775 | +55 | ██░░░░░░░░ |
| ~$1,118/lt (spot parity) | 446 | 412 | 858 | −28 | below zero |
Source: Crop Root Zone estimate from Mosaic Q2 2026 release (Aug 4, 2026) and Q2 2026 earnings call (ammonia guidance, conversion cost, rock cost, DAP price guidance); rock-to-DAP and acid ratios are engineering assumptions. Excludes depreciation, SG&A, freight and the steam credit from sulfur burning. Margin bars are scaled to the $310 case. $/metric tonne.
On those inputs, cash cost meets the guided DAP price at a Tampa contract of roughly $1,050/lt ($1,020–1,070 across the $820–840 guidance range). Above that level, every incremental tonne of DAP loses cash before overhead. Mosaic has already shown what it does when margins thin: Faustina is idle, Bartow is at 40% of target, and New Wales and Riverview are in the low-to-mid 70s percent (Q2 2026 earnings call). The company's government-affairs lead put sulfur at about 40% of its production costs in September (Brownfield, Sep 14, 2026).
Ground Truth: The Q4 contract is unlikely to close the full gap to July spot. The reason is not that refiners lack leverage. It is that the buyer has a credible walk-away price, and it sits below spot parity. A phosphate producer that can idle a plant, and has done so, will not contract molten sulfur above the level at which its DAP loses cash. Spot has also moved toward the contract since July: Middle East fob at $855/t is about $869/lt. On our read the realistic range is a rollover to the mid-$800s, roughly $705 to $870/lt. That means a spring 2027 sulfur cost of about $0 to $6.50 an acre above this fall's on a 100 lb P2O5 program. A settlement above $900 would be a signal in its own right. It would mean the buyer is paying for security of supply over margin, and more curtailment would be the likely next move rather than higher spring prices. A settlement below $705 would be the first evidence that the July spike has broken at the contract level.
What would break that read, in order of weight:
- A real Hormuz reopening. Iran signaled on September 22 that passage could be restored within a week if US pressure eased (The National, Sep 22, 2026). Sulfur is a byproduct already being produced and stockpiled behind the strait. If transit resumes, spot can fall faster than any contract cycle.
- Middle East producers' October prices. Due around month-end and not yet in public summaries. They are the cleanest outside reference for where refiners will anchor.
- Mosaic's third-quarter results. These will show the first realized sulfur cost at or near $705 and any change to operating rates. A restart announcement would mean the producer expects the Q4 contract to stay below its breakeven.
When the Q4 settlement prints, find it in the scenario columns of sections 3 and 4. The per-ton and per-acre consequences are already worked out there.
References
- Green Markets (Bloomberg), "Sulfur Posts," public listing: "The Tampa molten sulfur contract remained at $705/lt CFR," Sep 25, 2026. https://fertilizerpricing.com/sulfur-posts/
- Green Markets (Bloomberg), "Sulfur," public excerpt: first-quarter Tampa molten contracts valued at $495.69/lt CFR, Mar 6, 2026. https://fertilizerpricing.com/sulfur-515/
- Argus Media, Argus Sulphur weekly report, Tampa 4Q 2025 liquid sulphur contract up $58/lt to $310/lt, Oct 2, 2025 (public copy cited via search index; host unreachable at time of writing).
- Argus Media, "Viewpoint: Sulfur costs to support amsul prices in 2026," Dec 30, 2025. https://www.argusmedia.com/en/news-and-insights/latest-market-news/2770651-viewpoint-sulfur-costs-to-support-amsul-prices-in-2026
- Argus Media, "Tampa 3Q liquid sulphur price hits record $705/lt," Jul 13, 2026 (includes Jul 9 US Gulf export spot assessment). https://www.argusmedia.com/en/news-and-insights/latest-market-news/2851577-tampa-3q-liquid-sulphur-price-hits-record-705-lt
- Global Agriculture, "Sulphur Prices Ease, but Hormuz Keeps Supply Tight," Sep 24, 2026. https://www.global-agriculture.com/global-agriculture/sulphur-prices-ease-but-hormuz-keeps-supply-tight/
- Trading Economics, "Sulfur — Price, Chart, Historical Data," accessed Oct 1, 2026. https://tradingeconomics.com/commodity/sulfur
- The National, "Oil falls below $100 on Hormuz reopening hopes and Saudi pipeline restarting," Sep 22, 2026. https://www.thenationalnews.com/business/energy/2026/09/22/oil-falls-below-100-on-hormuz-reopening-hopes-and-saudi-pipeline-restarting/
- The Mosaic Company, "The Mosaic Company Reports Second Quarter 2026 Results," Form 8-K Exhibit 99.1, Aug 4, 2026. https://www.sec.gov/Archives/edgar/data/0001285785/000128578526000109/pressreleaseq22026-ex991.htm
- The Mosaic Company, first quarter 2026 results, Form 8-K Exhibit 99.1, May 2026. https://www.sec.gov/Archives/edgar/data/0001285785/000128578526000063/pressreleaseq12026-ex991.htm
- Investing.com (GuruFocus), "The Mosaic Co (MOS) Q2 2026 Earnings Call Highlights: Navigating Sulfur-Driven Curtailments," Aug 2026. https://ca.investing.com/news/company-news/the-mosaic-co-mos-q2-2026-earnings-call-highlights-navigating-sulfurdriven-curtailments--4779532
- Brownfield Ag News, "Tight global sulfur supplies continue to drive fertilizer prices," Sep 14, 2026. https://www.brownfieldagnews.com/news/tight-global-sulfur-supplies-continue-to-drive-fertilizer-prices/
- DTN/Progressive Farmer, "Anhydrous Leads Fertilizer Prices Higher, Up 25% From a Year Ago," Sep 30, 2026 (prices for week of Sep 21–25, 2026). https://www.dtnpf.com/agriculture/web/ag/crops/article/2026/09/30/anhydrous-leads-fertilizer-prices-25
- USDA AMS, Oklahoma Production Cost Report (Bi-Weekly), week ending Sep 18, 2026. https://www.ams.usda.gov/mnreports/ams_3621.pdf
- USDA AMS, Pacific Northwest Production Cost Report (Bi-Weekly), week ending Sep 18, 2026. https://www.ams.usda.gov/mnreports/ams_3657.pdf
Disclosures
Crop Root Zone is an independent publication. Nothing here is investment advice. Market calls, where included, reflect the editors' own read and are not a recommendation to buy or sell any security.
India's Phosphate Subsidy Rates Expire Today With No Rabi Rates Published. Kharif Alone Used 77% of the Year's ₹54,000 Crore Budget Line.
India has published no rabi 2026-27 subsidy rates, and Kharif already used 77% of the year's ₹54,000 crore line. With 22.83 lakh tonnes of DAP against a 55.07 lakh tonne need, a quiet October means a delayed decision, not lower demand.
India's Kharif 2026 Nutrient Based Subsidy (NBS) rates for phosphate and potash fertilizers expire at midnight tonight. As of September 30, the government had not published the rates for rabi 2026-27, the October-to-March season that begins tomorrow. The rabi season carries the wheat and mustard crop and India's peak DAP demand. The absence of rates is not unusual. Last year's rabi package was approved on October 28, four weeks into the season. It matters this year because of where India stands on three counts. The fiscal year's budget line is mostly committed to Kharif. The DAP stock cushion is less than half the season's requirement. And the world DAP price is about $900 a tonne CFR India, far above the level at which the current subsidy covers an importer's costs. A previous piece in this publication worked through the per-tonne subsidy gap. This one looks at the budget, the import volume India still needs, and when that volume is likely to reach the market, because those three things determine when the Indian bid returns to world DAP.
1. What is announced, and what is not
What's new: Three things are on the record. The Kharif 2026 rates were N ₹47.32/kg, P ₹52.76/kg, K ₹2.38/kg and S ₹3.16/kg, with a tentative budgetary requirement of ₹41,533.81 crore for April 1 to September 30 (PW, May 21, 2026; Cabinet approval April 8, 2026). The special DAP incentive of ₹3,500/t runs to the end of Kharif, and the DAP retail price stays at ₹1,350 per 50 kg bag (Rural Voice, Sep 14, 2026). At its national rabi conference on September 28–29 the government put rabi 2026-27 fertilizer demand at 350 lakh tonnes, including 55.07 lakh tonnes of DAP. It also reported a DAP stock of 22.83 lakh tonnes on September 18 (Whalesbook, citing government data, Sep 27, 2026). States had estimated their total requirement at 380 lakh tonnes (Madhyamam, Sep 29, 2026).
Four things are not on the record: the rabi NBS rates themselves, whether the ₹3,500 incentive continues, whether the price-linked top-up used last rabi will be repeated, and the details of a proposed "differential" NBS. The trade reported on September 23 that the proposal would pay more for DAP made from raw materials processed in India than for imported finished DAP. No rate or date has been published for it (Whalesbook, Sep 23, 2026).
Evidence: The approval dates for the last four packages show that a late package is normal and that timing varies by weeks.
| Season | Season starts | Cabinet approval | Days from season start | Package, ₹ crore |
|---|---|---|---|---|
| Rabi 2024-25 | Oct 1, 2024 | Sep 18, 2024 | −13 | 24,475.53 |
| Kharif 2025 | Apr 1, 2025 | Mar 28, 2025 | −4 | 37,216.15 |
| Rabi 2025-26 | Oct 1, 2025 | Oct 28, 2025 | +27 | 37,952.29 |
| Kharif 2026 | Apr 1, 2026 | Apr 8, 2026 | +7 | 41,533.81 |
| Rabi 2026-27 | Oct 1, 2026 | Not announced as of Sep 30 | — | — |
Sources: The Week / PTI, Sep 18, 2024; Chronicle India, Mar 28, 2025; Business Standard, Oct 28, 2025 and Rural Voice, Oct 2025; ETV Bharat, Apr 8, 2026 and PW, May 21, 2026. Negative days mean approval before the season began. Package figures are the Cabinet's "tentative budgetary requirement," not cash outlays.
The NBS rate is also not the only support. For rabi 2025-26 the government paid importers and producers ₹3,500/t for handling, bagging and distribution. On top of the NBS, it also compensated them for gains or losses from moves in world prices during the season (Argus Media, Jan 15, 2026). An April 2025 Department of Fertilizers proposal of the same kind was worth about $81–82/t on a mid-$670s cargo (Argus Media, Apr 10, 2025). The headline NBS rate therefore understates what an importer actually receives.
Ground Truth: Anyone reading the rabi announcement for a signal on world DAP should look past the headline P rate. The terms that affect import volume are whether the price-linked compensation continues and whether a differential subsidy starts favoring locally processed DAP. The first keeps India buying finished DAP at world prices. The second would, over time, move Indian demand from finished DAP toward phosphoric acid, rock, sulfur and ammonia. That would reduce the tonnage India bids for on the DAP market and increase its bids for DAP raw materials.
2. The budget line is 77% committed on paper, and that has not stopped India before
What's new: The Union Budget for 2026-27 allotted ₹54,000 crore to the NBS scheme, 10% below the ₹60,000 crore budget estimate for 2025-26. Imported-urea support was set at ₹32,000 crore and indigenous urea at ₹91,000 crore, for a department total of about ₹1.71 lakh crore (Fertiliser India, Feb 9, 2026). The Kharif package alone is 77% of the NBS line.
Evidence:
| NBS arithmetic, FY2026-27 | ₹ crore | |
|---|---|---|
| FY2025-26 packages, Kharif 2025 + Rabi 2025-26 | 75,168 | ██████████ |
| FY2025-26 NBS budget estimate | 60,000 | ████████░░ |
| FY2026-27 NBS budget estimate | 54,000 | ███████░░░ |
| Kharif 2026 package | 41,534 | ██████░░░░ |
| Rabi 2025-26 package, for scale | 37,952 | █████░░░░░ |
| Left in the FY2026-27 line after Kharif | 12,466 | ██░░░░░░░░ |
Sources: Fertiliser India, Feb 9, 2026 (budget estimates); Cabinet package figures as in the table above. Differences and totals are our arithmetic. Bars scale to ten blocks at ₹75,168 crore.
77%
The share of India's full-year ₹54,000 crore phosphate-and-potash subsidy line already committed by the Kharif 2026 package, before any rabi rate is set. (Our arithmetic on Fertiliser India, Feb 9, 2026, and PW, May 21, 2026)
On paper, the ₹12,466 crore left would pay the Kharif-rate DAP subsidy plus incentive (₹36,287/t) on about 34 lakh tonnes of DAP. That would leave nothing for the NPK grades, MOP and SSP that the same scheme also funds. A rabi package the size of last year's would take the fiscal year to about ₹79,486 crore, 47% above the line.
That is unlikely to be what stops India. Last fiscal year's two packages totaled ₹75,168 crore against a ₹60,000 crore line, 25% over. The fertilizer subsidy as a whole was then topped up in Parliament: by about ₹18,525 crore in the first supplementary batch in December 2025, and by about ₹19,000 crore more in March 2026 (News On AIR, Dec 15, 2025; Social News XYZ / IANS, Mar 13, 2026). Package figures are tentative estimates and do not match cash paid in the same year, so they do not reconcile exactly with revised estimates. The direction is still clear. In May a Joint Secretary at the Department of Fertilizers said the total subsidy bill could exceed ₹3 lakh crore this year if the West Asia disruption continued (Daily Pioneer, May 27, 2026), against the ₹1.71 lakh crore budgeted.
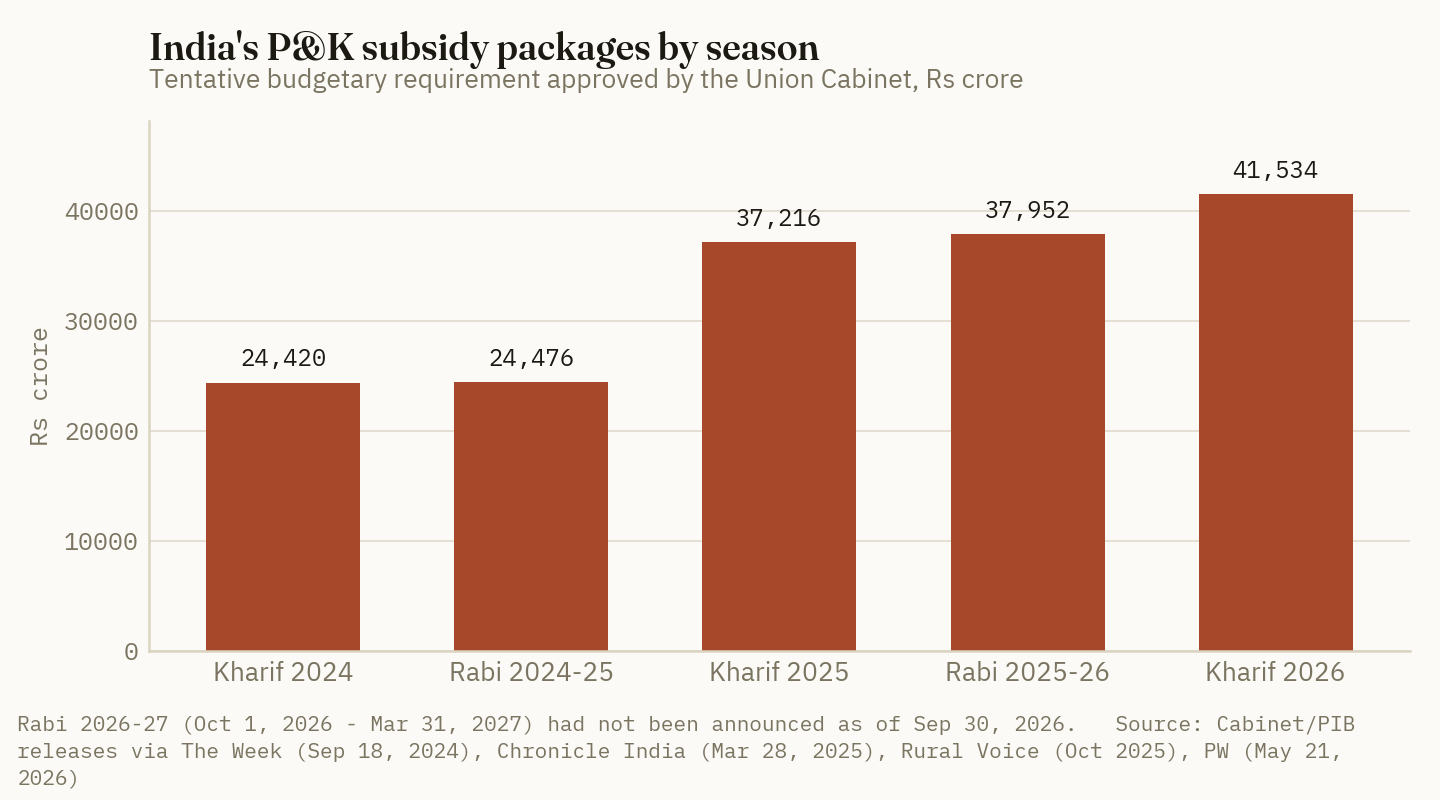
Ground Truth: The ₹54,000 crore line tells us how the rabi decision will be paid for, not whether it will be made. New Delhi has topped up the fertilizer bill in each of the last two sessions and has kept the ₹1,350 bag price for four years. It will pay for rabi. What the budget line affects is timing. A package that clearly needs a supplementary grant is more likely to arrive late and to be split into a base rate plus a separate top-up. Last October it arrived 27 days late. Importers do not commit cargoes until they know their recovery.
3. The volume India still has to buy
What's new: India rebuilt DAP stocks from 16.52 lakh tonnes on July 27 (LatestLY / ANI, Jul 31, 2026) to 22.83 lakh tonnes on September 18 (Whalesbook, Sep 27, 2026), a gain of 6.31 lakh tonnes in seven weeks while Kharif sales were still going on. Imports remain well below last year's pace. DAP imports were 1.90 million tonnes in January–July 2026, down 23% year on year, and September arrivals were running "substantially below" the prior year with buyers delaying purchases (Australian Fertilizer Corporation, w/e Sep 18, 2026). The cooperative KRIBHCO said on September 25 that it had lined up 3–4 lakh tonnes of DAP and NPK imports for rabi, with DAP at about $900/t (PSU Watch, Sep 25, 2026).
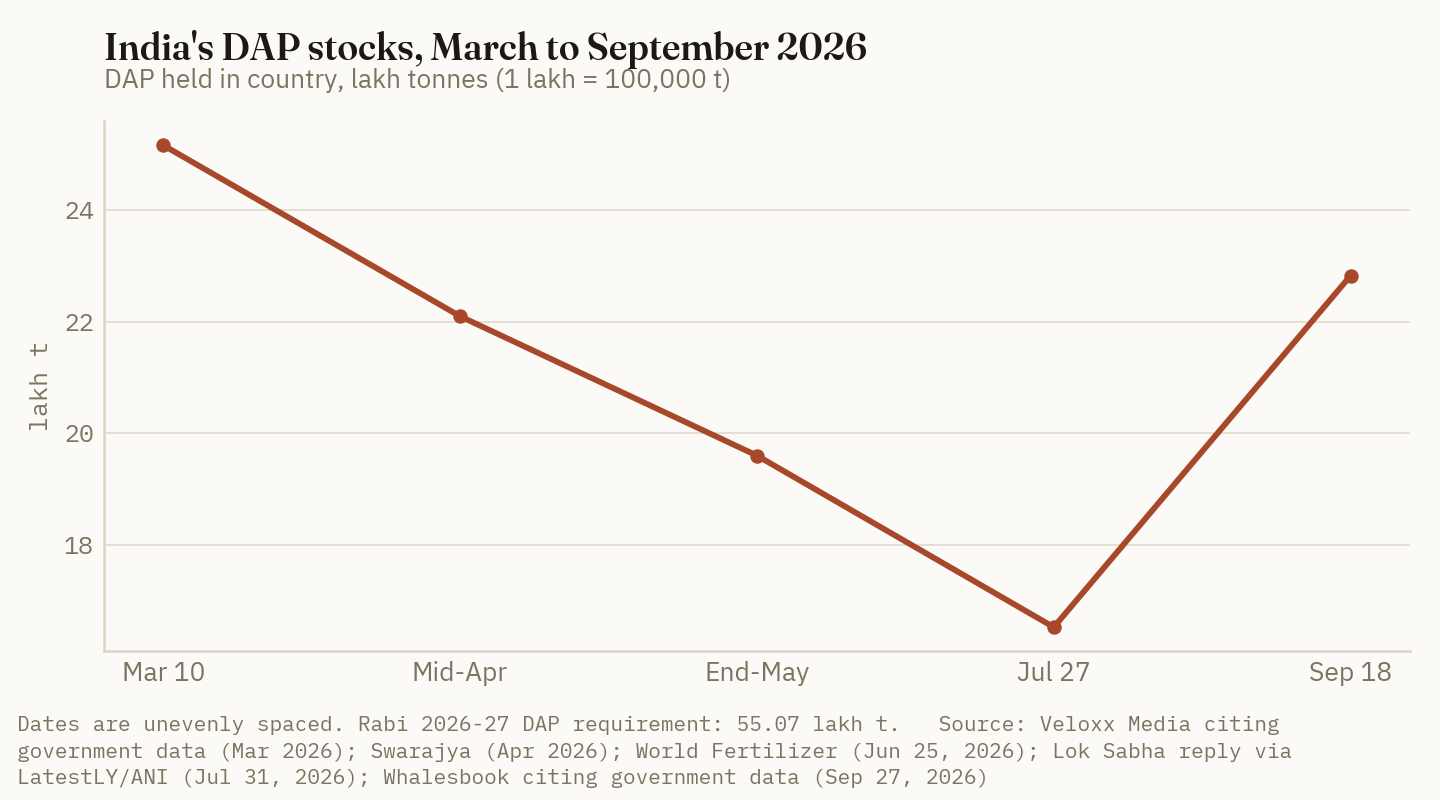
Evidence: An estimate of rabi import needs, using the government's own requirement and stock figures and a domestic production rate carried forward from the first quarter:
| India rabi 2026-27 DAP balance | Low case, lakh t | High case, lakh t | Basis |
|---|---|---|---|
| Requirement / target availability | 55.07 | 75.40 | Low: government rabi requirement. High: last rabi's actual availability |
| Less: stock, Sep 18 | 22.83 | 22.83 | Government data |
| Less: domestic output, Oct–Mar* | 19.68 | 19.68 | Q1 FY27 rate of 9.84 per quarter, carried forward |
| Imports needed, Oct–Mar* | 12.56 | 32.89 | Estimate |
| Per month* | 2.09 | 5.48 | |
| For scale: Jan–Jul 2026 actual, per month | 2.71 | 2.71 | 1.90 million t over seven months |
| For scale: FY2025-26 actual, per month | 5.16 | 5.16 | 61.94 lakh t over twelve months |
Sources: Whalesbook, citing government data, Sep 27, 2026 (requirement, stock); PIB, rabi 2025-26 availability statement (75.40 lakh t availability against 53.43 requirement); Free Press Journal, citing the Fertiliser Ministry, Jul 2026 (Q1 output 9.84 lakh t, FY26 imports 61.94 lakh t); Australian Fertilizer Corporation, w/e Sep 18, 2026 (Jan–Jul imports). *Crop Root Zone estimates. The low case assumes India ends March with no stock, which it will not choose to do. Requirements have historically been set above actual sales. Domestic output could fall if phosphoric acid and sulfur costs curb local production.
The low case already needs a monthly import pace close to this year's. The high case, which simply repeats last rabi's availability, needs double this year's pace, about what India imported through fiscal 2025-26. Somewhere in that range, India has 12 to 33 lakh tonnes, or 1.3 to 3.3 million tonnes, to buy between now and March. The world DAP market has spent 2026 without India's full volume. Brazil's phosphate imports were down 22% for January–August (Australian Fertilizer Corporation, w/e Sep 11, 2026), and Chinese exports were suspended from March 14 to August 31.
The rupee has moved against India. At ₹96.05 on September 29 (Whalesbook, Sep 29, 2026), the Kharif NBS plus incentive plus retail price recovers ₹63,287/t, or about $659/t. At $900 CFR the shortfall is about ₹23,158/t before port and inland costs. Covering that shortfall on the whole estimated import need would cost about ₹2,909 crore in the low case and ₹7,617 crore in the high case (our arithmetic). Either figure is smaller than one of last year's supplementary top-ups.
Ground Truth: Closing the full DAP import gap at today's prices costs India less than a single supplementary grant. That is why we do not expect New Delhi to ration DAP by withholding subsidy. The binding constraint is shipping time. A cargo booked in the first week of November arrives for the tail of wheat sowing, not its start. Last year's late package was followed by DAP shortages in Punjab at sowing: 3.50 lakh tonnes on hand against a 5.50 lakh tonne requirement on October 25, 2025 (The Tribune, Oct 2025). India's total fertilizer stock is larger than a year ago, 163 lakh tonnes against 122 (Madhyamam, Sep 29, 2026), but a similar delay would compress India's rabi buying into November–January.
4. Urea: the cheap nutrient that funds the expensive one
What's new: India's nitrogen position has moved the other way. Urea stocks were 64.91 lakh tonnes on September 18 against a rabi urea requirement of 199.27 lakh tonnes (Whalesbook, Sep 27, 2026). The early-September import tender by Rashtriya Chemicals and Fertilizers sought up to 1.7 million tonnes for shipment by September 24. It cleared at $390.25/t CFR east coast and $393.65/t west coast, with about 1.2 million tonnes expected from China. That is 58% below the $935–959/t India paid in its April emergency purchases (Fertilizer Daily, Sep 7, 2026). The budget had already assumed cheaper imported urea: ₹32,000 crore for FY2026-27, down 38% from the ₹51,972 crore FY2025-26 estimate (Fertiliser India, Feb 9, 2026).
Evidence: On our arithmetic, the drop from $935 to $390.25 is worth about ₹52,323 a tonne at the current rupee. On the roughly 1.2 million tonnes China is expected to supply, the saving against April prices is about ₹6,279 crore. That is about half of the ₹12,466 crore left in the NBS line. It is a counterfactual, since India would not have bought the same volume at April's price. It still shows the scale. The budget votes fertilizer subsidy to one department, not as separate urea and P&K accounts, so every rupee saved on a nitrogen tender helps offset the phosphate overrun.
Ground Truth: A falling urea price makes a generous rabi phosphate package more likely, not less, because the government is managing one fertilizer bill. For a US reader, that means the nitrogen and phosphate markets have diverged partly because of Indian policy. India can afford to stay a firm buyer of DAP because it is now paying under $400 for urea.
5. What it means for the US DAP and MAP bill
What's new: US phosphate prices have held while India has been out of the market. DTN's retail survey for September 14–18 put DAP at $925/st and MAP at $967/st, up 0.9% and 0.8% on the month and 2% and 5% on the year (DTN/Progressive Farmer, Sep 23, 2026). The NOLA DAP benchmark tracked by Trading Economics was $802.50 on September 29, unchanged since September 18 and up 6.3% on the year (Trading Economics, Sep 29, 2026). India's CFR range was $895–915/t in the week ended September 18, and NOLA DAP and MAP were described as firming to multi-month highs (Australian Fertilizer Corporation, w/e Sep 18, 2026).
Evidence:
| Benchmark | Basis | Level | As of |
|---|---|---|---|
| DAP, India | CFR, $/mt | 895–915 | w/e Sep 18, 2026 |
| DAP, India, cooperative reference | CFR, $/mt | ~900 | Sep 25, 2026 |
| DAP, World Bank series | f.o.b. US Gulf, $/mt, monthly avg | 793.5 | Aug 2026 |
| DAP, NOLA benchmark | $/st | 802.50 | Sep 29, 2026 |
| DAP, US retail | Delivered farm, $/st | 925 | Sep 14–18, 2026 |
| MAP, US retail | Delivered farm, $/st | 967 | Sep 14–18, 2026 |
| Retail DAP minus NOLA | $/st | 122.50 | Our arithmetic |
Sources: Australian Fertilizer Corporation, w/e Sep 18, 2026; PSU Watch, Sep 25, 2026; World Bank Pink Sheet, Sep 2, 2026; Trading Economics, Sep 29, 2026; DTN/Progressive Farmer, Sep 23, 2026. The World Bank and NOLA series are different assessments and are not comparable level for level.
For a grower, the pass-through is simple arithmetic. A $100/mt move in world DAP equals $90.72/st. At a 150 lb/acre DAP rate, that is $6.80 an acre. At today's retail price the same 150 lb costs $69.38 an acre in DAP or $72.53 in MAP.
| Retail DAP, $/st | Cost of 150 lb/acre, $ | Change vs today, $/acre | |
|---|---|---|---|
| 1,016 (today + $100/mt world) | 76.20 | +6.82 | ██████████ |
| 925 (Sep 14–18 survey) | 69.38 | 0.00 | █████████░ |
| 834 (today − $100/mt world) | 62.55 | −6.83 | ████████░░ |
Source: DTN/Progressive Farmer, Sep 23, 2026 for the base price; scenario rows are our arithmetic, rounded to the nearest dollar per ton, assuming full pass-through of a world move to retail, which history suggests happens slowly and incompletely. Bars scale to ten blocks at $76.20.
The Indian calendar decides when those moves are likely. In October, with no rabi rates, Indian importers will keep buying only what they must. That can make world DAP look soft, with thin Indian trade, a few distressed offers and quiet tender news. Once rates are set, India has 1.3–3.3 million tonnes to buy on our estimate, mostly by January. That window overlaps with the period when US retailers and co-ops book their spring 2027 phosphate and when Brazil returns for its own season.
Ground Truth: Fall-applied phosphate is priced and in the ground, and this does not change it. The decision it affects is the spring 2027 DAP/MAP booking. Any October softness in the world price is likely to come from India delaying its purchases, not from a fall in demand. India has not stopped needing DAP; it has not yet set the rate at which it will pay for it. A US buyer who treats an October dip as the start of a downtrend is betting that the rabi package is small and late. Our read of the budget and stock figures is the opposite: likely late, but not small, and followed by concentrated Indian buying in November–January that supports NOLA into spring. The event that would change this is a differential subsidy that moves Indian demand from finished DAP to raw materials. That is worth watching in the rabi notification when it is published.
References
- PW (Physics Wallah), Nutrient Based Subsidy (NBS) 2026: Kharif Subsidy Rates, DAP Price & Budget, May 21, 2026 (N ₹47.32, P ₹52.76, K ₹2.38, S ₹3.16 per kg; ₹41,533.81 crore). https://www.pw.live/upsc/exams/nutrient-based-subsidy-nbs-2026
- ETV Bharat (Hindi), Union Cabinet approves ₹41,534 crore fertilizer subsidy for Kharif 2026, Apr 8, 2026. https://www.etvbharat.com/hi/bharat/union-cabinet-approves-rs-41534-crore-fertilizer-subsidy-to-shield-farmers-this-kharif-hindi-news-hin26040806286
- Prime Minister's Office, Cabinet approves Nutrient Based Subsidy (NBS) rates for Kharif Season, 2026 (from 01.04.2026 to 30.09.2026) on P&K fertilizers, Apr 2026. https://www.pmindia.gov.in/en/news_updates/cabinet-approves-nutrient-based-subsidy-nbs-rates-for-kharif-season-2026-from-01-04-2026-to-30-09-2026-on-phosphatic-and-potassic-pk-fertilizers/
- Rural Voice, Global Sulfur Shortage Keeps DAP Prices High; Government Subsidy Decision Awaited, Sep 14, 2026. https://eng.ruralvoice.in/national/global-sulfur-shortage-keeps-dap-prices-high-government-subsidy-decision-awaited.html
- Whalesbook, India Pegs Rabi Fertilizer Demand at 350 Lakh Tonnes, Sep 27, 2026 (rabi requirement by product; stocks as of Sep 18). https://www.whalesbook.com/news/English/agriculture/India-Pegs-Rabi-Fertilizer-Demand-at-350-Lakh-Tonnes/6ab921375aacb956d081d291
- Whalesbook, India Plans New Subsidy Model to Boost Domestic DAP Output, Sep 23, 2026. https://www.whalesbook.com/news/English/agriculture/India-Plans-New-Subsidy-Model-to-Boost-Domestic-DAP-Output/6ab2d07d5aacb956d07d3f10
- Madhyamam, Centre sets lower foodgrain production target for 2026-27 amid El Niño, Sep 29, 2026 (states' 380 lakh t estimate; opening stock 163 lakh t vs 122). https://madhyamamonline.com/india/centre-sets-lower-foodgrain-production-target-for-2026-27-amid-el-nio-1559008
- The Week / PTI, Cabinet approves Rs 24,475 cr subsidy on P&K fertilisers for rabi season, Sep 18, 2024. https://www.theweek.in/wire-updates/business/2024/09/18/del50-cab-fertiliser-subsidy.html
- Chronicle India, Cabinet approves Nutrient Based Subsidy (NBS) rates for Kharif 2025, Mar 28, 2025 (₹37,216.15 crore). https://www.chronicleindia.in/current-affairs/13746-cabinet-approves-nutrient-based-subsidy-nbs-rates-for-kharif-2025
- Business Standard, Centre hikes non-urea fertiliser subsidy for rabi 2025, Oct 28, 2025. https://www.business-standard.com/industry/agriculture/centre-hikes-non-urea-fertiliser-subsidy-rabi-2025-dap-phosphorus-sulphur-125102801100_1.html
- Rural Voice, Government Approves ₹37,952 Crore Fertiliser Subsidy for Rabi 2025-26, Oct 2025. https://eng.ruralvoice.in/national/government-approves-rs-37952-crore-fertiliser-subsidy-for-rabi-2025-26-to-ensure-affordable-prices-for-farmers.html
- AffairsCloud, GoI Approves Nutrient-Based Subsidy Rates for Rabi 2025–26 Season (N ₹43.02, P ₹47.96, K ₹2.38, S ₹2.87 per kg; DAP ₹29,805/t). https://affairscloud.com/goi-approves-nutrient-based-subsidy-rates-for-rabi-2025-26-season/
- Argus Media, Indian DAP importers, producers rely on support in rabi, Jan 15, 2026. https://www.argusmedia.com/en/news-and-insights/latest-market-news/2776164-indian-dap-importers-producers-rely-on-support-in-rabi
- Argus Media, India's DOF proposes additional phosphate subsidies, Apr 10, 2025. https://www.argusmedia.com/en/news-and-insights/latest-market-news/2676989-india-s-dof-proposes-additional-phosphate-subsidies
- Fertiliser India, India's Fertiliser Subsidy Budget for FY'2026-27: Fertiliser Allocation Falls 8%, Feb 9, 2026. https://fertiliserindia.com/indias-fertiliser-subsidy-budget-for-fy2026-27/
- News On AIR, Lok Sabha approves Supplementary Demands for Grants worth ₹1.32 lakh crore, Dec 15, 2025. https://www.newsonair.gov.in/lok-sabha-approves-supplementary-demands-for-grants-worth-%e2%82%b91-32-lakh-crore/
- Social News XYZ / IANS, Centre ups outlay for fertiliser subsidy by Rs 19,000 crore to boost farm output, Mar 13, 2026. https://www.socialnews.xyz/2026/03/13/centre-ups-outlay-for-fertiliser-subsidy-by-rs-19000-crore-to-boost-farm-output
- The Daily Pioneer, Fertiliser subsidy to cross Rs 3 lakh cr in FY27: Govt, May 27, 2026. https://dailypioneer.com/news/fertiliser-subsidy-to-cross-rs-3-lakh-cr-in-fy27-govt
- LatestLY / ANI, Fertilizer Availability Adequate During Kharif 2026, Centre Tells Parliament, Jul 31, 2026 (DAP stock 16.52 lakh t as of Jul 27). https://www.latestly.com/agency-news/business-news-fertilizer-availability-adequate-during-kharif-2026-centre-tells-parliament-7540066.html
- Veloxx Media, Government Declares Fertiliser Stocks at Decade-High Levels, Mar 2026 (DAP 25.17 lakh t as of Mar 10). https://veloxxmedia.com/government-declares-fertiliser-stocks-at-decade-high-levels-securing-rabi-and-kharif-crop-seasons/
- Swarajya, Government Rejects Fertiliser Shortage Claims Ahead Of Kharif 2026, Apr 2026 (DAP 22.10 lakh t). https://swarajyamag.com/economy/government-rejects-fertiliser-shortage-claims-ahead-of-kharif-2026-46-per-cent-requirement-already-available-as-opening-stock
- World Fertilizer, Indian DAP stocks improve but future remains uncertain, Jun 25, 2026 (DAP 19.60 lakh t end-May). https://www.worldfertilizer.com/phosphates/25062026/indian-dap-stocks-improve-but-future-remains-uncertain/
- Free Press Journal, India Boosts Fertiliser Supply With Urea, DAP Imports Amid Global Disruptions, Jul 2026 (FY26 DAP imports 61.94 lakh t; Q1 FY27 DAP output 9.84 lakh t). https://www.freepressjournal.in/amp/business/india-boosts-fertiliser-supply-with-urea-dap-imports-amid-global-disruptions
- PIB, India Secures 86 Lakh Tonnes of Fertilizers via Global Pacts (rabi 2025-26 DAP availability 75.40 lakh t vs requirement 53.43 lakh t). https://www.pib.gov.in/PressReleasePage.aspx?PRID=2237491®=3&lang=2
- Australian Fertilizer Corporation, Weekly Update — Global Fertiliser Markets, w/e Sep 11, 2026 and w/e Sep 18, 2026. https://ausfertcorp.com/weekly-update-global-fertiliser-markets-w-e-11-09-2026/ ; https://ausfertcorp.com/weekly-update-global-fertiliser-markets-w-e-18-09-2026/
- PSU Watch, KRIBHCO lines up 3–4 lakh tonnes of fertiliser imports for rabi, Sep 25, 2026. https://psuwatch.com/amp/story/newsupdates/kribhco-lines-up-34-lakh-tonnes-of-fertiliser-imports-for-rabi
- The Tribune, Wheat sowing set to begin today amid DAP shortage, Oct 2025 (Punjab 3.50 lakh t against 5.50 lakh t requirement). https://www.tribuneindia.com/news/punjab/wheat-sowing-set-to-begin-today-amid-dap-shortage/
- Fertilizer Daily, China to ship 1.2 million tonnes of urea to India as prices plunge 58% from April's $935 peak, Sep 7, 2026. https://www.fertilizerdaily.com/20260907-china-urea-india-tender-1-2-million-tonnes-2026/
- Whalesbook, Indian Rupee Drops to 96.05 Against Dollar as Oil Prices Rise, Sep 29, 2026. https://www.whalesbook.com/news/English/economy/Indian-Rupee-Drops-to-9605-Against-Dollar-as-Oil-Prices-Rise/6abb34165aacb956d083d881
- DTN/Progressive Farmer, Fertilizer Prices Rise for Six of Eight Major Fertilizers, Sep 23, 2026 (survey week Sep 14–18). https://www.dtnpf.com/agriculture/web/ag/crops/article/2026/09/23/fertilizer-prices-rise-six-eight
- Trading Economics, Di-ammonium Phosphate, accessed Sep 30, 2026 ($802.50 as of Sep 29). https://tradingeconomics.com/commodity/di-ammonium
- World Bank, Commodities Price Data (The Pink Sheet), Sep 2, 2026 (DAP, f.o.b. US Gulf, August average). https://thedocs.worldbank.org/en/doc/74e8be41ceb20fa0da750cda2f6b9e4e-0050012026/related/CMO-Pink-Sheet-September-2026.pdf
Sources not reached directly: the PIB press notes (access refused), the Department of Fertilizers NBS notification (host unreachable), the Union Budget Notes on Demands for Grants for the Department of Fertilisers (access refused), and Business Standard's Sep 29, 2026 report on rabi inventories (access refused). Figures attributed to those bodies are taken from the public relays cited above.
Disclosures
Crop Root Zone is an independent publication. Nothing here is investment advice. Market calls, where included, reflect the editors' own read and are not a recommendation to buy or sell any security.
The Tampa Ammonia Contract Fell $10 for October. In the Last Two Falls It Rose $30 and $50, and Retail Anhydrous Followed It Up.
Yara and Mosaic cut the October contract to an implied $545 a tonne, the first September-to-October decline in three years. In 2024 and 2025 the contract rose $27 and $100 a short ton between September and November, and retail anhydrous rose $33 and $81 over the same weeks. The supply shock that drove last fall's climb, Nutrien's Trinidad shutdown, is now in the base: Trinidad produced 26% less ammonia in the first quarter, while two new Texas plants add about 2.4 million tonnes of capacity, one of them now being bought by Yara. Without that seasonal wholesale push, waiting from September to November changes a 150-pound anhydrous bill by about $1 to $2.50 an acre unless November settles above $585.
The Tampa ammonia contract for October has come in lower. Yara and Mosaic settled it $10 a tonne below September (Quantum Commodity Intelligence, accessed Sep 29, 2026). September settled at $555 a tonne CFR (Fertilizer Daily, Sep 10, 2026), which puts October at an implied $545. After an $80 cut in September, a $10 move looks small. The direction is what matters. In the two previous falls the October contract rose, by $30 in 2024 and $50 in 2025, and kept rising into November. Retail anhydrous in the Corn Belt followed both times. This year's October number is the first in three falls that does not add to the cost of the ton a retailer puts in the tank ahead of application. It also comes as the Caribbean supply that drove last fall's rise has been partly replaced from Texas. For a grower who has not yet priced fall nitrogen, the question is no longer how much the September cut will pass through. It is whether there is still a seasonal reason to buy before November.
1. October broke a two-year fall pattern
What's new: The October 2026 settlement is $10 lower than September, and $45 lower than October 2025. In the June to September run of verified settlements, every month was above its year-earlier level. October is the first month below it.
Evidence: The table below sets the September-to-December settlements for the last three falls side by side.
| Settlement month | 2024, $/t CFR | 2025, $/t CFR | 2026, $/t CFR |
|---|---|---|---|
| September | 530* | 540 | 555 |
| October | 560 | 590 | 545* |
| November | 560* | 650* | — |
| December | 570 | 650 | — |
| Change, September to October | +30 | +50 | −10 |
| Change, September to November | +30 | +110 | — |
Sources: Quantum Commodity Intelligence, Sep 27, 2024 (Oct 2024, up $30), Nov 27, 2024 (Dec 2024 at $570, up $10), Dec 2025 (Dec 2025 unchanged at $650) and accessed Sep 29, 2026 (Oct 2026, down $10); Profercy, Sep 30, 2025 (Sep and Oct 2025); Fertilizer Daily, Sep 10, 2026 (Sep 2026). *Implied from a reported monthly change rather than reported as a level: Sep 2024 from October's $30 rise to $560, Nov 2024 from December's $10 rise to $570, Nov 2025 from December being unchanged at $650, and Oct 2026 from the $10 cut from $555.
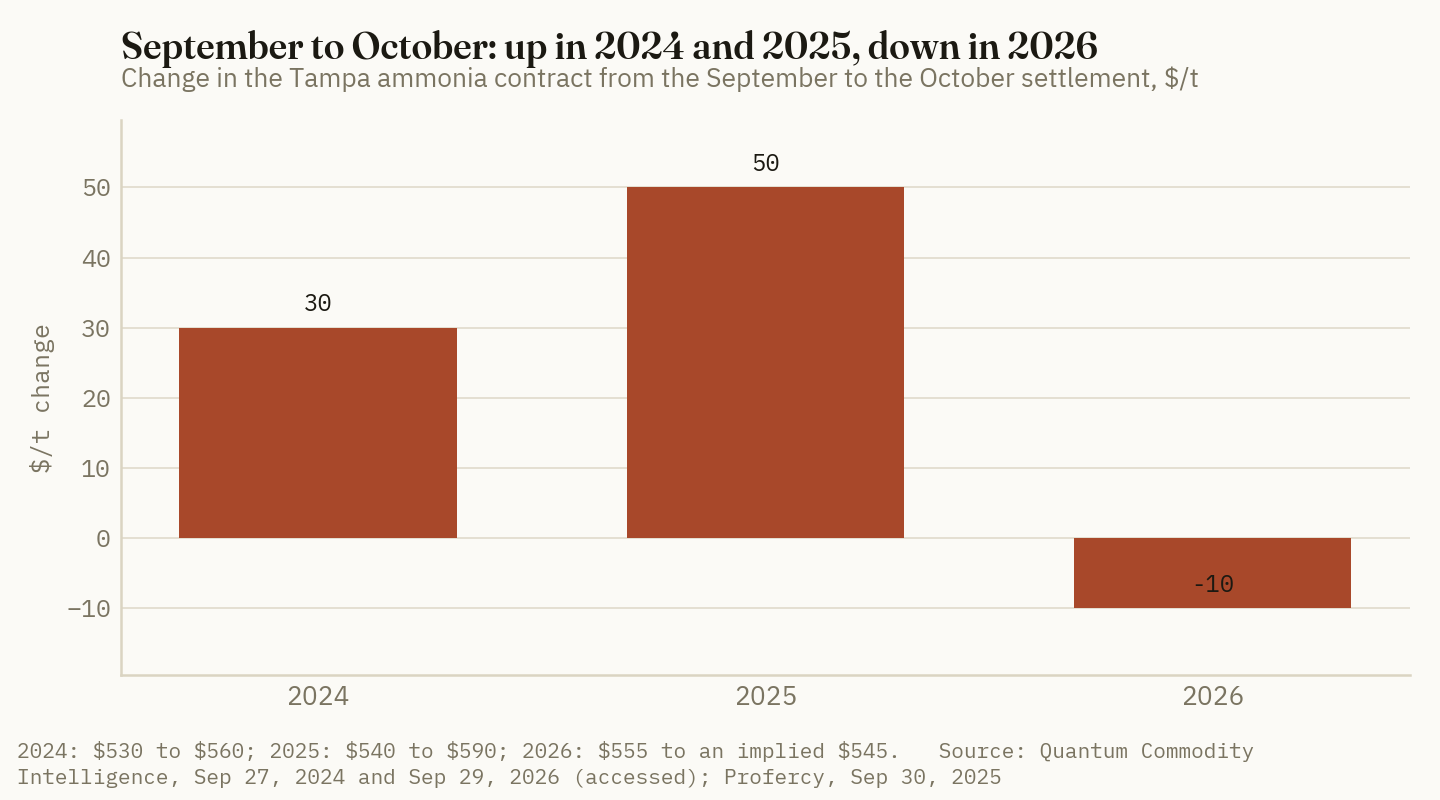
Three years is a short record, and the Tampa contract is a bilateral price between one supplier and one phosphate producer. Since a June 2025 methodology change, the main published CFR Tampa assessment reflects only that negotiated contract (S&P Global Platts, Jun 27, 2025). Much of the anhydrous applied in the Corn Belt is made in the United States and moves inland by pipeline, barge and rail. Tampa is still the number the industry uses to mark North American ammonia, and its fall direction has been a good guide to what the retail survey does next.
The longer view shows how far the contract has already come down. From May's $825 peak it has fallen $280 in five settlements. Fertilizer Daily put the pre-crisis baseline from early 2026 at roughly $480 (Fertilizer Daily, Sep 10, 2026). At $545, October is about 14% above that level, so about four-fifths of the spike has now been reversed.
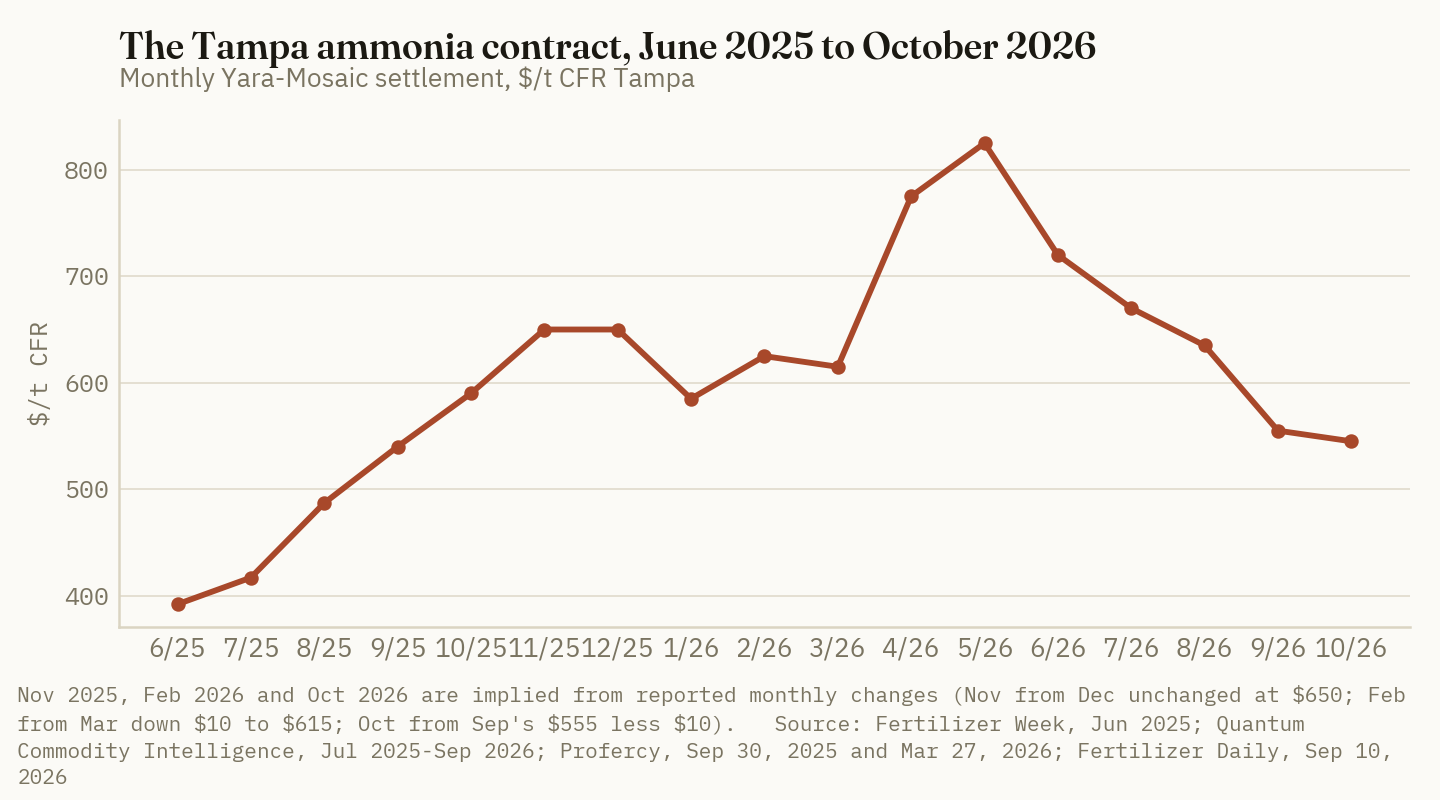
Ground Truth: The $10 cut matters less for its size than for when it happened. In 2024 and 2025 a retailer who refilled in October and November paid more than it had for September tons, and that cost was passed to anyone who booked late. This year the October replacement ton is slightly cheaper than September's. The usual advice to book fall anhydrous before the harvest rush assumed that wholesale would rise into the season. For October, at least, it has not.
2. In both previous falls, retail anhydrous followed the contract up
What's new: DTN's weekly survey shows retail anhydrous rising between mid-September and November in both 2024 and 2025. The size of each rise was close to the rise in the Tampa contract, converted to short tons, over the same stretch.
Evidence:
| Fall | Tampa Sep→Nov, $/short ton | Retail, mid-Sep, $/ton | Retail, Nov, $/ton | Retail change, $/ton | Retail change per $1 of Tampa change |
|---|---|---|---|---|---|
| 2024 | +27* | 685 (Sep 16–20) | 718 (Nov 18–22) | +33 | 1.21 |
| 2025 | +100* | 777 (Sep 15–19) | 858 (Nov 3–7) | +81 | 0.81 |
| 2026 | −9 (Oct only)* | 945 (Sep 14–18) | not yet surveyed | — | — |
Sources: DTN/Progressive Farmer retail surveys, Sep 27, 2024; Nov 27, 2024; Sep 24, 2025; Nov 12, 2025; Sep 23, 2026 (national average, delivered retail). Tampa as in the table above, converted at 1.1023 short tons per tonne. *Includes implied settlements (see Section 1). The November survey weeks differ by year; the ratio column is a Crop Root Zone calculation and rests on two observations only.
| Retail anhydrous rise, mid-Sep to Nov | $/ton | |
|---|---|---|
| 2024 | +33 | ████░░░░░░ |
| 2025 | +81 | ██████████ |
| 2026, so far (Sep 14–18 survey) | — | ░░░░░░░░░░ |
Source: DTN/Progressive Farmer, as above. Bars scale to ten blocks at $81.
The pattern held in years with very different price levels. In 2024 retail anhydrous was $685 and the contract was near $530. In 2025 the retail price was near $780 and the contract rose $110 in two months. Both times, the September price was the cheapest a grower saw that fall.
The relationship has not held on the way down this year. Between the August and September settlements the contract fell $80 a tonne, or about $73 a short ton. Retail anhydrous went from $964 in the Aug 10–14 survey to $945 in the Sep 14–18 survey, a $19 decline (DTN/Progressive Farmer, Aug 19 and Sep 23, 2026). Retail tanks filled on summer contracts explain some of that lag. It also means retail prices have risen with wholesale in recent falls more readily than they have fallen with it.
$81 a ton
The rise in DTN's retail anhydrous average from mid-September to early November 2025, as the Tampa contract climbed $110 a tonne. (DTN/Progressive Farmer, Sep 24 and Nov 12, 2025; Profercy, Sep 30, 2025)
Ground Truth: The fall premium a grower paid in 2024 and 2025 came from wholesale, not from a fixed seasonal markup. Retail rose in step with the contract, by about a dollar for each dollar of contract increase. This fall the contract is moving the other way, so waiting no longer costs what it did. It also does not save much. Retail prices have fallen more slowly than the contract, so a grower who waits is avoiding a rise more than capturing a cut. The case for booking early now depends on the November settlement, not on the calendar.
3. Last fall's climb was a Trinidad story, and that shock is now in the base
What's new: The October 2025 rise was reinforced by a supply loss. Nutrien completed a controlled shutdown of its Trinidad nitrogen operations on Oct 23, 2025, citing port access restrictions and a lack of reliable and economic natural gas (Nutrien, Oct 2025). The plant had been producing about 85,000 tons of ammonia and 55,000 tons of urea a month (U.S. Geological Survey, Feb 2026). Profercy reported that after the announcement one Algerian supplier raised spot offers from $600 to $625 a tonne within a day, and that the western merchant market faced tightness through year-end (Profercy, Oct 2025). The November contract rose to an implied $650. A year on, the plant is still shut. Nutrien's second-quarter report says there has been no production from Trinidad and that it will settle "the optimal path" for the facility in 2026 (Nutrien, Aug 5, 2026).
Evidence: Trinidad and Canada together supplied almost all U.S. ammonia imports from 2021 to 2024, with Trinidad at 47% (U.S. Geological Survey, Feb 2026). First-quarter figures from Trinidad's Ministry of Energy and Energy Industries, relayed by the island's Energy Chamber, show how much of Nutrien's loss the other plants have made up.
| Trinidad and Tobago ammonia | Q1 2025, tonnes | Q1 2026, tonnes | Change |
|---|---|---|---|
| Production, all plants | 1,096,475 | 813,652 | −25.8% |
| Production, excluding Nutrien | 741,397* | 813,652 | +9.7% |
| Exports, all plants | 866,022 | 671,676 | −22.4% |
| Exports, excluding Nutrien | 645,702 | 671,676 | +4.0% |
Source: Energy Chamber of Trinidad and Tobago, Sep 7, 2026, citing Ministry of Energy and Energy Industries data. *Crop Root Zone calculation: total less Nutrien's reported 355,078 tonnes. Percentages are Crop Root Zone calculations.
The remaining producers ran harder. Fertilizer Daily said Trinidad plants were operating at higher rates through August, adding Atlantic Basin supply (Fertilizer Daily, Sep 10, 2026). That was not enough to replace the lost tonnes, and the island's gas base is shrinking. Trinidad's natural gas output averaged 2,427 million cubic feet a day in January to March 2026, about 4.5% below the 2025 average of 2,541 (Rio Times, Sep 6, 2026). Ammonia and methanol plants draw on the same gas pool. On Sep 24, U.S. diplomats were reported to have raised Trinidad's gas negotiations with the island's government, citing its importance for U.S. ammonia and urea supply (Quantum Commodity Intelligence, Sep 24, 2026).
The offset has come from Texas. Gulf Coast Ammonia's 1.2-million-tonne plant at Texas City began ramping up in November 2025, and Woodside's 1.1-million-tonne Beaumont plant was expected online in early 2026 (Argus Media, undated viewpoint published after the December 2025 settlement). Beaumont produced its first ammonia in December 2025, with commercial production expected in early 2026 and deliveries planned for the second half of the year (Ship & Bunker, Dec 29, 2025). On Jul 2, 2026 Yara agreed to buy the Texas City plant for $1.3 billion. It put nameplate capacity at 1.3 million tonnes and said the plant should reach full, stable production by the end of 2026 (Yara, Jul 2, 2026).
| Supply change affecting the U.S. Gulf and Tampa | Annual ammonia, million tonnes | Status, Sep 2026 |
|---|---|---|
| Nutrien Trinidad, lost output | about 1.0–1.2* | Shut since Oct 23, 2025 |
| Gulf Coast Ammonia, Texas City (being acquired by Yara) | 1.2–1.3 capacity | Ramping; full rate targeted by end-2026 |
| Beaumont New Ammonia (Woodside) | 1.1 capacity | First ammonia Dec 2025; deliveries planned H2 2026 |
| Other Trinidad producers, Q1 year on year | about +0.29 annualised* | Running at higher rates |
Sources: U.S. Geological Survey, Feb 2026; Energy Chamber of Trinidad and Tobago, Oct 30, 2025 and Sep 7, 2026; Argus Media; Ship & Bunker, Dec 29, 2025; Yara, Jul 2, 2026. *Crop Root Zone estimates: the low end is 85,000 t a month × 12 (USGS); the high end is 31% of 2024 national output of just over 4 million tonnes (Energy Chamber). The last row annualises the 72,255-tonne first-quarter gain. Capacity is not output, and a plant in ramp-up runs below it.
Ground Truth: Last November's $60 rise was mostly a response to a sudden loss of supply. This November's contract will be compared with a base that already reflects that loss, while new U.S. Gulf capacity roughly equal to Nutrien's lost Trinidad output is coming on. One detail deserves attention. Yara, the seller in the Tampa contract, has agreed to buy one of the Texas plants and says it will run it partly for its own sourcing. The Tampa supplier is becoming a U.S. Gulf producer. Over time that should tie the benchmark more closely to Henry Hub gas and less to Caribbean supply. The EIA expects Henry Hub to average $3.43 per MMBtu in 2026 and $3.28 in 2027 (EIA, Sep 9, 2026).
4. What the November settlement is worth per acre
What's new: The November contract will be settled in about four weeks. It is the last wholesale number that bears directly on tons applied this fall. Using the pass-through observed in 2024 and 2025, about one dollar at retail for each dollar of contract change, a range of November outcomes can be converted into a retail price and a per-acre cost. These are scenarios, not forecasts.
Evidence: The starting point is DTN's Sep 14–18 retail anhydrous average of $945 a ton, or $0.58 a pound of N (DTN/Progressive Farmer, Sep 23, 2026). Each scenario applies the change in the Tampa contract from September's $555, converted to short tons, at a 1:1 pass-through.
| November Tampa scenario | Change from Sep, $/t | Implied retail, $/ton | $/lb N | Change vs today at 150 lb N/acre |
|---|---|---|---|---|
| $525: another $20 cut | −30 | 918* | 0.560* | −$2.49* |
| $545: October rolls over | −10 | 936* | 0.571* | −$0.83* |
| $585: a 2024-sized fall rise | +30 | 972* | 0.593* | +$2.49* |
| $665: a 2025-sized fall rise | +110 | 1,045* | 0.637* | +$9.13* |
Crop Root Zone estimates. Base: DTN/Progressive Farmer, Sep 23, 2026 ($945/ton). Tampa change converted at 1.1023 short tons per tonne and passed through 1:1, the rounded average of the 2024 (1.21) and 2025 (0.81) ratios in Section 2. $/lb N uses 1,640 lb N per ton of 82% anhydrous. 150 lb N/acre is illustrative. The scenarios ignore retail margin, freight and inventory timing, which Section 2 shows do not move symmetrically.
The range is narrow unless the contract rises sharply. A rollover or small cut moves a 150-pound program by less than $2.50 an acre. A 2024-sized rise costs about the same in the other direction. Only a repeat of last fall's $110 climb, which needed a large plant to close without warning, moves the bill by more than $9 an acre. At $945, a 150-pound anhydrous program already costs about $86 an acre in product before application.
Five data points will show which row applies:
- The November Tampa settlement, normally reported in the last days of October. A rollover near $545 confirms that the seasonal rise is absent.
- DTN retail surveys in late October and November. In both prior falls they followed the contract. If retail rises while the contract does not, the increase is retail margin, not wholesale cost.
- Trinidad's gas supply. Any new curtailment at the plants that have made up part of Nutrien's loss would bring back the supply risk that drove last fall's rise. Nutrien's decision on the facility, promised for 2026, cuts both ways.
- Texas City's ramp-up. Yara's end-2026 target for stable operation covers the fall season. Delays would leave the Gulf short of the new supply this analysis assumes.
- Mosaic's ammonia demand. Reduced offtake by the Tampa buyer during its phosphate curtailments helped bring the September contract down (Australian Fertilizer Corporation, weekly update w/e Aug 28, 2026). A restart would firm the contract without any change in the nitrogen market.
Ground Truth: This fall the timing decision carries less risk than usual. With October down and new U.S. Gulf supply coming on, the rows most likely to apply this year are the top two, and the gap between booking today and booking after the November settlement is worth about a dollar or two an acre. That is less than the price difference often found between two neighbouring dealers. A grower who has not priced fall tons can reasonably price half now and wait for the November number on the rest. The exception is an operation that cannot risk a supply problem at application time, because the main upside risk this year is a physical one in Trinidad, and a price cut does not help if the ammonia is not there.
References
- Quantum Commodity Intelligence, "Tampa ammonia falls $10/mt for October," accessed Sep 29, 2026 (headline and summary; full text paywalled) — https://www.qcintel.com/ammonia/article/tampa-ammonia-falls-10-mt-for-october-74032.html
- Fertilizer Daily, Kim Clarksen, "Tampa ammonia price drops to $555/t in September — 4th straight monthly decline from $825 peak," Sep 10, 2026 — https://www.fertilizerdaily.com/20260910-tampa-ammonia-price-555-september-2026-fourth-monthly-decline/
- Quantum Commodity Intelligence, "Tampa ammonia price up $30/mt for October," Sep 27, 2024 — https://www.qcintel.com/ammonia/article/tampa-ammonia-price-up-30-mt-for-october-29903.html
- Quantum Commodity Intelligence, "Tampa ammonia price up $10/mt for December," Nov 27, 2024 — https://www.qcintel.com/ammonia/article/tampa-ammonia-price-up-10-mt-for-december-32641.html
- Profercy, "International ammonia prices maintain upward march on capacity constraints," Sep 30, 2025 — https://www.profercy.com/insights/international-ammonia-prices-maintain-upward-march-on-capacity-constraints
- Quantum Commodity Intelligence, "December Tampa ammonia contract remains at $650/mt CFR," Dec 2025 — https://www.qcintel.com/ammonia/article/december-tampa-ammonia-contract-remains-at-650-mt-cfr-54096.html
- Quantum Commodity Intelligence, "Tampa contract drops to $585/mt CFR for January," Dec 2025 — https://www.qcintel.com/ammonia/article/tampa-contract-drops-to-585-mt-cfr-for-january-55576.html
- Quantum Commodity Intelligence, "Tampa ammonia price settles lower for March," Feb 2026 (March at $615, down $10) — https://www.qcintel.com/ammonia/article/tampa-ammonia-price-settles-lower-for-march-59631.html
- Profercy, "Ammonia prices start to soar as curtailments at key production hubs begin to bite," Mar 27, 2026 — https://www.profercy.com/insights/ammonia-prices-start-to-soar-as-curtailments-at-key-production-hubs-begin-to-bite
- Quantum Commodity Intelligence, "Yara and Mosaic's Tampa ammonia settlement jumps $25/mt for July," Jul 2025 — https://www.qcintel.com/ammonia/article/yara-and-mosaic-s-tampa-ammonia-settlement-jumps-25-mt-for-july-43550.html
- Fertilizer Week (on X), June 2025 Tampa settlement at $392/t CFR, Jun 2025 — https://x.com/FertilizerWeek1/status/1932006554338783728
- S&P Global Commodity Insights, "Platts amends CFR Tampa ammonia assessment specifications June 27," Jun 27, 2025 — https://www.spglobal.com/commodity-insights/en/pricing-benchmarks/our-methodology/subscriber-notes/062725-platts-amends-cfr-tampa-ammonia-assessment-specifications-june-27
- DTN/Progressive Farmer, Russ Quinn, "Fertilizer Prices Rise for Six of Eight Major Fertilizers," Sep 23, 2026 (survey week Sep 14–18, 2026) — https://www.dtnpf.com/agriculture/web/ag/crops/article/2026/09/23/fertilizer-prices-rise-six-eight
- DTN/Progressive Farmer, "5 Fertilizer Prices Slightly Lower Than Last Month; 3 Higher," Aug 19, 2026 (survey week Aug 10–14, 2026) — https://www.dtnpf.com/agriculture/web/ag/crops/article/2026/08/19/5-fertilizer-prices-slightly-lower-3
- DTN/Progressive Farmer, "Potash, 10-34-0, UAN32 Lead Major Fertilizer Prices Lower," Sep 27, 2024 (survey week Sep 16–20, 2024) — https://www.dtnpf.com/agriculture/web/Ag/crops/article/2024/09/27/potash-10-34-0-uan32-lead-major
- DTN/Progressive Farmer, "Once Again, Most Retail Fertilizer Prices Higher," Nov 27, 2024 (survey week Nov 18–22, 2024) — https://www.dtnpf.com/agriculture/web/ag/crops/article/2024/11/27/retail-fertilizer-prices-higher
- DTN/Progressive Farmer, "DAP Continues to Lead Fertilizer Prices Higher," Sep 24, 2025 (survey week Sep 15–19, 2025) — https://www.dtnpf.com/agriculture/web/ag/crops/article/2025/09/24/dap-continues-lead-fertilizer-prices
- DTN/Progressive Farmer, "Anhydrous Again Leads Half of Retail Fertilizer Prices Higher," Nov 12, 2025 (survey week Nov 3–7, 2025) — https://www.dtnpf.com/agriculture/web/ag/crops/article/2025/11/12/anhydrous-leads-half-retail-prices
- Nutrien, "Nutrien Commences a Controlled Shut Down of Its Trinidad Nitrogen Operations," Oct 2025 — https://www.nutrien.com/news/press-releases/nutrien-commences-a-controlled-shut-down-of-its-trinidad-nitrogen-operations-1735
- Nutrien, "Nutrien Reports Second Quarter 2026 Results," Aug 5, 2026 — https://www.nutrien.com/news/press-releases/nutrien-reports-second-quarter-2026-results-1753
- U.S. Geological Survey, Mineral Commodity Summaries 2026, "Nitrogen (Fixed)—Ammonia," Feb 2026 — https://pubs.usgs.gov/periodicals/mcs2026/mcs2026-nitrogen.pdf
- Profercy, "Shutdown of Trinidad's largest producer sends shockwaves through merchant ammonia market," Oct 2025 — https://www.profercy.com/insights/shutdown-of-trinidads-largest-producer-sends-shockwaves-through-merchant-ammonia-market
- Energy Chamber of Trinidad and Tobago, "Higher ammonia output from active plants offsets part of Nutrien shutdown," Sep 7, 2026 — https://energynow.tt/blog/higher-ammonia-output-from-active-plants-offsets-part-ofnbspnutriennbspshutdown
- Energy Chamber of Trinidad and Tobago, "Ammonia production and export in T&T face significant challenges," Oct 30, 2025 — https://energynow.tt/blog/ammonia-production-and-export-in-tampt-face-significant-challenges
- Rio Times, "Trinidad and Tobago economy faces gas output drop in 2026," Sep 6, 2026 — https://www.riotimesonline.com/trinidad-tobago-gas-economy-2026/
- Quantum Commodity Intelligence, "US diplomats raise issue of Trinidad gas supply for ammonia, urea: reports," Sep 24, 2026 (summary; full text paywalled) — https://www.qcintel.com/ammonia/article/us-diplomats-raise-issue-of-trinidad-gas-supply-for-ammonia-urea-reports-73817.html
- Argus Media, "Viewpoint: Expanding US ammonia output weighs on prices," undated (published after the December 2025 Tampa settlement) — https://www.argusmedia.com/en/news-and-insights/latest-market-news/2769268-viewpoint-expanding-us-ammonia-output-weighs-on-prices
- Ship & Bunker, "Woodside's Beaumont Plant Produces First Ammonia," Dec 29, 2025 — https://shipandbunker.com/news/am/231420-woodsides-beaumont-plant-produces-first-ammonia
- Yara International, "Yara acquires Gulf Coast Ammonia plant," Jul 2, 2026 — https://www.yara.com/corporate-releases/yara-acquires-gulf-coast-ammonia-plant/
- U.S. Energy Information Administration, Short-Term Energy Outlook, natural gas, Sep 9, 2026 — https://www.eia.gov/outlooks/steo/report/natgas.php
- Australian Fertilizer Corporation, "Weekly Update, Global Fertiliser Markets, w/e 28.08.2026," Aug 2026 — https://ausfertcorp.com/weekly-update-global-fertiliser-markets-w-e-28-08-2026/
Disclosures
Crop Root Zone is an independent publication. Nothing here is investment advice. Market calls, where included, reflect the editors' own read and are not a recommendation to buy or sell any security.
At $5.00 Corn and $12.00 Soybeans, Illinois' Published Flex-Lease Factors Pay the Landowner $359 an Acre, $38 More Than the $321 Fixed Rent. The Operator Keeps $23 Instead of $61.
On Illinois' 2027 central Illinois budget, a 30%/38% share-of-revenue lease out-pays $321 fixed rent above 89% of budget revenue; a base-plus-bonus lease needs 99%. The operator breaks even at 97% of budget revenue under the percent lease, 94% under fixed rent, 92% under the bonus lease.
The University of Illinois told landowners and tenants on September 15 that the 2027 return outlook "does not justify increases in cash rents" and that further reductions "also seem unlikely" (farmdoc daily, Sep 15, 2026 [1]). Its 2027 budget for high-productivity central Illinois ground carries $321 an acre of cash rent and leaves the operator $61 on a 50-50 corn-soybean rotation at $5.00 corn and $12.00 soybeans (farmdoc daily, Sep 1, 2026 [2]). A flexible lease is the usual answer when neither side wants to move the fixed number. We ran the two standard flex designs through that budget. The university's own published share-of-revenue factors pay the landowner $359 at budget prices, $38 more than fixed rent, and leave the operator $23. A base-plus-bonus design pays $327 and leaves $55. The form of the flex decides who gains, and at 2027 prices the most widely published form is a rent increase.
1. Where rent and returns stand going into renewal
What's new: Three surveys agree that rent is flat to slightly lower, and the 2027 budgets say the operator's margin at that rent is positive but thin.
Evidence: USDA's 2026 state averages put cropland cash rent at $271 in Iowa, $261 in Illinois and $232 in Indiana, against a national $160 (Farm Policy News, Aug 3, 2026 [7]). Illinois is down $3 from 2025 and $8 from 2024 [1]. Rents fell in 45 Illinois counties and rose in 40 [1]. Macon County was highest at $347 (farmdoc daily, Sep 22, 2026 [14]).
| State | 2026 cropland cash rent ($/acre) | |
|---|---|---|
| Iowa | 271 | ██████████ |
| Illinois | 261 | ██████████ |
| Indiana | 232 | █████████ |
| Nebraska | 227 | ████████ |
| Minnesota | 206 | ████████ |
| Ohio | 188 | ███████ |
| United States | 160 | ██████ |
Basis: state average cash rent, cropland, $ per acre. Source: USDA NASS 2026 state cash rents as relayed by Farm Policy News, University of Illinois, Aug 3, 2026 [7]. Bars are scaled to Iowa.
Illinois farm managers, surveyed in the summer when they expected $4.54 corn and $11.57 soybeans, put 2027 rent $3 to $5 below 2026 on every land class: $380 against $384 on excellent ground, $322 against $325 on good [1]. The authors note those answers came before the price rally and that expectations of further declines are "now likely lower." Purdue's 2026 survey has Indiana top-quality rent down 4.1% to $305 and average-quality down 1.4% to $260 (Purdue PAER, Aug 2026 [8]). Chicago Fed lenders reported district cash rents down 3% for 2026, the second straight decline (Chicago Fed AgLetter, May 2026 [9]), and by midyear 3.7% of their farm loans had major or severe repayment problems, the highest share since 2020 (Chicago Fed AgLetter, Aug 2026 [10]). Our September piece covered the manager survey and the negotiating position it implies (Crop Root Zone TRZ-0185, Sep 11, 2026 [15]). This piece is about the lease formula.
The budgets set the margin those rents leave. The table adds one column the budget does not print: the rent the university's own variable-lease factors would produce at budget revenue.
| Illinois region | Budget cash rent | Operator and land return, rotation | Farmer return at that rent | Rent at farmdoc variable factors* | Difference* |
|---|---|---|---|---|---|
| Northern | 293 | 341 | 48 | 324 | +31 |
| Central, high productivity | 321 | 382 | 61 | 359 | +38 |
| Central, low productivity | 279 | 331 | 52 | 306 | +27 |
| Southern | 186 | 165 | −22 | 201 | +15 |
Basis: $ per acre, 50-50 corn-soybean rotation, corn $5.00, soybeans $12.00, trend yields, $16–17 of ARC/PLC included. Source: farmdoc daily, Table 1, Sep 1, 2026 [2]; rent factors from farmdoc daily, Sep 30, 2025 [4]. Rotation figures are Crop Root Zone averages of the corn and soybean columns. *Crop Root Zone calculation: each region's corn and soybean rent factor times budget crop revenue, averaged. The standalone budget file dated August 2026 shows corn yields two bushels higher in three regions than the Sep 1 article [3]; we use the article.
The $61 in central Illinois compares with an average of $100 since 2000 on the same rotation, and the authors note that a 50-cent move in corn shifts returns by more than $100 an acre [2].
2. Two flex designs, priced at the budget
What's new: The two designs that extension economists publish split 2027 revenue very differently. One shares gross revenue. The other shares what is left after costs.
Evidence: Percent of revenue. Illinois' design multiplies crop revenue, farm yield times an agreed cash price, by a rent factor. For high-productivity central Illinois the factors are 30% of corn revenue and 38% of soybean revenue. The floor is $100 under the area's average cash rent and the cap is $100 over it. The factors were set so the lease would have equalled average cash rent over 2007 through 2024 (farmdoc daily, Sep 30, 2025 [4]). Iowa State describes the same structure and reports that most Iowa flex leases take 25% to 40% of gross crop value. Iowa cash rent averaged 30% of corn value and 40% of soybean value over 2016 through 2025 (Iowa State Ag Decision Maker C2-21, May 2026 [5]).
Base plus bonus. Iowa State's second design sets a base rent and pays the landowner one-third to one-half of revenue above a base value, which can be the tenant's non-land cost plus the base rent [5]. Purdue's version sets the base at 90% of fixed cash rent and the bonus at 50% of revenue above non-land cost plus base (Purdue Center for Commercial Agriculture, Jul 2, 2026 [6]). On the Illinois budget that is a $289 base, with the bonus starting at $1,174 of corn revenue and $823 of soybean revenue.
| 2027 budget acre | Crop revenue | Non-land cost | Fixed rent | Percent-of-revenue rent* | Base-plus-bonus rent* |
|---|---|---|---|---|---|
| Corn, 245 bu at $5.00 | 1,225 | 885 | 321 | 368 | 315 |
| Soybeans, 77 bu at $12.00 | 924 | 534 | 321 | 351 | 340 |
| Rotation average | 1,075 | 710 | 321 | 359 | 327 |
| Farmer return, rotation | 61 | 23* | 55* |
Basis: $ per acre, central Illinois high-productivity farmland. Source: farmdoc 2027 Crop Budgets, Table 2, Aug 2026 [3]; lease parameters from [4] and [6]. *Crop Root Zone calculations. Percent lease: 30% of corn and 38% of soybean crop revenue. Bonus lease: $289 base plus 50% of crop revenue above non-land cost plus base, on crop revenue only. Farmer return includes the budget's $17 of ARC/PLC.
$38 an acre
What the landowner gains, and the operator gives up, by moving from $321 fixed rent to Illinois' published 30%/38% variable lease at the university's own 2027 budget prices and yields. It is 62% of the operator's projected $61 return. (Crop Root Zone calculation from farmdoc [3][4])
The reason is in the ratios. The budget's $321 is 26.2% of corn revenue and 34.7% of soybean revenue. The published factors are 30% and 38%. Fixed rent has slipped to 29.9% of rotation revenue against the 33.4% the factors reproduce, because non-land costs on this rotation rose from $654 an acre in 2025 to a projected $710 in 2027 and rent could not hold its historical share [2].
Ground Truth: A tenant who asks for "a flex lease" this fall to get relief from a rent that will not come down gets the opposite if the landowner pulls the factors off the university's website. Those factors encode a period when rent took a third of revenue. The fixed market has already moved off that share, to under 30%, which means the $321 fixed lease is the discounted lease at 2027 prices. The landowner offered a switch to 30/38 should take it. The tenant should negotiate the factor and leave the form alone: scaling both factors by 0.893, to 26.8% and 33.9%, makes the percent lease equal to $321 at budget and lowers the operator's break-even from 94% to 92% of budget revenue.
3. The grid: what each side gets across 2027 outcomes
What's new: We ran the three leases across five price pairs and three yield levels. The percent lease pays the landowner more than fixed in 11 of 15 cells. The bonus lease does in eight.
Evidence: Non-land costs are held at budget in every cell and no crop insurance indemnity is included, so the low-revenue rows overstate the operator's loss.
| Corn / soybean price | Fixed | Percent, yield −15%* | Percent, budget yield* | Percent, yield +10%* | Bonus, yield −15%* | Bonus, budget yield* | Bonus, yield +10%* |
|---|---|---|---|---|---|---|---|
| $4.00 / $10.00 | 321 | 249 | 293 | 323 | 289 | 289 | 295 |
| $4.50 / $11.00 | 321 | 277 | 326 | 359 | 289 | 295 | 326 |
| $5.00 / $12.00 | 321 | 305 | 359 | 395 | 289 | 327 | 381 |
| $5.50 / $13.00 | 321 | 333 | 392 | 420 | 296 | 377 | 436 |
| $6.00 / $14.00 | 321 | 362 | 415 | 421 | 331 | 427 | 490 |
Basis: rent to the landowner, $ per acre, 50-50 rotation, central Illinois high-productivity. Budget yield is 245 bu corn and 77 bu soybeans; −15% is 208 and 65; +10% is 270 and 85. Prices are cash prices at the delivery point. Source: farmdoc [3][4]; Purdue [6]. *All flex rents are Crop Root Zone calculations. The percent lease has a $221 floor and $421 cap applied to each crop. The bonus lease as Purdue specifies it has no cap.
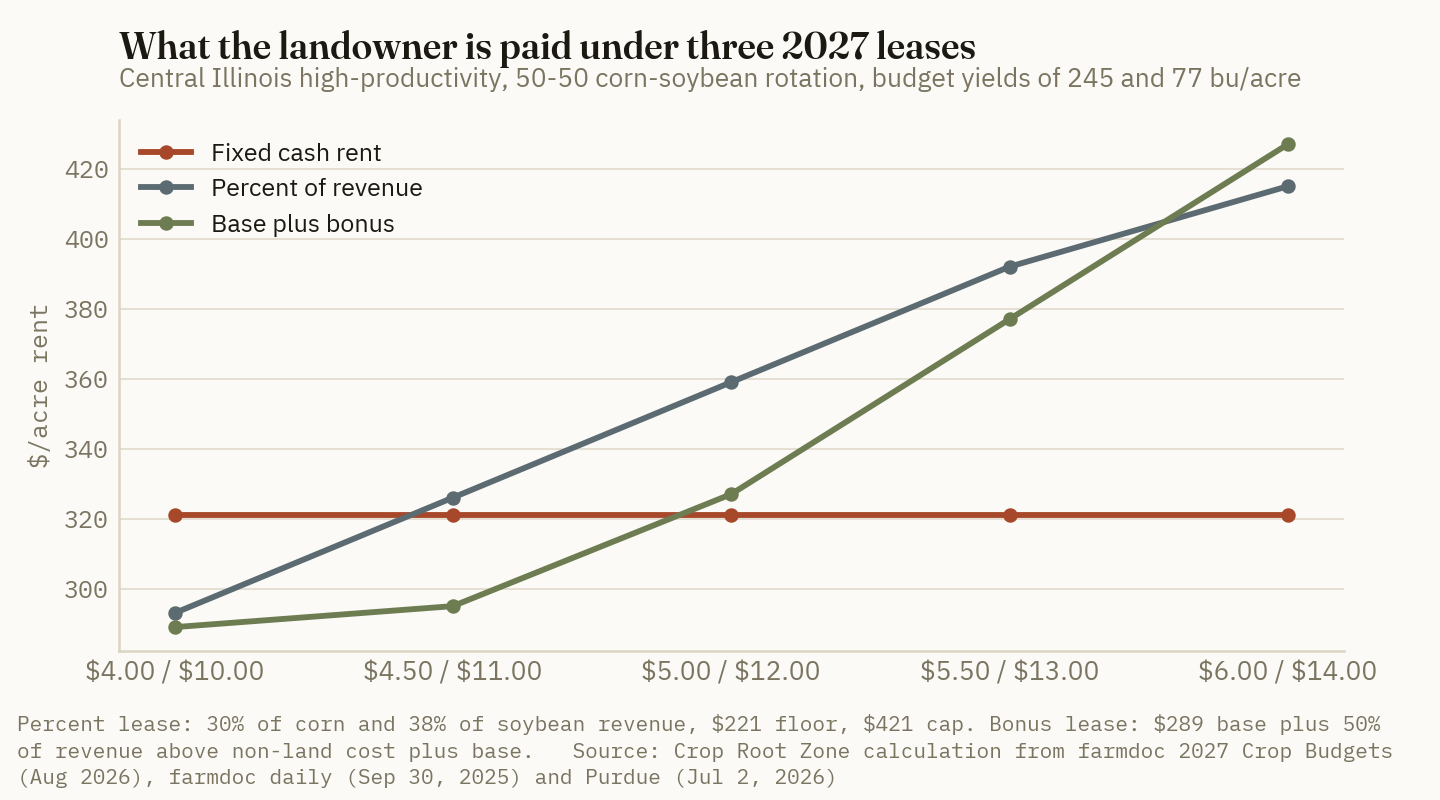
| Corn / soybean price | Fixed, −15%* | Fixed, budget* | Fixed, +10%* | Percent, −15%* | Percent, budget* | Percent, +10%* | Bonus, −15%* | Bonus, budget* | Bonus, +10%* |
|---|---|---|---|---|---|---|---|---|---|
| $4.00 / $10.00 | −270 | −138 | −51 | −198 | −111 | −53 | −238 | −106 | −25 |
| $4.50 / $11.00 | −185 | −39 | 59 | −141 | −44 | 21 | −153 | −13 | 54 |
| $5.00 / $12.00 | −100 | 61 | 168 | −85 | 23 | 94 | −68 | 55 | 109 |
| $5.50 / $13.00 | −15 | 161 | 278 | −28 | 89 | 179 | 10 | 105 | 164 |
| $6.00 / $14.00 | 69 | 260 | 388 | 29 | 166 | 288 | 59 | 155 | 218 |
Basis: farmer return, $ per acre, after $709.50 of non-land cost and rent, including $17 of ARC/PLC. Columns are yield scenarios. Source: farmdoc [3][4]; Purdue [6]. *Crop Root Zone calculations, except the $61 at budget price and yield, which is farmdoc's figure. Costs, ARC/PLC and insurance are not adjusted for yield or price.
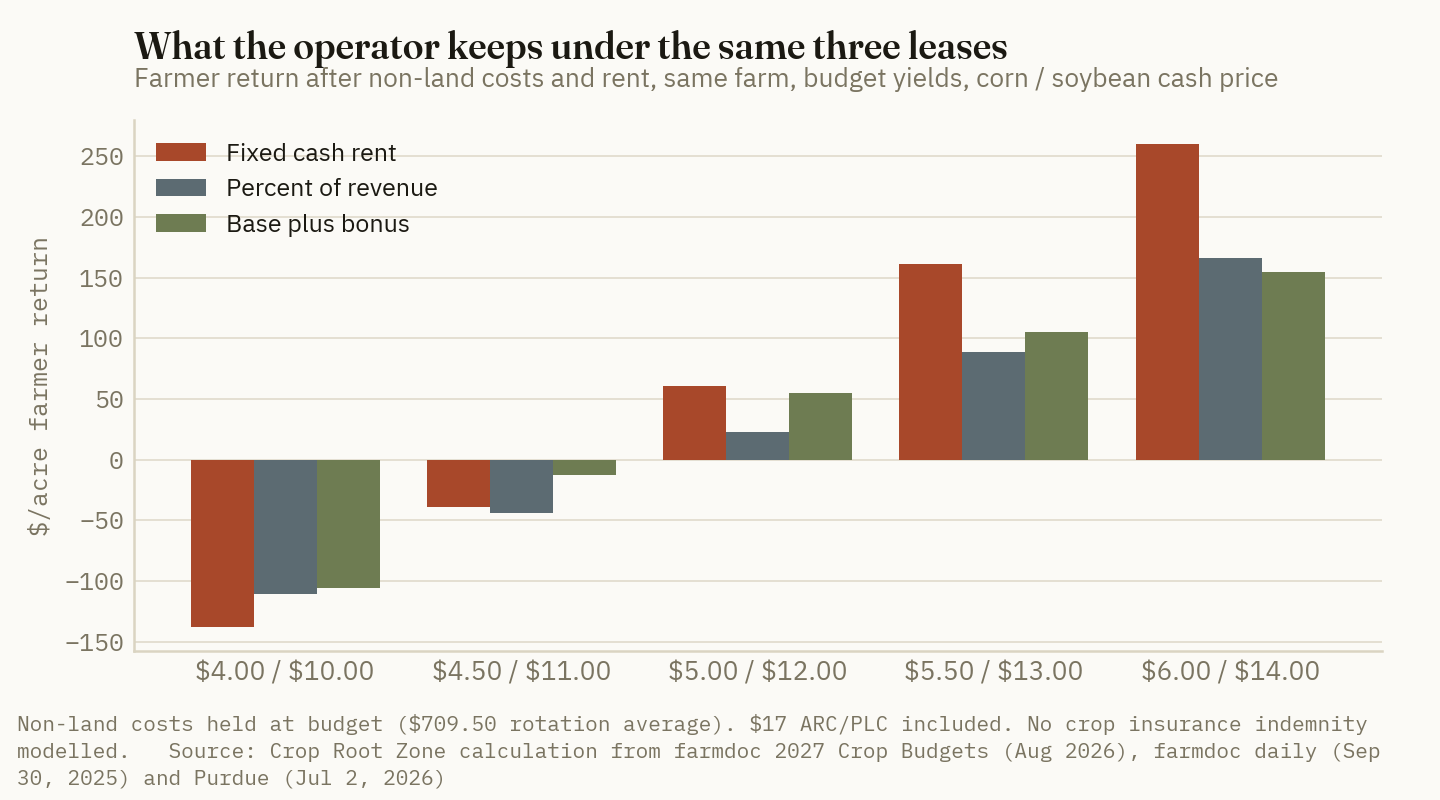
At budget yields and $4.50 corn the operator loses $39 under fixed rent and $44 under the percent lease. Revenue is 9% under budget in that cell, the operator is already under water, and the percent lease still charges $5 more than fixed. It becomes the cheaper lease only in the $4.00 row.
The history fits the grid. Purdue's west central Indiana case farm paid a flex bonus in 11 of the 20 years from 2007 through 2026, averaging $35 an acre, and none in 2014 through 2019 or 2024 through 2025. Over the whole period the landowner's average return was similar under fixed, flex and crop-share leases [6]. In Iowa, fixed rent of $256 was 19% of a $1,314 corn acre in 2022, when a 30% lease would have paid $394. In 2024 rent of $279 was 32% of an $871 corn acre and the same lease would have paid $261 [5]. The 30% figures are our arithmetic on Iowa State's table.
4. The break-even revenue for each side
What's new: Each lease has two break-evens: the revenue above which the landowner does better than fixed rent, and the revenue above which the operator covers every cost. The percent lease has the lowest of the first and the highest of the second.
Evidence: Revenue is scaled from the budget's $1,075 rotation average, with corn and soybean prices moving together at budget yields. A yield shortfall of the same percentage at budget prices gives the same result.
| Lease | Landowner out-earns $321 fixed above* | Corn / soybean price at budget yields* | Operator covers all costs above* | Corn / soybean price at budget yields* |
|---|---|---|---|---|
| Fixed, $321 | n/a | n/a | 94.3% ($1,014) | $4.72 / $11.32 |
| Percent of revenue, 30% / 38% | 89.3% ($960) | $4.47 / $10.72 | 96.8% ($1,040) | $4.84 / $11.62 |
| Base $289 plus 50% bonus | 98.9% ($1,063) | $4.94 / $11.87 | 92.0% ($988) | $4.60 / $11.04 |
| Percent, rescaled to 26.8% / 33.9% | 100.0% ($1,075) | $5.00 / $12.00 | 91.9% ($987) | $4.59 / $11.03 |
Basis: share of budget rotation crop revenue, with $ per acre in brackets; central Illinois high-productivity, 50-50 rotation. Source: farmdoc [3][4]; Purdue [6]. *All figures are Crop Root Zone calculations. Operator break-evens include $17 of ARC/PLC and no insurance indemnity.
The operator is better off under the percent lease than under fixed rent only below 89.3% of budget revenue. At that point both leases leave a loss of about $53 an acre. Anywhere above that, including the whole range between an 11% shortfall and budget, the operator pays more rent than under the fixed lease.
December 2027 corn was quoted at $5.1975 and November 2027 soybeans at $12.63 at 12:44 UTC on October 5 (FXEmpire, Oct 5, 2026 [11][12]). Those are delayed futures quotes, not settlements. The budget's $5.00 and $12.00 are cash prices after an Illinois basis [2], and we did not obtain a 2027 new-crop cash bid, so the futures are given for orientation only. They sit above the budget prices. The market's current read of 2027 is in the part of the grid where both flex designs pay the landowner more than fixed rent.
Ground Truth: Priced as insurance, the published percent lease is expensive. The operator pays $38 an acre at budget, and the first dollar of relief arrives after revenue has fallen 11%. A 15% shortfall saves $16. An 85% Revenue Protection policy, the level on Purdue's case farm [6], starts paying at roughly the same point, though its guarantee is set off the February projected price and the farm's own yield history. The rent relief and the indemnity cover the same bad years. The base-plus-bonus lease costs $6 at budget and saves the full $32 once revenue is 11% under budget, the point where the percent lease saves its first dollar. An operator buying downside protection should choose the bonus design. A landowner who expects $5.00 corn should choose the percent design. A landowner who expects $6.00 should choose the bonus design without a cap, which pays $427 against $415.
5. What the formula leaves out, and what to write down
What's new: A percent-of-revenue lease shares price and yield and nothing else. The cost side of the 2027 budget is where the operator's margin went.
Evidence: Fertilizer in the central Illinois corn budget rises from $210 an acre in 2025 to $229 in 2026 and $263 in 2027 [2]. Retail anhydrous averaged $977 a ton in the week of September 21 through 25, up 6% in a month and 25% in a year, or $0.60 a pound of nitrogen (DTN/Progressive Farmer, Sep 30, 2026 [13]). Midwest operating loans averaged 7.12% at midyear [10], and our September piece put the financing cost of the corn budget's direct costs at about $28.60 an acre (Crop Root Zone TRZ-0200, Sep 16, 2026 [16]). Non-land costs take 66% of rotation revenue at budget.
Under fixed rent and under the percent lease, the tenant carries every dollar of that. Under a bonus lease whose trigger is the tenant's cost plus base rent, the landowner carries half of any cost increase while the bonus is live. A trigger written on 2025 costs instead of 2027 costs would be $55.50 lower on the rotation and would raise the bonus by $27.75.
Five terms decide the outcome, and Iowa State's worksheet lists them for the lease supplement [5]:
- The factor or the trigger, as a number. For 2027 the gap between 30%/38% and 26.8%/33.9% is $38 an acre at budget.
- Whose costs set the trigger and who updates it. A published budget line is verifiable by both sides. The tenant's own books are not.
- The price. Iowa State suggests an average of local bids on fixed dates, including forward bids for harvest delivery [5]. A harvest-only price ignores what the tenant actually sold.
- Floor and cap. Illinois recommends both [4]. A bonus lease without a cap gives the landowner the whole top of the grid.
- Other revenue. Purdue counts ARC/PLC and insurance in revenue [6]. Iowa State notes they arrive 3 to 13 months after rent is due and are often left out [5].
Flexible leases were 14% of Iowa cash leases in Iowa State's 2022 tenure survey [5] and 34% of rental agreements on professionally managed Illinois farms in 2025 [4]. Three things will move these numbers before spring: the December 2027 and November 2027 contracts through the fall fertilizer run, the February crop insurance projected prices, and any revision to the Illinois 2027 budgets. The university revised its 2026 budgets in May [2].
References
- N. Paulson, G. Schnitkey, J. Tsay and C. Zulauf, "Illinois Cash Rents in 2026 and Outlook for 2027," farmdoc daily (16):165, University of Illinois, Sep 15, 2026. https://farmdocdaily.illinois.edu/2026/09/illinois-cash-rents-in-2026-and-outlook-for-2027.html
- N. Paulson, G. Schnitkey, C. Zulauf and B. Zwilling, "Illinois Crop Budgets for 2027," farmdoc daily (16):157, University of Illinois, Sep 1, 2026. https://farmdocdaily.illinois.edu/2026/09/illinois-crop-budgets-for-2027.html
- G. Schnitkey and N. Paulson, "2027 Illinois Crop Budgets," Table 2, Central Illinois, High Productivity Farmland, farmdoc, University of Illinois, original release Aug 2026. https://farmdoc.illinois.edu/assets/management/crop-budgets/crop_budgets_2026_Aug.pdf
- N. Paulson, G. Schnitkey and C. Zulauf, "Revised Variable Cash Lease Parameters," farmdoc daily (15):179, University of Illinois, Sep 30, 2025. https://farmdocdaily.illinois.edu/2025/09/revised-variable-cash-lease-parameters.html
- A. Johanns and W. Edwards, "Flexible Farm Lease Agreements," Ag Decision Maker File C2-21 (FM 1724), Iowa State University Extension and Outreach, revised May 2026. https://www.extension.iastate.edu/agdm/wholefarm/pdf/c2-21.pdf
- M. Langemeier, "Comparing Net Returns for Alternative Leasing Arrangements," Purdue Center for Commercial Agriculture, Jul 2, 2026. https://ag.purdue.edu/commercialag/home/resource/2026/07/comparing-net-returns-for-alternative-leasing-arrangements-2026/
- Farm Policy News, University of Illinois, "US Cropland Tops $6,000 per Acre for First Time in 2026," Aug 3, 2026, updated Aug 25, 2026 (relaying USDA NASS 2026 state cash rents). https://farmpolicynews.illinois.edu/2026/08/us-cropland-tops-6000-per-acre-for-first-time-in-2026/
- Purdue Agricultural Economics Report, "Purdue Farmland Values and Cash Rent Survey Results," Aug 2026. https://ag.purdue.edu/commercialag/home/paer-publication/2026-08-paer-purdue-farmland-values-and-cash-rent-survey-results/
- D. Oppedahl and E. Kepner, AgLetter No. 2012, Federal Reserve Bank of Chicago, May 2026. https://www.chicagofed.org/publications/agletter/2025-2029/may-2026
- E. Kepner and D. Oppedahl, AgLetter No. 2013, Federal Reserve Bank of Chicago, Aug 2026. https://www.chicagofed.org/publications/agletter/2025-2029/august-2026
- FXEmpire, Corn futures contracts (CBOT December 2027, ZCZ27), delayed quote at 12:44 UTC, Oct 5, 2026. https://www.fxempire.com/commodities/zc/contracts
- FXEmpire, Soybean futures contracts (CBOT November 2027, ZSX27), delayed quote at 12:44 UTC, Oct 5, 2026. https://www.fxempire.com/commodities/zs/contracts
- R. Quinn, "Anhydrous Leads Fertilizer Prices Higher, Up 25% From a Year Ago," DTN/Progressive Farmer, Sep 30, 2026 (retail survey Sep 21–25, 2026). https://www.dtnpf.com/agriculture/web/ag/crops/article/2026/09/30/anhydrous-leads-fertilizer-prices-25
- N. Paulson, G. Schnitkey and C. Zulauf, "Average Illinois Cash Rents and Soil Productivity in 2026," farmdoc daily (16):170, University of Illinois, Sep 22, 2026. https://farmdocdaily.illinois.edu/2026/09/average-illinois-cash-rents-and-soil-productivity-in-2026.html
- Crop Root Zone, TRZ-0185, "Two-Thirds of Illinois Farm Managers Expect 2027 Rent to Be Exactly What 2026 Was. Nine Percent Expect It Higher.," Sep 11, 2026.
- Crop Root Zone, TRZ-0200, "A Quarter-Point Rate Move Is Worth About $1 an Acre on a 2027 Illinois Corn Crop. The Budget Projects a $36 Profit.," Sep 16, 2026.
Disclosures
Crop Root Zone is an independent publication. Nothing here is investment advice. Market calls, where included, reflect the editors' own read and are not a recommendation to buy or sell any security.
The Final 2025 Corn Price Is $4.16, a Penny Above FSA's Projection. PLC Pays 26 Cents, About $33 a Base Acre at 160 Bushels. ARC-CO Beats It on Roughly Half of Corn Base.
NASS's final 2025/26 averages fix PLC at $0.26 a bushel for corn, $0.21 for soybeans and $1.29 for wheat; FSA's county yields put ARC-CO ahead on roughly half of corn and soybean base and almost no wheat, and no payment is yet confirmed issued.
USDA's National Agricultural Statistics Service (NASS) published the 2025/26 marketing-year average (MYA) prices on Tuesday, September 29: $4.16 a bushel for corn and $10.50 for soybeans (USDA NASS, Agricultural Prices, Sep 29, 2026 [1]). Those two numbers were the last ones missing from the 2025-crop farm program payments, which by statute could not be issued before October 1. The corn price is one cent higher than the $4.15 the Farm Service Agency (FSA) was still carrying as a projection in its payment-rate table when we downloaded it on October 2 (USDA FSA, Table 3, Sep 11, 2026 [2]). Against a $4.42 effective reference price, that makes the Price Loss Coverage (PLC) rate for corn 26 cents a bushel, not 27. Soybeans pay 21 cents. Wheat, whose price was final in June, pays $1.29.
For 2025 only, every enrolled farm receives the higher of its PLC or county Agriculture Risk Coverage (ARC-CO) payment, whichever program it elected (USDA FSA fact sheet, Sep 2025 [8]). So the cheque depends on the county. This piece works out both payments from FSA's own county files, puts them next to a 2027 fertilizer bill, and separates what is final from what is still projected.
1. The prices: corn is a cent higher than the estimates used
What's new: NASS's September Agricultural Prices gives a 2025/26 corn MYA of $4.16, from monthly prices that ran from $3.93 in October 2025 to $4.48 in May 2026, weighted by marketings. Soybeans came in at $10.50. Sorghum was $6.56 a hundredweight (USDA NASS, Sep 29, 2026 [1]). FSA's tables name this report as the source of the final corn, soybean and sorghum prices [2].
Evidence: The 2025 budget law, the One Big Beautiful Bill Act, raised the statutory reference prices to $4.10 for corn, $10.00 for soybeans and $6.35 for wheat. The effective reference price is the higher of that figure or 88% of the five-year Olympic average of MYA prices, capped at 115% of the statutory price. For corn and soybeans the 88% escalator is the one that binds. For wheat it produces only $5.76, so the $6.35 statutory price applies (USDA FSA, Table 2, Sep 11, 2026 [3]).
| Crop | Statutory reference price | Effective reference price | 2025/26 MYA | PLC rate ($/bu) | Status at Oct 2, 2026 |
|---|---|---|---|---|---|
| Corn | 4.10 | 4.42 | 4.16 | 0.26* | NASS published Sep 29. FSA table still shows $4.15, projected |
| Soybeans | 10.00 | 10.71 | 10.50 | 0.21* | NASS published Sep 29. FSA table shows $10.50, projected |
| Wheat | 6.35 | 6.35 | 5.06 | 1.29 | Final at FSA since June 30 |
Basis: $ per bushel, national. Source: USDA FSA Tables 2 and 3, dated Sep 11, 2026, downloaded Oct 2, 2026 [2][3]; USDA NASS, Agricultural Prices, Sep 29, 2026 [1]. *Crop Root Zone calculation: effective reference price minus NASS's MYA. FSA had not relabelled these two rates as final when we downloaded the table.
The projections were close. FSA's table, farmdoc's county work, and the farm-press worked examples all used $4.15 for corn (farmdoc daily, Jul 14, 2026 [10]; Morning Ag Clips, Sep 22, 2026 [11]; Farm CPA Report, Sep 14, 2026 [12]). The soybean projection had already moved from $10.40 in July to $10.50 in September, which cut that rate from 31 cents to 21 [10][11]. The last cent on corn matters more than it looks. PLC pays the rate times the farm's PLC yield times 85% of base acres, so one cent is worth $1.36 a base acre at a 160-bushel yield [12].
Sorghum is the one place where the gap is larger. FSA's table projects $3.70 a bushel and a 97-cent rate [2]. NASS's $6.56 a hundredweight converts to about $3.67 at 56 pounds a bushel, which would make the rate about $1.00. That conversion is ours and FSA has not posted a final figure.
Ground Truth: Any cash-flow sheet built in September on 27-cent corn is about 4% too high on PLC. Applying the one-cent change to every county in FSA's files takes about $110 million off the national corn total, by our estimate. For most Corn Belt farms the larger correction is sequestration, which the widely quoted per-acre figures leave out. The two together move a 160-bushel corn base acre from the $36.72 in circulation to about $33.34.
2. PLC per base acre, after the 85% factor and sequestration
What's new: With the rates set, the PLC payment for a farm is arithmetic. Payment acres are 85% of base acres (USDA FSA fact sheet, Sep 2025 [8]). Payments made in fiscal 2027 are then reduced 5.7% for budget sequestration, according to farm management analyst Kent Thiesse (Morning Ag Clips, Sep 22, 2026 [11]). We did not find the 5.7% rate in a USDA document, so every after-sequestration figure in this piece is marked as an estimate.
Evidence: The national base-weighted average PLC yields in FSA's county file are 143.1 bushels for corn, 40.9 for soybeans and 41.8 for wheat (USDA FSA, PLC county yields, Apr 17, 2025 [6]; Crop Root Zone calculation). A farm's own PLC yield is on its FSA-156EZ and is usually well below its current actual yield.
| Crop | PLC yield (bu/acre) | PLC rate ($/bu) | Per base acre, after 85% factor | After 5.7% sequestration* |
|---|---|---|---|---|
| Corn | 120 | 0.26 | 26.52 | 25.01 |
| Corn | 143.1 (national average) | 0.26 | 31.63 | 29.82 |
| Corn | 160 | 0.26 | 35.36 | 33.34 |
| Corn | 200 | 0.26 | 44.20 | 41.68 |
| Soybeans | 40.9 (national average) | 0.21 | 7.30 | 6.88 |
| Soybeans | 50 | 0.21 | 8.93 | 8.42 |
| Wheat | 41.8 (national average) | 1.29 | 45.83 | 43.22 |
| Wheat | 60 | 1.29 | 65.79 | 62.04 |
Basis: $ per base acre of that crop, not per planted acre. Source: USDA FSA Tables 2 and 3 [2][3]; USDA NASS [1]; FSA PLC county yields [6]; Crop Root Zone calculation. *Estimate: assumes the 5.7% sequestration rate reported by Thiesse [11] applies to the whole payment.
$33.34 a base acre
PLC on a corn base acre with a 160-bushel PLC yield: 26 cents × 160 bushels × 85%, less 5.7% sequestration. The same acre at 27 cents and before sequestration, the figure most often quoted, was $36.72. (USDA NASS, Sep 29, 2026 [1]; USDA FSA [2]; Ag Bull Trading, Sep 29, 2026 [19]; Crop Root Zone estimate)
Two limits apply after that. DTN reports the per-person payment limit for 2025 at $160,000 after an inflation adjustment (DTN/Progressive Farmer, Sep 4, 2026 [13]). And the payment follows base acres, not what was planted. A farm that planted all corn in 2025 is still paid on its corn base and its soybean base separately.
3. ARC-CO against PLC, county by county
What's new: FSA's September 1 county file carries 2025 actual yields for corn and soybeans alongside each county's benchmark revenue. The price and payment-rate columns for those two crops are still blank (USDA FSA, ARC-CO 2025 data, Sep 1, 2026 [5]). We filled them in with NASS's MYA and FSA's own formula. For wheat, FSA's rates are already posted, and our formula reproduced all 3,141 of them to the cent.
Evidence: The 2025 ARC-CO guarantee is 90% of benchmark revenue, and the payment is capped at 12% of benchmark revenue. Benchmark prices are $5.03 for corn, $12.17 for soybeans and $6.98 for wheat (USDA FSA, Table 4, Sep 11, 2026 [4]). At a $4.16 MYA, a county's corn pays under ARC-CO whenever its 2025 yield was below 108.8% of its benchmark yield, and pays the cap at 94.3% or lower. For soybeans at $10.50 the two thresholds are 104.3% and 90.4%. For wheat at $5.06 they are 124.1% and 107.6% (Crop Root Zone calculation from [4]).
Whether ARC-CO beats PLC is a separate question, and the six corn counties below show the range.
| County, crop | 2025 yield vs. benchmark | ARC-CO ($/base acre) | County PLC yield | PLC ($/base acre) | Higher of the two | After sequestration* |
|---|---|---|---|---|---|---|
| Benton, IN, corn | +9.1% | 0.00* | 160.6 | 35.50 | 35.50 | 33.48 |
| McLean, IL, corn | +7.6% | 9.78* | 171.8 | 37.96 | 37.96 | 35.79 |
| Sangamon, IL, corn | +4.8% | 31.74* | 169.1 | 37.38 | 37.38 | 35.25 |
| Renville, MN, corn | +5.2% | 26.12* | 160.5 | 35.48 | 35.48 | 33.46 |
| Darke, OH, corn | −4.2% | 94.86* | 145.1 | 32.07 | 94.86 | 89.45 |
| Story, IA, corn | −6.3% | 113.54* (cap) | 158.5 | 35.03 | 113.54 | 107.07 |
| McLean, IL, soybeans | +7.8% | 0.00* | 52.5 | 9.36 | 9.36 | 8.83 |
| Renville, MN, soybeans | +0.8% | 17.48* | 44.6 | 7.96 | 17.48 | 16.48 |
| Darke, OH, soybeans | −9.5% | 77.23* | 44.4 | 7.92 | 77.23 | 72.83 |
| Whitman, WA, wheat | −5.3% | 55.90 (cap) | 70.7 | 77.52 | 77.52 | 73.10 |
| Sumner, KS, wheat | +4.3% | 27.91 (cap) | 36.7 | 40.26 | 40.26 | 37.96 |
| Hill, MT, wheat | +17.8% | 9.02 | 37.2 | 40.83 | 40.83 | 38.50 |
Basis: $ per base acre after the 85% payment-acre factor. PLC uses the county-average PLC yield, so an individual farm's figure will differ. McLean soybeans and Sumner wheat are the non-irrigated rates. Source: USDA FSA ARC-CO 2025 data file, Sep 1, 2026 [5]; FSA PLC county yields [6]; FSA Table 4 [4]; USDA NASS [1]. *Crop Root Zone calculation, not an FSA-posted rate: corn and soybean ARC-CO rates use NASS's MYA in FSA's formula, and the last column assumes 5.7% sequestration [11]. Wheat ARC-CO rates are FSA's posted figures.
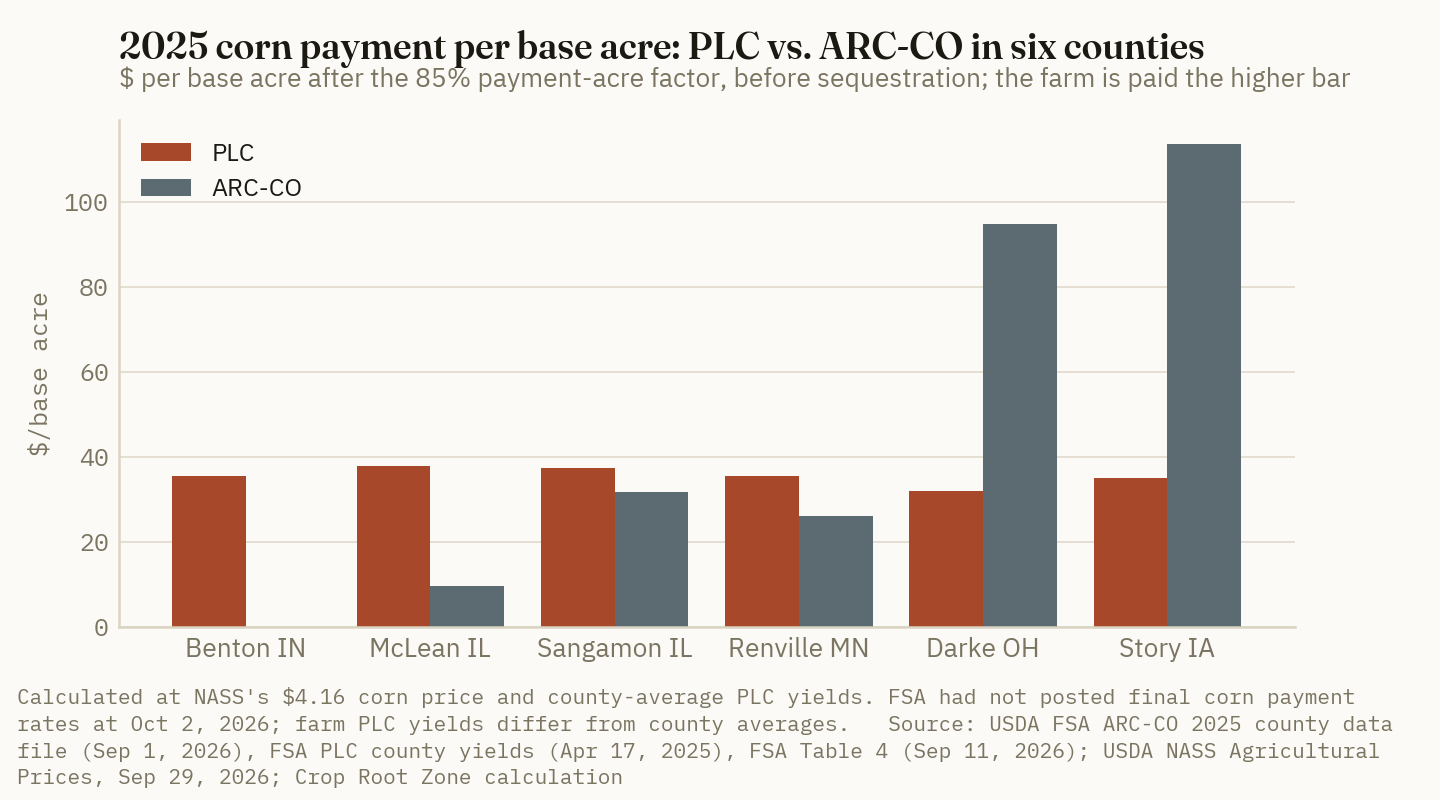
PLC barely moves from county to county, and ARC-CO moves a great deal. Benton County, Indiana missed an ARC-CO payment by $3.00 an acre of revenue: its guarantee was $1,046.28 and its actual revenue was $1,049.28 [5]. Story County, Iowa, with a yield 6.3% under benchmark, is at the cap.
Applying the same calculation to every county in the file gives national averages. They are estimates. About half of corn, soybean and wheat base sits in counties where FSA publishes separate irrigated and non-irrigated yields, and the file does not say how each county's base divides between them. We weighted those counties by the national irrigated share of ARC-CO base (USDA FSA, enrolled base acres, Jan 14, 2026 [7]) and show the range from two other weightings.
| Crop | PLC for all base | ARC-CO for all base | Higher of the two | Range | After sequestration | farmdoc, May 14 | Total before sequestration ($ bil) |
|---|---|---|---|---|---|---|---|
| Corn | 31.62* | 40.81* | 53.32* | 50.54–56.81 | 50.28* | 58 | 4.93* |
| Soybeans | 7.30* | 24.10* | 27.52* | 27.28–28.03 | 25.95* | 29 | 1.45* |
| Wheat | 45.81* | 22.85* | 45.95* | 45.86–46.54 | 43.33* | 47 | 2.73* |
Basis: national average $ per base acre after the 85% factor. Source: USDA FSA [4][5][6][7]; USDA NASS [1]; farmdoc daily, May 14, 2026 [9]. *Crop Root Zone estimates covering 92.6 million corn, 52.6 million soybean and 59.4 million wheat base acres. The range runs from treating all split-county base as non-irrigated to weighting irrigated and non-irrigated equally. farmdoc's figures used May WASDE prices and NASS county yields, include the 85% factor and exclude sequestration [9].
Our three-crop total is about $9.1 billion before sequestration and about $8.6 billion after. farmdoc's May figures add up to $9.66 billion, against $2.6 billion for the 2024 crop (DTN/Progressive Farmer, Sep 4, 2026 [13]).
| Crop | Share of base where ARC-CO pays more than PLC | Share where ARC-CO pays zero | Share at the ARC-CO cap | |
|---|---|---|---|---|
| Corn | 51%* | █████░░░░░ |
30%* | 17%* |
| Soybeans | 52%* | █████░░░░░ |
43%* | 23%* |
| Wheat | 2%* | ░░░░░░░░░░ |
20%* | 51%* |
Source: Crop Root Zone estimates from USDA FSA [4][5][6][7] and USDA NASS [1], same weighting as above. Across the alternative weightings the first column runs 47–57% for corn, 52–54% for soybeans and 1–9% for wheat. Bars are scaled to 100% of base.
Wheat is the clearest case. Half of wheat base is in counties at the ARC-CO cap, and PLC still pays more almost everywhere, because a $1.29 rate on a 42-bushel yield beats 12% of a benchmark revenue built on $6.98 wheat. farmdoc's July reading of the first FSA yields also put 53% of wheat counties at the cap (farmdoc daily, Jul 14, 2026 [10]).
Ground Truth: The 2025 higher-of rule pays most where the election went wrong, and the largest group is wheat. FSA's enrollment file shows 56% of wheat base, about 34.9 million acres, elected ARC-CO for 2025 [7]. On our averages that base would have received about $23 an acre under its own election and will receive about $46 instead. That is roughly $0.8 billion. Corn adds about $1.3 billion, mostly ARC-CO electors in counties with good yields, such as Benton and McLean, who would have received little or nothing. Soybeans add about $0.2 billion. The total is about $2.3 billion across the three crops, and it assumes the base in each program looks like the average county. The rule does not exist for 2026. A farm's October 2026 deposit is therefore the better of two programs, and it says little about which one to elect for the crop now being harvested.
4. The cheque against a 2027 fertilizer bill
What's new: The payment for the 2025 crop arrives in the same weeks that fall fertilizer for the 2027 crop is bought. The University of Illinois' 2027 budget for corn after soybeans on high-productivity central Illinois farmland carries $263 an acre of fertilizer, $579 of direct costs, $321 of cash rent and a farmer return of $36. Its revenue line includes $17 an acre of ARC/PLC for 2027 (farmdoc, 2027 Crop Budgets, Aug 2026 [17]).
Evidence: McLean County, Illinois sits in that budget region. Its corn base acre collects $35.79 after sequestration and its soybean base acre $8.83. Enrolled base in the county is about 62% corn and 38% soybeans [6], so a farm with the county's mix averages about $25.70 across all its base acres.
| October 2026 payment, after sequestration* | $/base acre | Share of a $263 corn fertilizer bill | |
|---|---|---|---|
| Story, IA corn base acre (ARC-CO cap) | 107.07 | 40.7% | ██████████ |
| McLean, IL corn base acre (PLC) | 35.79 | 13.6% | ███░░░░░░░ |
| Corn base acre, 160-bushel PLC yield | 33.34 | 12.7% | ███░░░░░░░ |
| McLean, IL farm, county base mix | 25.70 | 9.8% | ██░░░░░░░░ |
| McLean, IL soybean base acre (PLC) | 8.83 | 3.4% | █░░░░░░░░░ |
Basis: 2025-crop payment per base acre against farmdoc's 2027 central Illinois high-productivity fertilizer line for corn after soybeans. Source: farmdoc, 2027 Crop Budgets, Table 2 [17]; USDA FSA [4][5][6]; USDA NASS [1]. *Crop Root Zone estimates, assuming 5.7% sequestration [11]. The Story County row is set against the Illinois budget for scale only. Bars are scaled to the largest payment.
At DTN's mid-September retail anhydrous price of $945 a ton, or $0.58 a pound of nitrogen (DTN/Progressive Farmer, Sep 23, 2026 [18]), the $35.79 on a McLean County corn base acre buys about 62 pounds of nitrogen. On a farm with the county's base mix, the $25.70 average buys about 44.
The payment is also about the size of the margin. The same budget projects a $36 farmer return on 2027 corn at a $5.00 price [17]. One year's PLC payment on a central Illinois corn base acre roughly equals the whole projected return on next year's corn acre, and it is about twice the $17 the budget assumes the programs will pay for 2027. Where ARC-CO hit the cap the comparison is different in kind. Story County's $107 would cover about two-fifths of a fertilizer bill the size of the one in the Illinois budget.
Our earlier piece on USDA's farm income forecast covered the sector totals for government payments (Crop Root Zone TRZ-0201, Sep 16, 2026 [20]). The county figures here show how unevenly those payments are spread across farms.
Ground Truth: On most Corn Belt base the October cheque is a nitrogen payment and not much more. A $25-to-$36 deposit per base acre covers a tenth to an eighth of a 2027 corn fertilizer bill in central Illinois. It buys 44 to 62 pounds of nitrogen as anhydrous, and it does not change whether the acre pencils. In the ARC-CO cap counties of Iowa and Ohio the deposit runs three times that. Those farms are getting it because 2025 revenue came in short. Lenders will see the largest cheques in the counties with the weakest 2025 revenue. The deposit there repairs working capital and should not be counted as new money for 2027 inputs.
5. What is final, what is projected, and when the money moves
What's new: The government is funded. The President signed the Continuing Appropriations and Extensions Act, 2027 (H.R. 6500) on September 2. It funds federal agencies through December 11, 2026 (White House, Sep 2, 2026 [15]). There was no lapse on October 1.
Evidence: That is the difference from last year. The shutdown that began October 1, 2025 stopped FSA from processing the ARC and PLC payments due that month until county offices resumed core operations on October 23, 2025 (Georgia Farm Bureau, Oct 22, 2025 [16]). This year USDA Under Secretary Richard Fordyce said in early September that payments would be on time, would start in early October and would be well above last year's, and that the Commodity Credit Corporation has the funds (DTN/Progressive Farmer, Sep 4, 2026 [13]). On October 1 he repeated that payments for the 2025 crop will be issued in October (Southeast AgNet, Oct 1, 2026 [14]).
| Item | Status at Oct 2, 2026 | Source |
|---|---|---|
| Effective reference prices | Final | FSA Table 2 [3] |
| Wheat MYA, PLC rate, county ARC-CO rates | Final | FSA Tables 3 and 4, county file [2][4][5] |
| Corn and soybean MYA | Published by NASS Sep 29. Not yet marked final in FSA's tables | NASS [1]; FSA [2] |
| Corn and soybean county ARC-CO rates | Yields posted. Rates not posted | FSA county file [5] |
| Sequestration rate | Reported at 5.7%. Not confirmed from a USDA document | Thiesse [11] |
| Long-grain rice MYA | Due Oct 30. Temperate japonica due Jan 29, 2027 | FSA Table 3 [2] |
| Payments issued | Not confirmed | See below |
Source: as listed. FSA tables are dated Sep 11, 2026 and were downloaded Oct 2, 2026.
We found no FSA announcement and no report of deposits as of Friday, October 2. The statute and FSA's fact sheet say "after October 1," which is the earliest date and not a promise of one [8]. Thiesse expects payments during October [11]. Until FSA posts final corn and soybean rates, the county figures in this piece remain calculations.
Three things to watch from here:
- FSA's rate tables. When Table 3 shows corn at $4.16 with an F beside it, the 26-cent rate is official. The county file's blank columns should fill at the same time.
- The first deposits. Wheat, barley and oat rates have been final since June, so nothing technical holds those back.
- The 2026 election. Thiesse lists 2026 enrollment as open through December 11 [11]. Our August piece covered the base-acre and election mechanics (Crop Root Zone TRZ-0068, Aug 5, 2026 [21]). The point to carry from this one is that the higher-of rule ends with the 2025 crop.
References
- USDA National Agricultural Statistics Service, Agricultural Prices, released Sep 29, 2026 (2025/26 marketing-year average prices for corn, soybeans and sorghum). https://www.nass.usda.gov/Publications/Todays_Reports/reports/agpr0926.pdf
- USDA Farm Service Agency, "Table 3. Projected 2025 Price Loss Coverage (PLC) Payment Rates," dated Sep 11, 2026, downloaded Oct 2, 2026. https://www.fsa.usda.gov/sites/default/files/2026-09/2025_PLC_0.xlsx
- USDA Farm Service Agency, "Table 2. 2025 Effective Reference Price Calculations," dated Sep 11, 2026. https://www.fsa.usda.gov/sites/default/files/2026-09/2025_ERP_0.pdf
- USDA Farm Service Agency, "Table 4. 2025 Benchmark and Actual Price Calculations for County Agricultural Risk Coverage (ARC-CO)," dated Sep 11, 2026. https://www.fsa.usda.gov/sites/default/files/2026-09/2025_ARC_CO_0.pdf
- USDA Farm Service Agency, "ARC-CO Trend Adjusted Yields, Benchmark Yields and Guarantee Revenues for Program Year 2025," data file dated Sep 1, 2026. https://www.fsa.usda.gov/sites/default/files/2026-09/arcco_2025_data%20%282026-09-01%29.xlsx
- USDA Farm Service Agency, "Program Year 2025 Average PLC Yields by County," Apr 17, 2025. https://www.fsa.usda.gov/sites/default/files/2025-04/plc_county_yields_py2025.xlsx
- USDA Farm Service Agency, "Program Year 2025 Covered Commodity Contract Base Acres on Enrolled Farms by Program by Commodity," as of Jan 14, 2026. https://www.fsa.usda.gov/sites/default/files/2026-01/2025_enrolled_base_web.xlsx
- USDA Farm Service Agency, "2025 Agriculture Risk Coverage (ARC) & Price Loss Coverage (PLC) Overview," fact sheet, Sep 2025. https://www.fsa.usda.gov/sites/default/files/2025-09/FSA_ARC%20%26%20PLC_3pg_Fact%20Sheet-SEPT%202025_final.pdf
- H. Monaco, G. Schnitkey, N. Paulson, J. Coppess and C. Zulauf, "2025 ARC/PLC Final Estimates," farmdoc daily, University of Illinois, May 14, 2026. https://farmdocdaily.illinois.edu/2026/05/2025-arc-plc-final-estimates.html
- N. Paulson, H. Monaco, G. Schnitkey and C. Zulauf, "Initial 2025 FSA Yields and ARC-CO for Corn, Soybeans, and Wheat," farmdoc daily, University of Illinois, Jul 14, 2026. https://farmdocdaily.illinois.edu/2026/07/initial-2025-fsa-yields-and-arc-co-for-corn-soybeans-and-wheat.html
- K. Thiesse, "Final MYA Price Will Affect 2025 PLC and ARC-CO Payments," Morning Ag Clips, Sep 22, 2026. https://www.morningagclips.com/final-mya-price-will-affect-2025-plc-and-arc-co-payments/
- P. Neiffer, "A Penny Sounds Small Until You Multiply It by Your PLC Yield," Farm CPA Report, Sep 14, 2026. https://www.farmcpareport.com/p/a-penny-sounds-small-until-you-multiply
- C. Clayton, "Ag Policy Blog: USDA Official: ARC, PLC Payments Will Be Significantly Higher and on Time," DTN/Progressive Farmer, Sep 4, 2026. https://www.dtnpf.com/agriculture/web/AG/news/article/2026/09/04/ag-policy-blog-usda-official-arc-plc
- Southeast AgNet, "What ARC and PLC Updates Mean for Livestock Producers," Oct 1, 2026. https://southeastagnet.com/2026/10/01/arc-plc-program-updates-base-acres-livestock-producers/
- The White House, "Congressional Bill H.R. 6500 Signed into Law," Sep 2, 2026. https://www.whitehouse.gov/briefings-statements/2026/09/congressional-bill-h-r-6500-signed-into-law/
- Georgia Farm Bureau, "USDA to resume some FSA functions, including loans, ARC, PLC," Oct 22, 2025. https://www.gfb.org/news/ag-news/post/usda-to-resume-some-fsa-functions-including-loans-arc-plc
- G. Schnitkey and N. Paulson, "2027 Crop Budgets," Table 2, Central Illinois, High Productivity Farmland, farmdoc, University of Illinois, original release Aug 2026. https://farmdoc.illinois.edu/assets/management/crop-budgets/crop_budgets_2026_Aug.pdf
- R. Quinn, "Fertilizer Prices Rise for Six of Eight Major Fertilizers," DTN/Progressive Farmer, Sep 23, 2026 (retail survey Sep 14–18, 2026). https://www.dtnpf.com/agriculture/web/ag/crops/article/2026/09/23/fertilizer-prices-rise-six-eight
- Ag Bull Trading, "ARC/PLC Payments Still Slated for October as Farmers Await Final Amounts," Sep 29, 2026. https://www.agbull.com/arc-plc-payments-still-slated-for-october-as-farmers-await-final-amounts/
- Crop Root Zone, TRZ-0201, "USDA Sees 2026 Net Farm Income Down 2.6%. Net of $47.4 Billion in Government Payments, It Falls 18%.," Sep 16, 2026.
- Crop Root Zone, TRZ-0068, "You Have 26 Days on Base Acres and No Date at All on the Election," Aug 5, 2026.
Disclosures
Crop Root Zone is an independent publication. Nothing here is investment advice. Market calls, where included, reflect the editors' own read and are not a recommendation to buy or sell any security.
Old-Crop Corn Counted 2.095 Billion Bushels, 173 Million Over USDA. The Summer Quarter Grew 3.4%, Not the 9.1% USDA's Figure Needed.
NASS's September 1 count beat every trade guess and our own most bearish scenario. Implied 2025/26 corn use drops about 230 million bushels, lifting the 2026/27 carry-in toward 1.74 billion. Soybeans came in 10 million tight.
At noon Eastern on Wednesday, September 30, USDA's National Agricultural Statistics Service (NASS) counted 2.095 billion bushels of corn in all positions on September 1, 2026. That is up 35% from a year earlier. The count was 173 million bushels above the 1.922 billion in the September WASDE, 177 million above the average trade estimate of 1.918 billion, and 90 million above the highest estimate of 2.005 billion (USDA NASS Grain Stocks, Sep 30, 2026; Pro Farmer, Sep 29, 2026). In the same report NASS cut the 2025 corn crop by 57 million bushels, to 16.964 billion. Larger stocks from a smaller crop mean less corn was used than USDA estimated, by about 230 million bushels. December corn settled at $5.00¾, down 21¼ cents, a five-week low (Brownfield Ag News, Sep 30, 2026; Pro Farmer, Sep 30, 2026). Soybeans went the other way. At 315 million bushels, soybean stocks were 10 million under USDA and 9 million under the trade. Wheat was 1.846 billion, below most guesses.
On September 23 we wrote that USDA's 1.922 billion required June-August corn use to have grown 9.1% from a year earlier, after March-May had grown 6.6% (Crop Root Zone TRZ-0223, Sep 23, 2026). This piece checks that test against the count and works out what the result means for the 2026/27 balance sheet, the harvest price, and bin decisions.
1. The count: corn above every estimate, soybeans and wheat below
What's new: NASS's September 1 figures, the trade survey, and USDA's own figure, side by side.
Evidence:
| Sept. 1, 2026 stocks (mil bu) | NASS count | Trade avg. | Trade range | Sept. WASDE | vs. WASDE | vs. trade avg. | Year ago |
|---|---|---|---|---|---|---|---|
| Corn | 2,095.1 | 1,918 | 1,843–2,005 | 1,922 | +173 | +177 | 1,551.3 |
| Soybeans | 315.1 | 324 | 304–349 | 325 | −10 | −9 | 324.8 |
| All wheat | 1,845.7 | 1,889 | 1,771–2,342 | n/a* | n/a* | −43 | 2,134.0 |
Source: USDA NASS Grain Stocks, Sep 30, 2026; Pro Farmer, "What to expect from USDA's September 30 reports," Sep 29, 2026 (trade average and range); USDA WASDE-675, Sep 11, 2026. Year-ago figures are NASS's revised September 1, 2025 counts. Other surveys put the trade ranges at 1,860–2,005 for corn, 305–335 for soybeans and 1,790–1,955 for wheat (DTN/Progressive Farmer, Sep 30, 2026). *Wheat's marketing year starts June 1, so September 1 wheat stocks are not a WASDE ending-stocks figure. USDA's June 1 beginning stocks of 920 million match NASS's 920.1 million count.
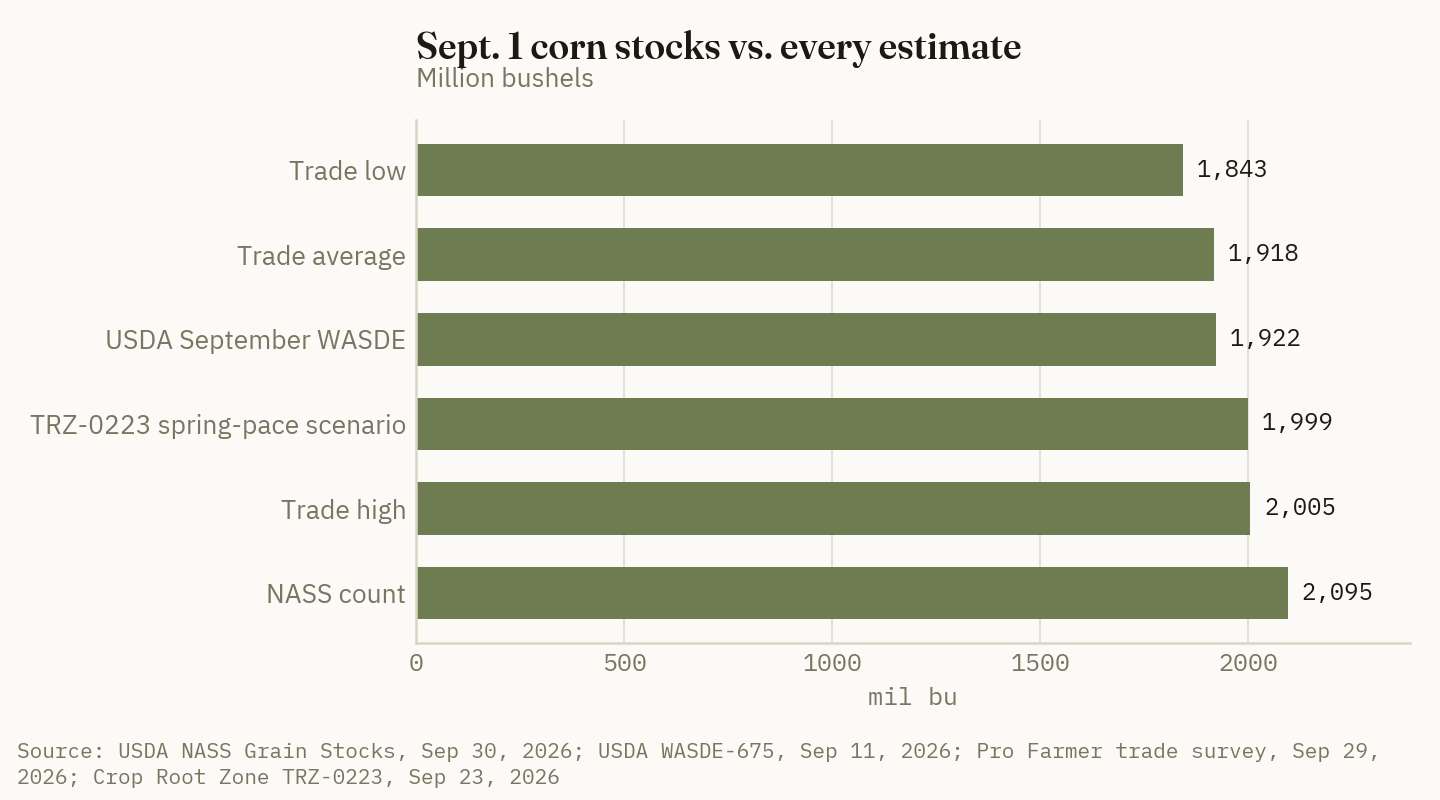
The corn count also came with a smaller crop. NASS lowered 2025 harvested area by 310,000 acres, left yield at 186.5 bushels an acre, and cut production 57 million bushels to 16.964 billion. That is still a record (USDA NASS Grain Stocks, Sep 30, 2026; ADM Investor Services, Sep 30, 2026). The soybean revision was small: 1 million bushels off, to 4.261 billion, with yield unchanged at 53.0 bushels an acre. NASS raised the 2026 all-wheat crop 3 million bushels to 1.534 billion, which was 10 million above trade expectations (ADM Investor Services, Sep 30, 2026; DTN/Progressive Farmer, Sep 30, 2026).
Positions matter for harvest. On-farm corn was 787 million bushels, up 22% from 643 million a year earlier. Off-farm corn was 1.308 billion, up 44% from 908 million (USDA NASS Grain Stocks, Sep 30, 2026). Most of the extra old-crop corn is in commercial space, which is the same space elevators need for harvest receipts.
2. TRZ-0223's test: the summer quarter ran 3.4%, the slowest of the year
What's new: NASS's own release puts June-August 2026 corn disappearance at 3.20 billion bushels, against 3.10 billion a year earlier (USDA NASS Grain Stocks, Sep 30, 2026). NASS also revised June 1 stocks slightly, to 5.291 billion. Taking that revision into account, summer use grew 3.4%. USDA's figure needed about 9.1%.
Evidence: Our preview had asked whether the slowdown in quarterly growth would reverse over the summer. It didn't. Growth slowed again.
| Quarter | 2024/25 (mil bu) | 2025/26 (mil bu) | Change | |
|---|---|---|---|---|
| Sep–Nov | 4,580 | 5,209 | +13.7% | ██████████ |
| Dec–Feb | 3,928 | 4,276 | +8.9% | ██████░░░░ |
| Mar–May | 3,505 | 3,739 | +6.7% | █████░░░░░ |
| Jun–Aug | 3,092 | 3,196 | +3.4% | ██░░░░░░░░ |
| USDA's implied Jun–Aug (Sept. WASDE) | 3,092 | 3,373 | +9.1% | ███████░░░ |
Source: USDA NASS Grain Stocks, Sep 30, 2026 (revised Dec 1, Mar 1, Jun 1 and Sep 1 stocks; revised 2025 production of 16,963.6 million bushels); 2024/25 quarters as published in Crop Root Zone TRZ-0223, Sep 23, 2026, from NASS Grain Stocks, Sep 30, 2025 and Jun 30, 2026. Disappearance = opening stocks, plus production in Sep–Nov, minus closing stocks. Imports excluded. The 2025/26 Sep–Nov figure falls from TRZ-0223's 5,267 because of the production cut. Bars scaled to the Sep–Nov growth rate. Crop Root Zone calculation.
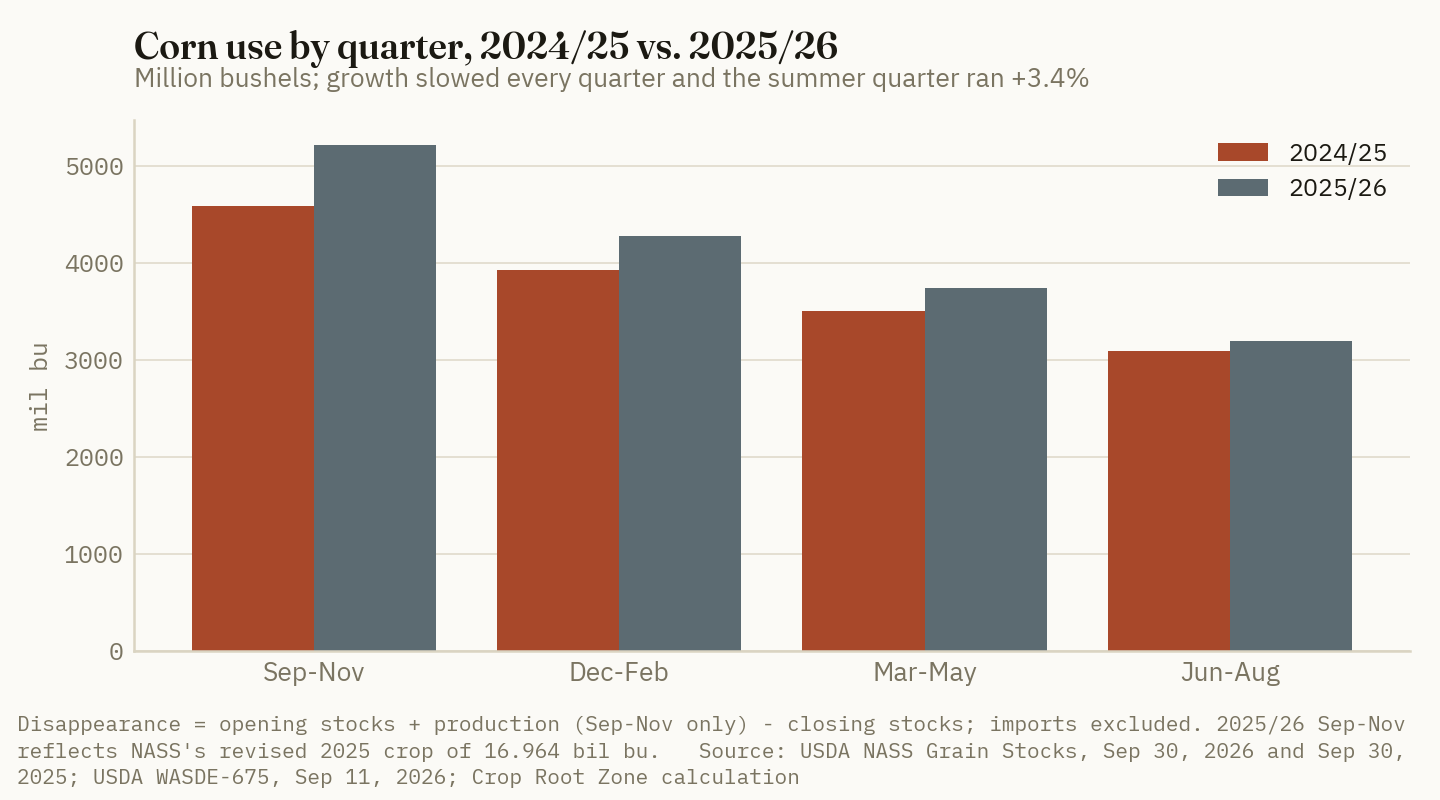
Here is how the preview did. The direction was right and the size was wrong. TRZ-0223 said a count above 1.922 billion needed only that summer use grow as fast as spring use. That scenario gave 1.999 billion. The count beat that by another 96 million bushels. Our Ground Truth said the 2026/27 carryout's "likelier center" was 1.60 to 1.65 billion. On the count alone it is now about 1.74 billion. We had the deceleration but did not take it far enough: summer growth fell to about half the spring rate instead of holding at it.
The soybean call was also off. We said the more useful soybean number on report day would be the revision to the 2025 crop, because past soybean misses had mostly come from those revisions. This year the revision was 1 million bushels. The 10-million-bushel miss came from use. June-August soybean disappearance was 744 million bushels, up 9.0% from 683 million a year earlier. USDA's figure had implied about 736 million, or 7.8% growth (USDA NASS Grain Stocks, Sep 30, 2026; TRZ-0223).
230 million bushels
How much less corn was used in 2025/26 than USDA's September balance sheet assumed: 173 million in higher stocks plus a 57-million-bushel smaller crop. (USDA NASS Grain Stocks, Sep 30, 2026; USDA WASDE-675, Sep 11, 2026; Crop Root Zone calculation)
Most of that should land in feed and residual. Exports and ethanol grind are reported directly, and export inspections had run far ahead of the prior year all summer (Brownfield Ag News, Aug 31, 2026). Feed and residual is calculated as what is left over. If the whole 230 million comes out of it, 2025/26 feed and residual falls from 6.350 billion to about 6.120 billion. That is still a record and 12.5% above 2024/25's 5.438 billion, but well short of the 16.8% growth USDA had carried (USDA WASDE-675, Sep 11, 2026; Crop Root Zone estimate). ADM's analysts said they expect USDA to cut 2025/26 feed and residual by more than 200 million bushels (ADM Investor Services, Sep 30, 2026).
Ground Truth: The September count says less about the 2025 crop than about a feeding estimate that grew in step with the record harvest when actual use did not. That has a second effect. USDA's 2026/27 feed and residual projection of 5.950 billion was set against a 2025/26 base of 6.350 billion. If the base is really about 6.120 billion, USDA's projection for next year rests on the same assumption the count just disproved. Growth in corn use slowed in every quarter of 2025/26, and nothing in the count suggests it turned up again at the start of the new year. We think October's revision will reach the new-crop year and not just close the old one.
3. Where the 2026/27 balance sheet starts now
What's new: USDA's next WASDE and Crop Production reports come out October 9 (USDA WASDE report calendar). The September WASDE projected 2026/27 corn ending stocks at 1.567 billion bushels, or 9.7% of 16.180 billion of total use, on a 15.800-billion-bushel crop at 178.5 bushels an acre (USDA WASDE-675, Sep 11, 2026).
Evidence: The first row of the table below is arithmetic, not a forecast. The beginning stocks are now a count, and carrying the 173-million-bushel difference forward with nothing else changed is the minimum adjustment. The rows below it show what happens if USDA also cuts 2026/27 feed and residual. If USDA kept the same ratio of 2026/27 to 2025/26 feed use that it used in September (5,950 ÷ 6,350), and applied it to the lower base, the 2026/27 figure would come down about 215 million bushels.
| 2026/27 corn scenario | Beginning stocks | Feed & residual | Total use | Ending stocks | Stocks-to-use |
|---|---|---|---|---|---|
| September WASDE | 1,922 | 5,950 | 16,180 | 1,567 | 9.7% |
| Count carried in, nothing else changed | 2,095 | 5,950 | 16,180 | 1,740* | 10.8%* |
| …and feed & residual −100 | 2,095 | 5,850 | 16,080 | 1,840* | 11.4%* |
| …and feed & residual −215 (same ratio as Sept.) | 2,095 | 5,735 | 15,965 | 1,955* | 12.2%* |
Million bushels. Source: USDA WASDE-675, Sep 11, 2026; USDA NASS Grain Stocks, Sep 30, 2026. *Crop Root Zone scenarios, not forecasts. They assume USDA's 15.800-billion-bushel 2026 crop, imports of 25 million and unchanged exports and FSI. The October 9 Crop Production report will change production, and that could offset or add to any of these rows.
For scale: in September USDA cut 2026/27 ending stocks by 86 million bushels and raised its season-average corn price 30 cents, to $4.80. That move was driven by a smaller crop, so it is not an elasticity (USDA WASDE-675, Sep 11, 2026). The count adds twice that many bushels before any feed revision. The market took 21¼ cents off December corn on report day. December had settled at $5.36¾ on September 22, so it has now fallen 36 cents in six sessions (Brownfield Ag News, Sep 22 and Sep 30, 2026).
Soybeans tightened. Carried forward one-for-one, the 10-million-bushel shortfall lowers 2026/27 ending stocks from 310 million to about 300 million. Against USDA's 4.575 billion of total use, that is 6.6% stocks-to-use, down from 6.8% (USDA WASDE-675, Sep 11, 2026; Crop Root Zone calculation). November soybeans lost only 4¾ cents, to $12.93, while corn fell 21¼. That gap fits the two balance sheets moving in opposite directions (Brownfield Ag News, Sep 30, 2026).
Wheat was the quiet one. September 1 stocks were 1.846 billion, down 13.5%, and June-August disappearance was 608 million bushels, against 710 million a year earlier, out of a smaller supply. The 2026 crop is 1.534 billion bushels, down from 1.985 billion (USDA NASS Grain Stocks, Sep 30, 2026; DTN/Progressive Farmer, Sep 30, 2026). December SRW fell 17 cents to $6.75¾ and HRW 10 cents to $7.33. That looks more like corn pulling wheat down than any change in wheat itself (Pro Farmer, Sep 30, 2026).
4. The farm-level read: harvest price, unpriced bushels, bins
What's new: As of September 27, 18% of the corn crop and 17% of soybeans were harvested. Corn was level with the five-year average, and 57% of the corn still in the field was rated good to excellent (DTN/Progressive Farmer, Sep 28, 2026). October, the month whose average December-futures settlement sets the crop-insurance harvest price, begins today.
Evidence, unpriced bushels: At USDA's 178.5-bushel national yield, the 21¼-cent drop in December corn is about $37.93 an acre on bushels not yet priced. The 4¾-cent soybean drop is about $2.51 an acre at 52.8 bushels (USDA WASDE-675, Sep 11, 2026; Crop Root Zone calculation).
Evidence, revenue protection: The 2026 projected price is $4.62 for corn and $11.09 for soybeans (DTN/Progressive Farmer, Feb 27, 2026). December corn is still above $4.62, so the revenue guarantee rises and falls with the October average. That makes the stocks-day drop a drop in the insurance guarantee as well as in the cash value of the crop.
| Revenue protection, 80% coverage, 200 bu APH (illustrative) | Harvest price | Guarantee ($/acre) | vs. pre-report |
|---|---|---|---|
| October average at Sept. 29 Dec. corn settle | $5.22 | 835.20 | — |
| October average at Sept. 30 Dec. corn settle | $5.00¾ | 801.20 | −34.00 |
| Floor: projected price | $4.62 | 739.20 | −96.00 |
Source: DTN/Progressive Farmer, Feb 27, 2026 (projected price); Brownfield Ag News, Sep 30, 2026 (December settle and change; Sep 29 settle derived). Guarantee = APH × coverage × higher of projected or harvest price. The 200-bushel APH is a hypothetical farm, not a USDA figure. Crop Root Zone calculation.
From here down to $4.62, each cent the October average falls cuts this example farm's guarantee by $1.60 an acre. Below $4.62 the guarantee stops falling and further price declines start to count as revenue loss.
Evidence, bins and basis: National on-farm storage was not, in total, much fuller than a year ago. Corn, soybeans and wheat on farms added up to 1.424 billion bushels on September 1, against 1.427 billion in 2025. Corn rose 144 million and wheat fell 146 million (USDA NASS Grain Stocks, Sep 30, 2026; Crop Root Zone calculation). The pressure is in where the corn is.
| Sept. 1 corn (mil bu) | On-farm 2025 | On-farm 2026 | Change | Off-farm 2025 | Off-farm 2026 | Change |
|---|---|---|---|---|---|---|
| Iowa | 130.0 | 140.0 | +8% | 208.3 | 275.5 | +32% |
| Illinois | 56.0 | 58.0 | +4% | 109.5 | 194.9 | +78% |
| Nebraska | 70.0 | 105.0 | +50% | 95.8 | 143.1 | +49% |
| Minnesota | 96.0 | 105.0 | +9% | 80.4 | 137.3 | +71% |
| South Dakota | 58.0 | 85.0 | +47% | 57.7 | 73.8 | +28% |
| United States | 643.2 | 787.3 | +22% | 908.1 | 1,307.8 | +44% |
Source: USDA NASS Grain Stocks, Sep 30, 2026, Corn Stocks by Position, States. Percentages are Crop Root Zone calculations.
On-farm corn grew most in Nebraska and South Dakota, where old crop now takes up about half again as much bin space as a year ago. Off-farm corn grew most in Illinois and Minnesota, where the elevators that will take harvest receipts are carrying 71% to 78% more old corn. One relay put the national average harvest corn bid 40 cents under December on report day, with interior Iowa bids ranging well below that (Optimus Futures, Oct 1, 2026). We could not check this against a USDA basis series and treat it as indicative.
Evidence, the carry: Storing corn from harvest to a March sale earns the December-to-March futures spread plus any improvement in basis, and costs interest plus storage. The same relay put the spread at 14¾ cents after the report (Optimus Futures, Oct 1, 2026). Using a harvest cash price of about $4.61 (December less 40 cents) and 7% interest for five months:
| Harvest-to-March storage (illustrative) | Interest | Storage | Total cost | Futures carry | Basis gain needed to break even | Per acre at 178.5 bu |
|---|---|---|---|---|---|---|
| On-farm bin | 13.4¢ | 5–10¢* | 18–23¢ | 14¾¢ | 4–9¢ | $0.70–1.60 |
| Commercial storage | 13.4¢ | 15–25¢* | 28–38¢ | 14¾¢ | 14–24¢ | $2.50–4.30 |
Source: Optimus Futures, Oct 1, 2026 (relayed carry and harvest basis; not verified against exchange settlement records); Crop Root Zone calculation. *Storage costs are Crop Root Zone estimates: on-farm covers aeration power, shrink and handling; commercial assumes 3–5 cents a bushel a month. Interest is an assumed 7% annual rate on $4.61 cash corn. Actual costs vary widely by farm and elevator.
Bushels in an owned bin need only a few cents of basis improvement by March to cover their costs. Commercial storage needs about a dime and a half to a quarter, and the futures spread after the report does not cover that on its own. These figures set the hurdle for storage. They are not a recommendation either way.
Ground Truth: The report made this harvest's storage question mostly a question about basis. Futures took the 173-million-bushel surprise in a single session. Elevators have not yet had to take it in harvest bids. They will be receiving the 2026 crop with 44% more old corn in their space, and in Illinois and Minnesota 70%-plus more. If that shows up anywhere, it should show up first in wide harvest basis in those states, which would then raise the basis gain available to anyone with a paid-for bin. Growers in Nebraska and South Dakota are in a different position. Their own bins hold half again as much old crop, so many will have less room to wait for that basis gain. For soybeans the pressure runs the other way: stocks at 6.6% of use leave little in the system to absorb a harvest shortfall.
5. What to watch before the next count
- October 9 WASDE and Crop Production. Look first at the size of the 2025/26 feed and residual cut, then at whether USDA also cuts 2026/27 feed and residual. A cut to both years would push the carryout above the 1.74-billion carry-in line in Section 3.
- The October harvest-price average. Each cent the average falls between now and October 30, down to $4.62, comes directly off revenue-protection guarantees.
- Harvest basis in Illinois and Minnesota. The off-farm numbers point there.
- December 1 Grain Stocks (January). That report will show whether the slower feed use seen over the summer continued into the first quarter of 2026/27.
References
- USDA NASS, Grain Stocks, Sep 30, 2026. https://www.nass.usda.gov/Publications/Todays_Reports/reports/grst0926.pdf
- USDA World Agricultural Outlook Board, World Agricultural Supply and Demand Estimates, WASDE-675, Sep 11, 2026. https://www.usda.gov/oce/commodity/wasde/wasde0926.pdf
- Pro Farmer, "What to expect from USDA's September 30 reports," Sep 29, 2026. https://www.profarmer.com/news/what-expect-usdas-september-30-reports
- Pro Farmer, "After the Bell: Bearish stocks report weighs on corn futures," Sep 30, 2026. https://www.profarmer.com/news/after-bell/after-bell-bearish-stocks-report-weighs-corn-futures
- DTN/Progressive Farmer, "USDA Releases Quarterly Grain Stocks, Small Grains Summary Reports," Sep 30, 2026. https://www.dtnpf.com/agriculture/web/ag/news/article/2026/09/30/usda-releases-quarterly-grain-stocks-2
- ADM Investor Services, Mark Soderberg, "USDA Sept 30 Quarterly Stocks: Bearish Corn, Neutral Wheat," Sep 30, 2026. https://www.admis.com/usda-sept-30-quarterly-stocks-bearish-corn-neutral-wheat/
- Brownfield Ag News, "Closing Grain and Livestock Futures: September 30, 2026," Sep 30, 2026. https://www.brownfieldagnews.com/market-news/closing-grain-and-livestock-futures-september-30-2026/
- Brownfield Ag News, "Closing Grain and Livestock Futures: September 22, 2026," Sep 22, 2026. https://www.brownfieldagnews.com/market-news/closing-grain-and-livestock-futures-september-22-2026/
- Brownfield Ag News, "Corn export inspections continue to stand out," Aug 31, 2026. https://www.brownfieldagnews.com/news/corn-export-inspections-continue-to-stand-out/
- Optimus Futures, "September 2026 Grain Stocks: Corn Beat Every Estimate," Oct 1, 2026 (relayed December-March spread and harvest basis). https://agoptimus.com/september-2026-grain-stocks/
- DTN/Progressive Farmer, "USDA Crop Progress: Corn 18% Harvested, Soybeans 17% Harvested as of Sept. 27," Sep 28, 2026. https://www.dtnpf.com/agriculture/web/ag/news/article/2026/09/28/usda-crop-progress-corn-18-harvested
- DTN/Progressive Farmer, "Crop Insurance Price Falls to $4.62 for Corn, Soybeans Bump Up to $11.09," Feb 27, 2026. https://www.dtnpf.com/agriculture/web/ag/news/business-inputs/article/2026/02/27/crop-insurance-price-falls-4-62-corn
- USDA Office of the Chief Economist, WASDE report page and release schedule (next release Oct 9, 2026), accessed Oct 1, 2026. https://www.usda.gov/about-usda/general-information/staff-offices/office-chief-economist/commodity-markets/wasde-report
- Crop Root Zone, TRZ-0223, "USDA's 1.922 Billion Bushels of Old-Crop Corn Needs the Summer Quarter to Have Run 9.1% Ahead of Last Year. The Spring Quarter Ran 6.6%.," Sep 23, 2026.
Disclosures
Crop Root Zone is an independent publication. Nothing here is investment advice. Market calls, where included, reflect the editors' own read and are not a recommendation to buy or sell any security.
Nebraska Pivot Corn Covers Full Cost at $4.38 for 2027. On a Diesel Pivot at September's Fuel Price, Pumping Now Costs More Than Fertilizer.
At 2027 prices, UNL's electric pivot corn acre covers full cost at $4.38 cash. Fertilizer repricing moves every budget $3 an acre or less. At $5.50 diesel, a diesel pivot's pumping fuel costs $154 an acre, more than its $147 fertilizer.
December 2027 corn settled at $5.2225 on Tuesday, September 29, a quarter of a cent above December 2026 (USDA AMS, Nebraska Daily Elevator Grain Bids, Sep 29, 2026). The same report put central Nebraska elevator bids 30 to 44 cents under December futures, an average cash price of $4.86. A year earlier the same district averaged $3.74. The University of Nebraska-Lincoln's 2026 crop budgets are the standard public cost reference for the state. They were priced from survey and market data gathered between August and October 2025, when Midwest diesel was about $3.70 a gallon (UNL CAP, 2026 Nebraska Crop Budgets; EIA, Sep 29, 2026). We repriced four of those budgets, two pivot-irrigated and two dryland, to the 2027 board and to fall 2026 inputs. Irrigated corn clears full cost at 2027 prices. Fertilizer hardly changes the answer. Diesel does. On a diesel-powered pivot at September's farm fuel price, pumping energy now costs more per acre than fertilizer.
1. The price deck: the 2027 board, Nebraska basis, and what UNL assumed
What's new: UNL publishes costs only; its budgets carry no revenue line. We add one at $4.85 a bushel. That is December 2027 at $5.2225 less 37 cents, the midpoint of central Nebraska's current basis range. The input side we reprice to mid-September 2026 quotes.
Evidence: Fertilizer has barely moved from the budgets' October 2025 prices. Diesel has roughly doubled.
| Input | UNL 2026 budget (priced Aug–Oct 2025) | 2027 planning value | Basis of planning value |
|---|---|---|---|
| Corn, $/bu | — (UNL shows costs only) | 4.85* | Dec 2027 CBOT 522.25¢ (Sep 29) less 37¢, midpoint of central NE bids (−44 to −30) |
| UAN32, $/lb N | 0.74 | 0.72 | DTN retail average, Sep 14–18, 2026, delivered |
| 10-34-0, $/gal | 4.00 | 4.18* | DTN $718/ton ÷ about 171.7 gal/ton |
| Anhydrous, $/lb N (reference) | 0.50 | 0.58 | DTN retail average, Sep 14–18; Iowa distributor ask $0.50 (AMS, Sep 18) |
| Farm diesel, $/gal | 2.70 | 4.00* (stress: 5.50) | Iowa No. 2 farm diesel $5.50 (AMS, Sep 18) less the Oct 2026–Jul 2027 ULSD futures spread of $1.47 (Sep 30) |
| Electricity, $/kWh | 0.12 | 0.12 (held) | UNL's rate-schedule average; range 7.3¢–16.13¢ |
Source: UNL Center for Agricultural Profitability, 2026 Nebraska Crop Budgets (input prices collected Aug–Oct 2025); USDA AMS Nebraska Daily Elevator Grain Bids, Sep 29, 2026; DTN/Progressive Farmer, Sep 23, 2026; USDA AMS Iowa Production Cost Report, week ending Sep 18, 2026; NYMEX ULSD futures via Farmbucks, Sep 30, 2026 (delayed). *Crop Root Zone estimates. The 10-34-0 gallon conversion assumes about 11.65 lb per gallon. The diesel estimate applies today's futures backwardation to today's farm price. It is a planning number, not a quote. Harvest 2027 basis may differ from today's harvest-time basis.
The corn curve is flat, and that matters for a 2027 plan. December 2026 settled at $5.22 the same day as December 2027. The market is not pricing next year's crop at a discount to this one. Nebraska's 2026 crop is short. NASS's September forecast put the state yield at 177 bushels, 8.8% below the prior season, on 9.61 million harvested acres (USDA NASS, Sep 11, 2026). UNL's Hybrid-Maize model, in its final 2026 run, projected below-average yields at most irrigated sites after warm September nights sped the crop to maturity (DTN, Sep 29, 2026).
The diesel number carries the most uncertainty. Midwest on-highway diesel was $6.526 on September 28, against $3.731 a year earlier (EIA, Sep 29, 2026). Iowa farm diesel, which carries no road tax, was $5.50, and Illinois farm diesel was $5.61 (USDA AMS, Sep 18, 2026). The futures curve expects relief. NY Harbor ULSD traded at $5.1235 for October 2026 and $3.6533 for July 2027, the middle of next year's pumping season. We use $4.00 as the 2027 planning price and $5.50 as the case where September's price persists.
2. Four UNL acres repriced: where they break even
What's new: At $4.85 cash, UNL's 275-bushel electric pivot budget covers its full economic cost with $129 an acre to spare. The 245-bushel diesel pivot budget does not, even at the $4.00 diesel estimate. Both dryland budgets clear full cost, narrowly.
Evidence: UNL's "economic" total assumes the operator owns the land. It charges real estate taxes at 1.4% of value, plus a 3% opportunity cost on the land and on machinery. For irrigated ground that land charge is $384 an acre. It implies a value of about $8,730, close to the $8,515 statewide pivot average in UNL's 2026 survey (UNL, Mar 18, 2026). We also show a tenant view. It replaces the land charge with 2026 district cash rent and drops the pivot's ownership cost, since UNL's rent survey assumes the landlord owns the whole irrigation system. Central district pivot rent averaged $270, and dryland $120. East district dryland averaged $220.
| UNL 2026 budget | Yield, bu | Operating cost* | Economic total* | Tenant total* | Return over economic* | Return over tenant* | Break-even price, economic / tenant* | Break-even yield, economic / tenant* |
|---|---|---|---|---|---|---|---|---|
| #33 Pivot, electric, no-till after beans | 275 | 652.17 | 1,205.86 | 1,030.13 | +128.58 | +304.31 | $4.38 / $3.75 | 247 / 210 |
| #37 Pivot, diesel, conv. till after beans | 245 | 616.26 | 1,207.39 | 1,029.21 | −18.53 | +159.65 | $4.93 / $4.20 | 249 / 211 |
| #37 at $5.50 farm diesel | 245 | 668.32 | 1,259.45 | 1,081.27 | −70.59 | +107.59 | $5.14 / $4.41 | 260 / 222 |
| #23 Dryland (state), no-till after beans | 145 | 363.65 | 668.79 | 592.55 | +34.82 | +111.06 | $4.61 / $4.09 | 138 / 121 |
| #24 Dryland (east), no-till after beans | 195 | 422.82 | 879.50 | 739.14 | +66.74 | +207.10 | $4.51 / $3.79 | 181 / 151 |
Source: Crop Root Zone calculation from UNL CAP 2026 Nebraska Crop Budgets #23, #24, #33, #37; USDA AMS, Sep 29, 2026; DTN/Progressive Farmer, Sep 23, 2026; USDA AMS Iowa Production Cost Report, Sep 18, 2026; UNL 2026 Nebraska Farmland Values and Cash Rental Rates (preliminary), Mar 18, 2026. $/acre unless stated. *Estimates at $4.85 cash corn and $4.00 farm diesel unless stated. Fertilizer and all diesel lines repriced, plus UNL's 8%-for-six-months operating interest on the change. Seed, chemicals, custom rates, crop insurance and labor held at budget. Break-even yields let hauling ($0.15/bu) and drying scale with yield. Tenant rent: Central district for #23, #33 and #37; East district for #24.
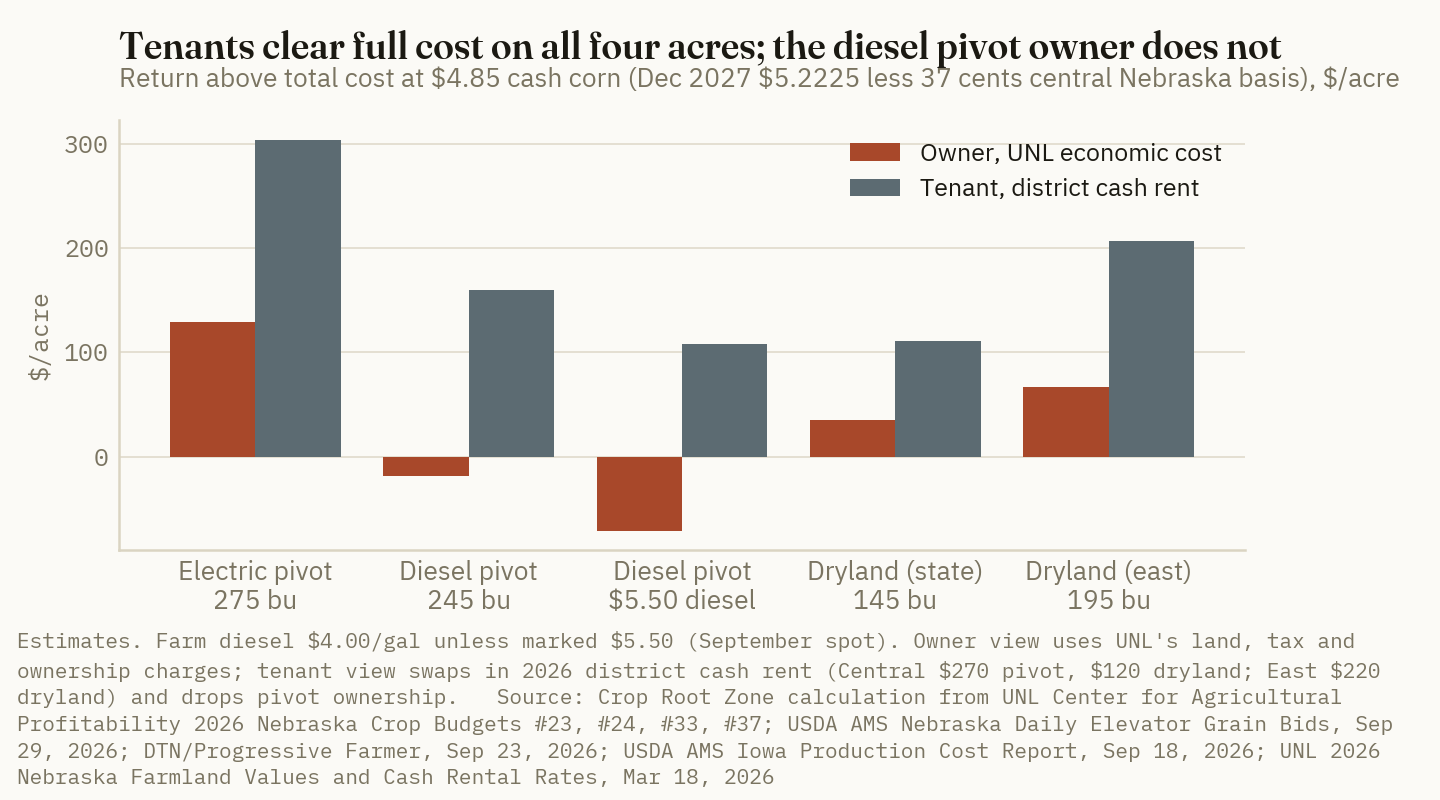
$4.38 a bushel
Cash price at which UNL's 275-bushel electric pivot corn budget covers its full economic cost, including a 3% return on $8,700 land, after repricing to fall 2026 inputs. That is about $4.75 on December 2027 futures at central Nebraska basis. The contract settled at $5.2225 on September 29. (Crop Root Zone calculation from UNL CAP 2026 Nebraska Crop Budgets and USDA AMS, Sep 29, 2026)
The yield cushion is thinner than the price cushion. The electric pivot needs 247 bushels to cover economic cost at $4.85, 28 fewer than the budget plans. That is a 10% shortfall allowance, in a year when UNL's own model has irrigated sites mostly below average. The diesel pivot needs 249 bushels at $4.00 diesel and 260 at $5.50. Its budget plans 245. The two pivot budgets differ in tillage and planned yield, not only in power source. UNL does not publish a diesel no-till pivot corn budget at 275 bushels, so the gap between them is not an energy gap alone. Section 3 isolates the energy part.
3. The cost stack: fertilizer against irrigation
What's new: Repricing fertilizer to September's retail survey changes these budgets by −$0.51 to −$2.91 an acre. UAN32 is 2 cents per pound of N under the budget price, and 10-34-0 is about 18 cents a gallon over. Repricing diesel to $4.00 adds $4 to $5 an acre to the electric pivot and dryland budgets, which use diesel only in the field. It adds $43 to the diesel pivot. At $5.50 the addition is $93.
Evidence: At UNL's own diesel price, fertilizer is the largest single cash input on all four budgets, ahead of seed. Once diesel is repriced, irrigation counted in full is larger than fertilizer on the diesel pivot. On the electric pivot it is about three-quarters of the fertilizer bill.
| Cost line, $/acre | #33 Electric pivot | #37 Diesel pivot, $4.00 diesel | #37 Diesel pivot, $5.50 diesel |
|---|---|---|---|
| Seed | 148.03 | 131.75 | 131.75 |
| Fertilizer (UAN32 + 10-34-0), repriced* | 169.09 | 147.49 | 147.49 |
| Pesticide (herbicide, insecticide, fungicide) | 123.90 | 53.36 | 53.36 |
| Pumping energy | 32.83 | 111.88* | 153.84* |
| Pivot labor and repairs | 32.74 | 27.10 | 27.10 |
| Pivot, pump and well ownership (depreciation + 3% opportunity) | 61.61 | 64.06 | 64.06 |
| Irrigation total | 127.18 | 203.04* | 245.00* |
| Field-operation diesel | 14.58* | 21.61* | 29.72* |
| Fertilizer share of operating cost* | 25.9% | 23.9% | 22.1% |
| Land (UNL real estate tax + 3% opportunity) | 384.12 | 384.12 | 384.12 |
Source: Crop Root Zone calculation from UNL CAP 2026 Nebraska Crop Budgets #33 and #37 (field operation and input pages); DTN/Progressive Farmer, Sep 23, 2026; USDA AMS Iowa Production Cost Report, Sep 18, 2026. *Estimates. Diesel lines scaled from UNL's $2.70 per gallon. UNL's budgets assume 125 feet of pumping lift and 35 psi at the pivot. #33 applies 200 lb N and #37 170 lb N, all as UAN32 through the pivot, plus 6 gallons of 10-34-0 at planting.
Three findings come out of the stack.
At September's diesel price, pumping fuel is the diesel pivot's largest single input. At $5.50, pumping fuel costs $153.84 an acre, against $147.49 for all fertilizer, $131.75 for seed and $122.40 for nitrogen. At the $4.00 planning price, fuel is $111.88, about $10 under the nitrogen bill. A 10% cut in nitrogen on this budget saves about $12. A 10% cut in pumping, one or two fewer irrigation events, saves $11 to $15 at these diesel prices.
The electric budget leaves out a demand charge. UNL's input table lists an "Electricity Fixed" charge of $52 an acre. UNL applies it in its electric-pivot alfalfa budgets, not in the corn budgets, which carry energy use only at 12 cents per kWh. UNL's own rate survey found that three of seven utilities also add power-factor charges. Adding the $52 raises #33's economic break-even from $4.38 to about $4.58, and the tenant break-even from $3.75 to $3.94. A no-load-control rate at 14.3 cents adds another 2 cents a bushel. On the price side, even that fully loaded electric acre still clears $4.85.
Water itself is nearly free in the budget, and that will not always hold. None of the four UNL corn budgets charges for groundwater. Nebraska law lets a natural resources district with an integrated management plan levy an occupation tax of up to $10 per irrigated acre a year (Neb. Rev. Stat. §2-3226.05). That is about 4 cents a bushel at 275 bushels. The larger water costs in Nebraska are allocations and certified-acre limits. They do not appear as a price at all. They appear as the inches a grower is not allowed to pump.
The energy source is where the irrigated budget diverges. UNL's engineering standard converts lift and pressure into water horsepower-hours: (lift + 2.31 × psi) ÷ 8.75. At the budgets' 125 feet and 35 psi, that is 23.5 water horsepower-hours per acre-inch. The Nebraska Pumping Plant Performance Criteria give the work a well-maintained plant gets from each fuel. They are 12.5 per gallon of diesel, 0.885 per kWh, 61.7 per thousand cubic feet of natural gas and 6.89 per gallon of propane (UNL CropWatch, Apr 20, 2007; Dorn, 2007).
| Energy source and price | Energy cost per acre-inch* | |
|---|---|---|
| Diesel, $5.50/gal (Iowa farm, Sep 18) | $10.35 | ██████████ |
| Diesel, $4.00/gal (2027 curve estimate) | $7.53 | ███████ |
| Diesel, $2.70/gal (UNL 2026 budget) | $5.08 | █████ |
| Propane, $1.48/gal (Iowa distributor, Sep 18) | $5.05 | █████ |
| Electricity, 16.13¢/kWh (high end of UNL survey) | $4.29 | ████ |
| Natural gas, $8.99/Mcf (NE commercial, Jun 2026) | $3.43 | ███ |
| Electricity, 12¢/kWh (UNL 2026 budget) | $3.19 | ███ |
| Electricity, 7.3¢/kWh (low end of UNL survey) | $1.94 | ██ |
| Natural gas, $4.37/Mcf (NE industrial, Jun 2026) | $1.67 | ██ |
Source: Crop Root Zone calculation using UNL CAP 2026 Nebraska Crop Budgets (125 ft lift, 35 psi, electric rate survey); Nebraska Pumping Plant Performance Criteria, whp-h per unit of energy, as tabulated in Dorn (2007), Table 1 (Kranz et al., UNL CropWatch, Apr 20, 2007, for the head formula); USDA AMS Iowa Production Cost Report, Sep 18, 2026; EIA Nebraska natural gas prices, monthly through Jun 2026. Bars scaled to cost, longest = ten blocks. *Estimates. Energy only, at criteria performance. Excludes lube, demand and fixed charges, and engine or motor ownership. A plant that performs below the criteria uses more energy on every row alike.
On a 10-inch season, the difference between a diesel well at September's price and an electric well at UNL's rate is about $72 an acre. That equals about 15 bushels at $4.85.
Ground Truth: For 2027 irrigated corn, the input decision worth the most time this fall is the fuel contract, not the fertilizer prepay. On a diesel pivot the gap between $4.00 and $5.50 diesel is $42 an acre in pumping alone. The gap between September's UAN32 price and the budget's is $4. The futures curve prices July 2027 diesel $1.47 under October. A grower can therefore lock part of the summer's pumping fuel against that curve, as TRZ-0228 set out for spring gallons. That captures the relief the market already expects, without betting on more. The nitrogen decision on these acres is about form, not price. Fertigated UAN at $0.72 costs about $28 more for 200 pounds of N than DTN's $0.58 anhydrous. That premium buys the ability to cut the last in-season doses if the crop or the corn price falls short.
4. Irrigated against dryland on the same ground
What's new: On central Nebraska ground, the electric pivot adds about $342 an acre over dryland above operating cost at $4.85. For a tenant paying the district's $150 rent premium for irrigated land, the gain is $193. The diesel pivot adds $233 over operating cost at $4.00 diesel. For a tenant at $5.50 diesel, the gain is $3.
Evidence: We compare each pivot budget with UNL's statewide dryland budget, 145 bushels no-till after soybeans, repriced the same way. Central district rents fit that comparison: $270 for pivot ground, $120 for dryland.
| Pivot budget vs. dryland (#23, 145 bu), central Nebraska | Extra bushels | Extra revenue* | Extra operating cost* | Extra return over operating* | Extra rent | Extra return, tenant* | Tenant cost per extra bushel* |
|---|---|---|---|---|---|---|---|
| #33 Electric pivot, 275 bu | 130 | 630.83 | 288.52 | +342.31 | 150 | +193.25 | $3.37 |
| #37 Diesel pivot, 245 bu, $4.00 diesel | 100 | 485.25 | 252.61 | +232.64 | 150 | +48.59 | $4.37 |
| #37 Diesel pivot, 245 bu, $5.50 diesel | 100 | 485.25 | 298.40 | +186.85 | 150 | +2.80 | $4.82 |
Source: Crop Root Zone calculation from UNL CAP 2026 Nebraska Crop Budgets #23, #33, #37; UNL 2026 Nebraska Farmland Values and Cash Rental Rates (preliminary), Mar 18, 2026; USDA AMS, Sep 29, 2026; DTN/Progressive Farmer, Sep 23, 2026; USDA AMS Iowa Production Cost Report, Sep 18, 2026. $/acre. *Estimates at $4.85 cash corn. The last column is the difference in tenant total cost divided by the extra bushels. It includes rent, UNL's $8 higher overhead for irrigated ground, and the machinery and irrigation operating costs. Pivot ownership is excluded because the rent assumes the landlord owns the system.
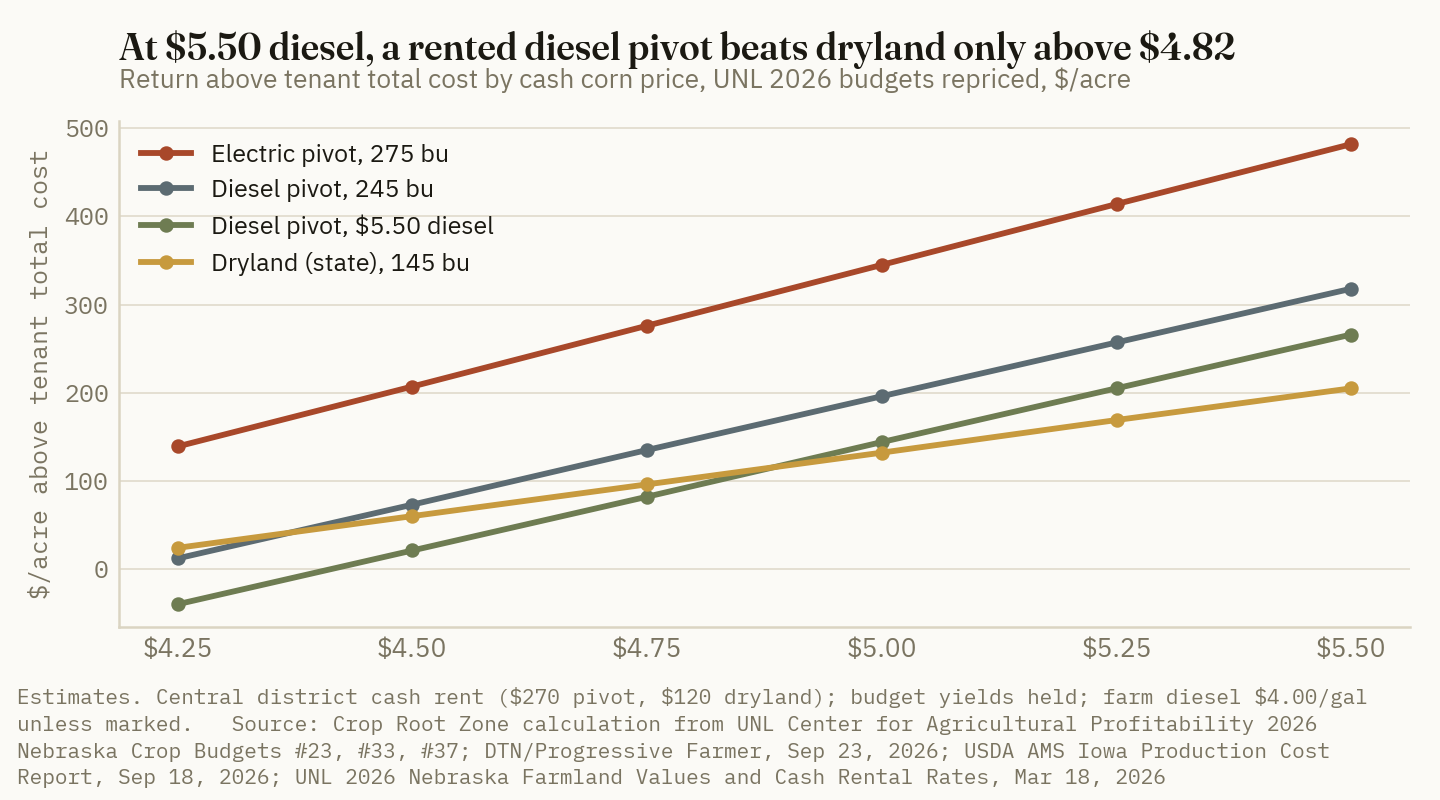
Above operating cost, every pivot budget beats dryland by $187 or more, even at $5.50 diesel. Full cost is where the diesel pivot falls behind. UNL's owner basis charges $188 more a year for irrigated land than for statewide dryland. On that basis the electric pivot leads dryland by $94 an acre, and the diesel pivot trails it by $53 at $4.00 diesel and $99 at $5.50. The tenant's view shows where the diesel problem lands. The rent premium for irrigated ground is fixed. It was set last winter, when corn was lower and Midwest diesel was a little over half today's price. Extra bushels from a rented diesel pivot cost $4.37 each at the planning price and $4.82 at September's. The board is offering $4.85.
The eastern comparison is tighter still, and it cuts the other way. UNL's eastern dryland budget plans 195 bushels. East district dryland rents for $220 and pivot ground for $335, a $115 premium. A tenant already clears $207 an acre above full cost on eastern dryland at $4.85. A pivot there has to find its return in fewer, larger yield gains in dry years, not in the average-year budget.
Ground Truth: At 2027 prices the pivot is not in question in central Nebraska. The lease terms on diesel-powered ground are. A tenant renting a diesel pivot at the district's $270 is carrying the fuel risk on an irrigation system the landlord owns and priced into the rent. At $5.50 diesel, all of the irrigation margin over dryland goes to the landlord and the fuel supplier. Two lease terms are worth raising before March 1. One is a fuel-price escalator that shares pumping cost above a base price, such as the $2.70 the rent was set against. The other is a conversion clause: if the landlord brings three-phase power to the well, the rent steps up by an agreed share of the energy saving. Converting a well carries its own capital cost, which UNL does not budget. On a 10-inch season, the energy table puts the saving at $43 an acre at $4.00 diesel and $72 at $5.50, before the utility's fixed or demand charges. UNL carries those at $52 an acre in its alfalfa budgets. Energy saved, less that charge, is the number to start from in pricing the conversion and the rent step-up.
5. What sets the 2027 number, and when
What's new: Every input to this repricing will move before spring. Three are dated.
Evidence:
- Harvest results and October reports. NASS updates Nebraska's 177-bushel forecast in its October Crop Production report. A lower irrigated result this year will not change the 2027 budget. It will change what lenders and landlords treat as a normal pivot yield. The electric pivot's 28-bushel cushion is a statement about that yield.
- The 2027 UNL budgets. UNL presented its 2026 set in a January 8, 2026 webinar, with inputs priced the previous August to October (UNL MediaHub, Jan 8, 2026). If the 2027 set follows the same pattern, its inputs will be priced around this fall's harvest. If UNL moves its diesel price toward today's farm quotes, the published diesel pivot budget will show the loss that the 2026 budget cannot.
- The winter rent market. UNL's March 2026 survey had pivot rents down 1% to 6% across districts, with respondents citing low crop prices and high input costs (UNL, Mar 18, 2026). Corn has since risen more than $1 at central Nebraska elevators, year on year. The 2027 survey will show whether landlords price in the corn rally or the fuel cost.
Two items without a date carry the most weight. The first is the diesel curve. Our $4.00 planning price assumes July 2027 ULSD stays about $1.47 under the October contract, and that farm diesel follows. The second is basis. Central Nebraska's 37-cent midpoint is a harvest basis in a short-crop year. Each 10 cents of basis moves the pivot budgets by $25 to $28 an acre.
Ground Truth: For the owner-operator on an electric pivot, 2027 corn is the least complicated call in this set. It needs $4.38 cash against a $4.85 board and 247 bushels against a 275-bushel plan. The fuel, rent and basis questions that decide the other budgets barely touch it. The acre to plan carefully is the rented diesel pivot. There, full cost depends on diesel falling roughly as the futures curve says it will. The practical sequence is to contract part of the summer's fuel, open the rent conversation early, and price corn only once the fuel cost is fixed. A tenant who sells 2027 corn at $5.22 on the board but buys summer diesel at September's price has locked in a thin margin.
References
- University of Nebraska-Lincoln, Center for Agricultural Profitability (G. McClure et al.), 2026 Nebraska Crop Budgets, budgets #23 (Corn, Dryland (State), No Till, after Beans), #24 (Corn, Dryland, No Till after Soybeans, Eastern Nebraska), #33 (Corn, Irrigated-Electric Pivot, No Till, after Beans), #37 (Corn, Irrigated-Diesel Pivot, Conv Till after Beans); methodology, Table 4 input prices and Irrigation Energy Costs section; input prices collected Aug–Oct 2025 — https://cap.unl.edu/sites/unl.edu.ianr.agecon.center-for-ag-profitability/files/media/file/2026-nebraska-crop-budgets.pdf
- USDA Agricultural Marketing Service, Livestock, Poultry and Grain Market News, Nebraska Daily Elevator Grain Bids, Sep 29, 2026 (CBOT settlements incl. Dec 2027 corn 522.25¢; district corn basis and year-ago averages) — https://mymarketnews.ams.usda.gov/viewReport/3225
- DTN/Progressive Farmer, "Fertilizer Prices Rise for Six of Eight Major Fertilizers," Sep 23, 2026 (retail survey Sep 14–18, 2026) — https://www.dtnpf.com/agriculture/web/ag/crops/article/2026/09/23/fertilizer-prices-rise-six-eight
- USDA Agricultural Marketing Service, Iowa Production Cost Report (Bi-Weekly), week ending Sep 18, 2026 (farm diesel, propane, anhydrous, UAN32) — https://mymarketnews.ams.usda.gov/viewReport/2863
- USDA Agricultural Marketing Service, Illinois Production Cost Report (Bi-Weekly), week ending Sep 18, 2026 (farm diesel) — https://mymarketnews.ams.usda.gov/viewReport/3195
- U.S. Energy Information Administration, Midwest (PADD 2) No. 2 Diesel Retail Prices, weekly, released Sep 29, 2026 — https://www.eia.gov/dnav/pet/hist/LeafHandler.ashx?n=PET&s=EMD_EPD2D_PTE_R20_DPG&f=W
- CME Group NYMEX NY Harbor ULSD (HO) futures, Oct 2026 – May 2028 contracts, as displayed by Farmbucks, Sep 30, 2026, 08:08 CT, delayed — https://farmbucks.com/futures/energy/ulsd
- J. Jansen, "2026 Nebraska Farmland Values and Cash Rental Rates" (preliminary), CAP Series 26-0302, Center for Agricultural Profitability, University of Nebraska-Lincoln, Mar 18, 2026 — https://cap.unl.edu/sites/unl.edu.ianr.agecon.center-for-ag-profitability/files/media/file/ne-farm-real-estate_2026_prelim.pdf
- USDA National Agricultural Statistics Service, September Crop Production, Agricultural Statistics Board Briefing, Sep 11, 2026 — https://www.nass.usda.gov/Newsroom/Executive_Briefings/2026/09-11-2026.pdf
- B. Anderson, "Final Nebraska 2026 Corn Belt Yield Model Shows Negative Impact of Late-Season Heat," DTN/Progressive Farmer, Sep 29, 2026 — https://www.dtnpf.com/agriculture/web/ag/blogs/ag-weather-forum/blog-post/2026/09/29/final-nebraska-2026-corn-belt-yield-2
- W. Kranz, D. Martin, C. D. Yonts, S. Irmak, S. van Donk and T. Dorn, "Comparing Fuel Sources for Irrigation," UNL CropWatch, Apr 20, 2007 — https://cropwatch.unl.edu/comparing-fuel-sources-irrigation
- T. W. Dorn, "Using Your Records to Locate Inefficient Pumping Plants," Central Plains Irrigation Conference, 2007 (Nebraska Pumping Plant Performance Criteria by energy source) — https://irrigationtoolbox.com/ReferenceDocuments/TechnicalPapers/CPIA/2007/Dorn07.pdf
- U.S. Energy Information Administration, Nebraska Natural Gas Industrial Price and Price Sold to Commercial Consumers, monthly, through Jun 2026 — https://www.eia.gov/dnav/ng/hist/N3035NE3m.htm ; https://www.eia.gov/dnav/ng/hist/N3020NE3m.htm
- Nebraska Revised Statutes §2-3226.05, natural resources district occupation tax on irrigated acres — https://nebraskalegislature.gov/laws/statutes.php?statute=2-3226.05
- University of Nebraska-Lincoln, "2026 Nebraska Crop Production Cost Estimates and Planning Tools," webinar, Jan 8, 2026, MediaHub — https://mediahub.unl.edu/media/26064
Disclosures
Crop Root Zone is an independent publication. Nothing here is investment advice. Market calls, where included, reflect the editors' own read and are not a recommendation to buy or sell any security.
A Dryland High Plains Cotton Acre Needs 446 Pounds at 2027 Prices. It Still Beats Sorghum and Wheat on the Same Ground.
We repriced Texas A&M's 2026 South Plains budgets to a December 2027 cotton settlement of 79.66 cents, less West Texas spot basis, and to September retail fertilizer. At about 72 cents lint, dryland cotton covers its variable costs above 293 pounds and its full cost above 446. Pivot cotton needs 1,113 pounds for full cost. Only drip cotton clears full cost at its budget yield. Fertilizer repricing adds $0 to $3.19 an acre to cotton, against $7.69 to $9.96 for irrigated sorghum and wheat. On every class of ground, cotton returns the most above variable cost: $70 dryland against $13 for sorghum and $28 for wheat, and $131 under a pivot against a loss for sorghum.
December 2027 cotton settled at 79.66 cents a pound on Monday, September 28 (USDA AMS, Daily Spot Cotton Quotations, Sep 28, 2026). That is about 3 cents under the December 2026 contract (82.86) and about 8 cents under July 2027 (87.82). The same day, West Texas base-grade spot cotton (color 41, leaf 4, staple 34) was quoted 750 points under December futures. Better West Texas cotton (31-3-36) was quoted 375 under. Texas A&M AgriLife Extension's 2026 South Plains budgets were written in February at 68 cents lint. We repriced them to the 2027 board, to Texas Panhandle grain bids and to September retail fertilizer. For the High Plains cotton acre, the result turns on yield more than on price or fertilizer. At about 72 cents, dryland cotton covers its cash costs at 293 pounds and its full cost at 446. Texas's 2026 crop is forecast at about 350 pounds per planted acre. Cotton still earns more over variable cost than grain sorghum or wheat on every class of ground in the District 2 set.
1. The price deck: what the board says and what the budgets assumed
What's new: Texas A&M's 2026 District 2 budgets, prepared by extension economist Andrew Wright, are the most recent public South Plains budgets. Their fertilizer and grain prices date from February 2026. Wright's March review of the cotton budgets noted that the District 2 dryland budget "assumes no fertilizer is applied." At 68 cents it showed a break-even of $0.54 a pound on variable costs and $0.80 on total costs (Texas A&M AgriLife Extension, Mar 13, 2026).
Evidence: The price inputs have moved since February. Cotton is about 4 cents higher on a harvest-basis estimate. Sorghum and wheat are up much more. Nitrogen is roughly flat, and phosphate and anhydrous are higher.
| Input | Texas A&M D2 budget (Feb 2026) | 2027 planning value | Basis of planning value |
|---|---|---|---|
| Cotton lint, $/lb | 0.68 | 0.72* | Dec 2027 ICE 79.66¢ (Sep 28) less 7.5¢, the West Texas base spot discount |
| Cottonseed, $/ton | 240 | 240 | Held at budget |
| Grain sorghum, $/cwt ($/bu) | 8.02 (4.49) | 8.75 (4.90) | Dec 2027 CBOT corn $5.25 less 35¢, the wide end of South Panhandle bids |
| Wheat, $/bu | 4.91 | 6.74* | Jul 2027 KC HRW $7.5875 less 85¢, the wide end of South Panhandle bids |
| Liquid N, $/lb N | 0.725 | 0.72 | DTN UAN32, Sep 14–18, 2026 |
| Anhydrous, $/lb N | 0.52 | 0.58 | DTN anhydrous, Sep 14–18, 2026 |
| Liquid P (10-34-0), $/lb P₂O₅ | 0.97 | 1.06* | DTN 10-34-0 at $718/ton ÷ 680 lb P₂O₅ |
Source: Texas A&M AgriLife Extension, 2026 District 2 Estimated Costs and Returns per Acre (Feb 2026); USDA AMS Daily Spot Cotton Quotations, Sep 28, 2026; USDA AMS Texas Daily Grain Bids, Sep 28, 2026; DTN/Progressive Farmer, Sep 23, 2026. Fertilizer basis: average U.S. retail, delivered. *Crop Root Zone estimates. Spot basis applies to cotton and grain delivered now. Harvest 2027 basis can be wider or narrower. The 10-34-0 conversion charges the whole product price to phosphate, which is our reading of how the budget's $0.97 was built. At $718 a ton, that is the same method applied to September's price.
The cotton basis deserves a caution. The 750-point discount is a spot quotation for base-grade cotton in late September, before most of the High Plains crop has been stripped. The AMS weekly review reported ginning was expected to start the first week of October (USDA AMS, Weekly Cotton Market Review, Sep 25, 2026). A grower whose cotton grades 31-3-36 was quoted 375 under, worth about 3.75 cents more. We use 72 cents as a central case and show 68 and 80 alongside it.
USDA's September outlook put the 2026/27 upland season-average farm price at 78 cents, up from 62 cents for 2025/26. It cut projected U.S. ending stocks 10% to 3.6 million bales (USDA ERS, Cotton and Wool Outlook, Sep 15, 2026). The deferred board is lower. December 2027 trades below the 2026/27 contracts, so the market is pricing next year's crop under this year's.
2. Cotton's three High Plains acres, repriced
What's new: At 72 cents, the repriced drip budget covers full cost at its planned yield. The dryland and pivot budgets do not. All three cover their variable costs.
Evidence: Harvest and ginning costs scale with the crop. The budgets charge 12 cents a pound of lint to strip and module, $3.25 per hundredweight of seed cotton to gin, and a $4-per-bale boll weevil assessment. Cottonseed income runs at about 17 cents per pound of lint at $240 a ton. We let those four lines move with yield and held everything else at the budget. That gives break-even yields at each price.
| D2 budget (2026) | Planned lint, lb | Variable cost, repriced* | Total cost, repriced* | Return above variable at 72¢* | Return above total at 72¢* | Break-even lint, variable* | Break-even lint, total* | Break-even price at planned yield, total* |
|---|---|---|---|---|---|---|---|---|
| Dryland, herbicide-tolerant | 400 | 285.91 | 386.16 | +70.25 | −30.00 | 293 | 446 | 79.5¢ |
| Center pivot | 1,000 | 759.74 | 964.99 | +130.66 | −74.59 | 802 | 1,113 | 79.5¢ |
| Drip | 1,500 | 1,023.88 | 1,279.13 | +311.72 | +56.47 | 1,030 | 1,415 | 68.2¢ |
Source: Crop Root Zone calculation from Texas A&M AgriLife Extension 2026 District 2 cotton budgets (Dryland Cotton – Herbicide Tolerant; Irrigated Cotton – Pivot; Irrigated Cotton – Drip), Feb 2026; DTN/Progressive Farmer, Sep 23, 2026; USDA AMS, Sep 28, 2026. Dollar figures are $/acre. *Estimates. Break-even yields let stripping, ginning, boll weevil assessment and cottonseed income scale with yield. Break-even prices are net of cottonseed income, as in the budgets. Total cost includes the budgets' cash rent ($50 dryland, $100 pivot, $130 drip), a $25 management charge and equipment ownership. Interest and insurance are held at budget.
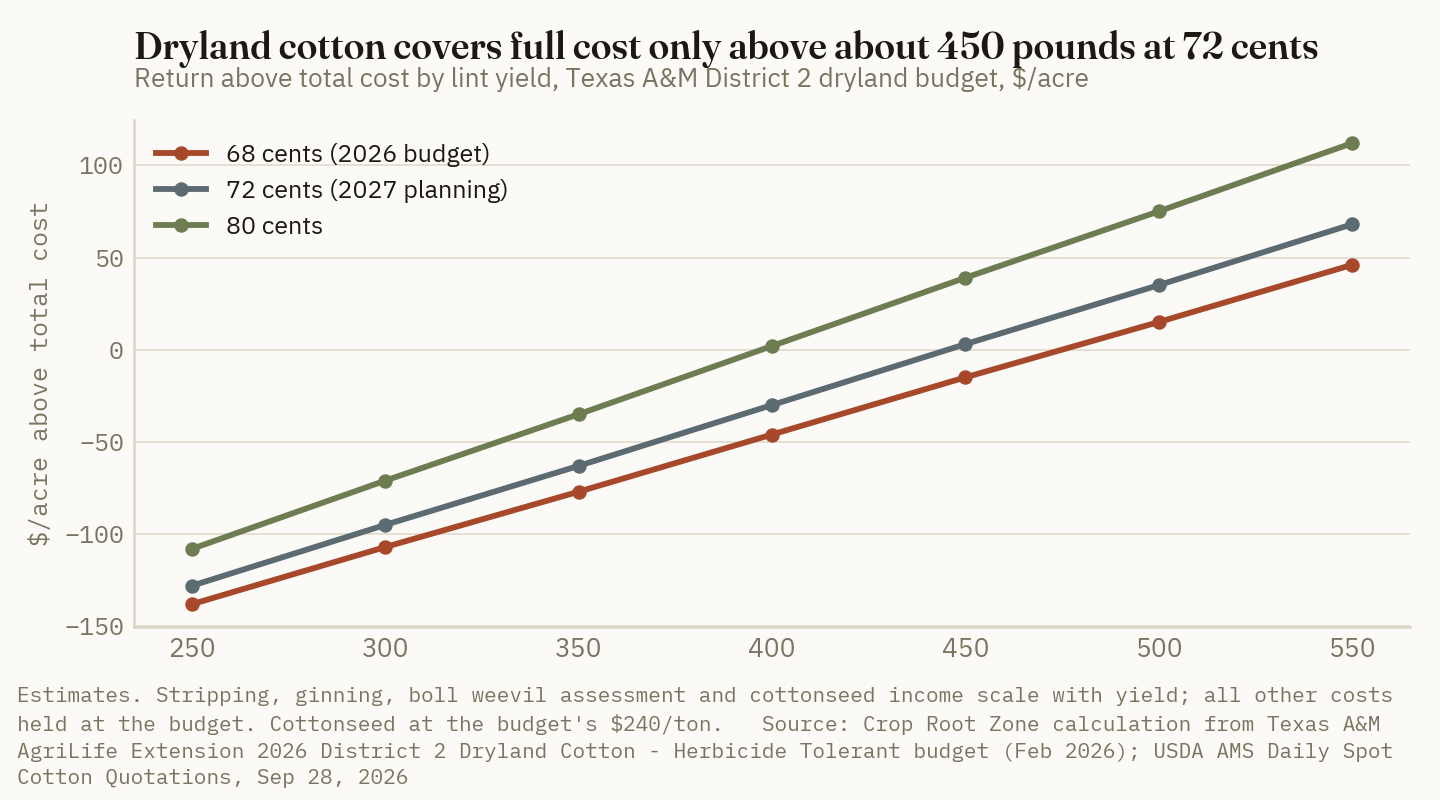
The full-cost break-even price for dryland and pivot cotton is about 79.5 cents in cash. With a 7.5-cent basis, that means a December 2027 board near 87 cents, more than 7 cents above Monday's settlement. The drip acre is the exception. Its 1,500-pound yield spreads the $130 rent and $75 of irrigation equipment ownership over enough lint to break even at 68 cents.
446 pounds
Lint per acre the Texas A&M District 2 dryland cotton budget needs to cover full cost at about 72 cents cash. It needs 293 pounds to cover cash costs. The budget plans on 400. (Crop Root Zone calculation from Texas A&M AgriLife Extension, Feb 2026; USDA AMS, Sep 28, 2026)
The 2026 crop shows what that means in practice. NASS's September forecast put Texas upland planted area at 5.9 million acres and harvested area at 3.9 million, a 34% abandonment rate. The harvested yield was 529 pounds, down from 566 in the August forecast (USDA NASS, Crop Production, Sep 11, 2026). Spread across planted acres, that is about 350 pounds per planted acre, statewide and including irrigated land. In 2025 the same arithmetic gives about 474 pounds (4.0 million harvested of 5.3 million planted, at 628 pounds).
Ground Truth: The dryland acre on the High Plains is a variable-cost crop that sometimes pays full cost. It is not a full-cost crop that sometimes misses. At 72 cents, 293 pounds covers the cash. That is below what Texas averaged per planted acre even in a 34%-abandonment year. The 446 pounds needed for full cost is above what the state produced per planted acre in 2026, and only about 30 pounds under 2025. For a landowner-operator who already carries the rent and machinery, the 2027 dryland decision rests on the $70 margin over cash costs. For a tenant paying $50 cash rent on land that averages in the 300s, the number to negotiate is the rent, not the fertilizer bill. Each $10 of rent moves the full-cost break-even by about 15 pounds.
3. Fertilizer is the smallest lever in the High Plains cotton budget
What's new: Retail nitrogen has barely moved since the budgets were set. UAN32 was $0.72 per pound of N in mid-September, against the budget's $0.725. Anhydrous and phosphate are up about 9–12%. Because cotton uses little of either, the September repricing adds nothing to dryland cotton and $1.70 to $3.19 an acre to irrigated cotton (DTN/Progressive Farmer, Sep 23, 2026).
Evidence: Across the seven District 2 budgets we repriced, fertilizer's share of total cost ranges from zero to about a fifth. Cotton sits at the bottom of that range.
| D2 budget, repriced | Fertilizer, $/ac* | Change from Feb budget* | Share of total cost* | |
|---|---|---|---|---|
| Irrigated wheat (90 lb NH₃-N, 50 lb liquid N, 56 lb P₂O₅) | 147.33 | +9.96 | 20.9% | ██████████ |
| Irrigated sorghum (60 lb NH₃-N, 40 lb liquid N, 50 lb P₂O₅) | 116.39 | +7.69 | 18.6% | █████████ |
| Drip cotton (135 lb N, 45 lb P₂O₅) | 144.71 | +3.19 | 11.3% | █████ |
| Pivot cotton (90 lb N, 25 lb P₂O₅) | 91.20 | +1.70 | 9.5% | █████ |
| Dryland sorghum (30 lb N) | 21.60 | −0.15 | 8.8% | ████ |
| Dryland wheat (30 lb N) | 21.60 | −0.15 | 8.8% | ████ |
| Dryland cotton (none budgeted) | 0.00 | 0.00 | 0.0% |
Source: Crop Root Zone calculation from Texas A&M AgriLife Extension 2026 District 2 budgets (Feb 2026) and DTN/Progressive Farmer retail survey, Sep 14–18, 2026. Bars scaled to share of total cost, longest = ten blocks. Excludes fertilizer application charges. *Estimates; nutrient rates are the budgets' own.
Irrigation energy is a bigger line than fertilizer in every irrigated budget. The pivot cotton budget charges $100 an acre for 10 acre-inches of pumping at $10 an inch, plus $16 of irrigation labor and $19 of system repairs. That is $135 of water cost against $91 of fertilizer. The drip budget charges $140 for 14 inches. Both show harvest and ginning as the largest variable cost: $222 an acre under the pivot and $328 under drip. Cottonseed income offsets about 72% of dryland stripping and ginning costs at $240 a ton. That makes the cottonseed price a larger fertilizer-equivalent than fertilizer itself. Each $30 a ton on cottonseed is worth about $8.50 an acre on the dryland budget and $21 on the pivot.
The dryland budget's zero-fertilizer assumption is a choice. It is not a finding. A grower who applies 30 pounds of N as UAN32 at $0.72, plus the budget's $4.75 application charge, spends about $26 an acre. At 72 cents that raises the full-cost break-even by about 40 pounds of lint, from 446 to about 486.
Ground Truth: Fertilizer cost is not what is holding back a High Plains cotton acre this fall. On the irrigated budgets, a 10% cut in nitrogen rate saves $6 to $10 an acre. The same 10% on yield costs $66 of revenue net of harvest costs on a 1,000-pound pivot acre. The fertilizer question for 2027 cotton is a soil-test question. Where a fall soil sample shows residual nitrate left by a failed or low-yielding 2026 crop, cutting the budget's 90 to 135 pounds is justified on agronomy, and the savings follow. Where the sample does not show it, rate cuts are false economy at any price on the September board. On dryland, the case for any nitrogen depends on stored soil moisture at planting. The price of UAN has little to do with it.
4. Cotton against sorghum and wheat on the same ground
What's new: Sorghum and wheat bids rose more than cotton since February, in percentage terms. Even so, cotton still earns the most over variable cost on every class of land in the District 2 budgets.
Evidence: Texas Panhandle elevators bid sorghum 20 to 90 cents under December corn on September 28. South Plains feedyards bid 45 to 60 cents over (USDA AMS, Texas Daily Grain Bids, Sep 28, 2026). USDA's September WASDE raised the 2026/27 sorghum season-average price to $4.60 a bushel, from $4.30 in August (USDA WASDE, Sep 11, 2026). We price all three crops at 2027 planning values, with fertilizer repriced. The wheat budgets include Texas A&M's own grazing income: $51 an acre dryland and $102 irrigated, at 75 cents a pound of gain.
| D2 budget, 2027 planning prices | Planned yield | Revenue* | Variable cost* | Return above variable* | Total cost* | Return above total* | Irrigation, acre-in | Return above variable per acre-inch* |
|---|---|---|---|---|---|---|---|---|
| Dryland cotton | 400 lb | 356.16 | 285.91 | +70.25 | 386.16 | −30.00 | — | — |
| Dryland sorghum | 18 cwt (32 bu) | 157.50 | 144.85 | +12.65 | 245.10 | −87.60 | — | — |
| Dryland wheat + grazing | 18 bu | 172.28 | 144.12 | +28.16 | 244.37 | −72.09 | — | — |
| Pivot cotton | 1,000 lb | 890.40 | 759.74 | +130.66 | 964.99 | −74.59 | 10 | 13.07 |
| Irrigated sorghum | 45 cwt (80 bu) | 393.75 | 414.38 | −20.63 | 624.63 | −230.88 | 9 | −2.29 |
| Irrigated wheat + grazing | 60 bu | 506.25 | 500.11 | +6.14 | 705.36 | −199.11 | 14 | 0.44 |
| Drip cotton | 1,500 lb | 1,335.60 | 1,023.88 | +311.72 | 1,279.13 | +56.47 | 14 | 22.27 |
Source: Crop Root Zone calculation from Texas A&M AgriLife Extension 2026 District 2 budgets (Feb 2026); USDA AMS Daily Spot Cotton Quotations and Texas Daily Grain Bids, Sep 28, 2026; DTN/Progressive Farmer, Sep 23, 2026. $/acre. *Estimates at 72¢ lint, $4.90/bu sorghum and $6.74/bu wheat, with fertilizer repriced and all other lines at budget. Cash rent within each land class is the same for every crop in the budgets.
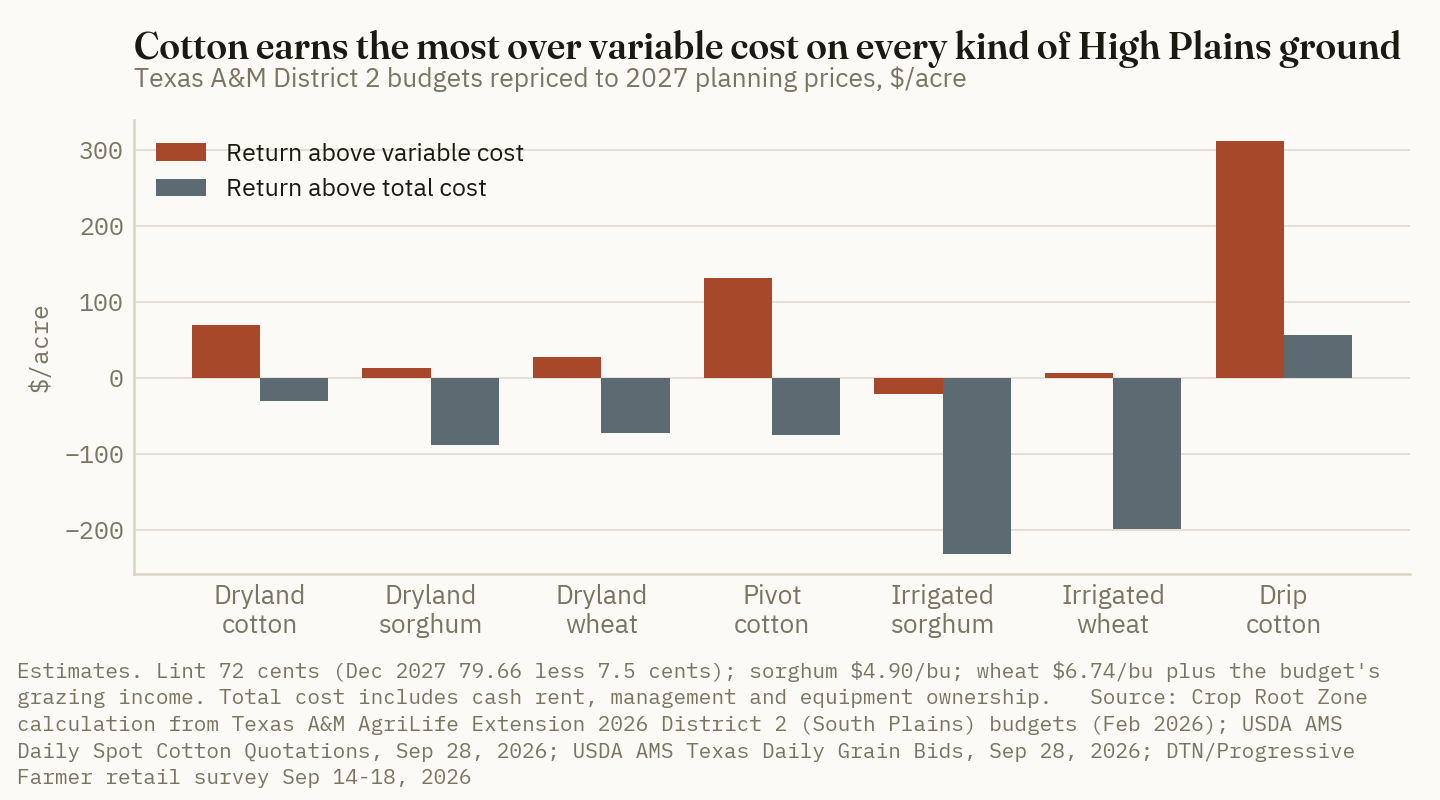
The price move helped the grains more. Sorghum is up 9% on the budget and wheat 37%, against 6% for cotton lint. Dryland sorghum went from −$0.68 over variable cost at budget prices to +$12.65. Dryland wheat went from −$4.86 to +$28.16. Irrigated wheat went from −$93.43 to +$6.14. Cotton still leads because its per-acre gross is much larger than its cost gap. A 400-pound dryland cotton acre grosses $356 against $158 for 32 bushels of sorghum. Cash rent, management and equipment ownership are charged at the same rate for every crop on a given class of land, so the ranking above variable cost carries through to total cost.
The water column matters more each year on the Ogallala. Under a pivot, cotton earns about $13 over variable cost per acre-inch pumped. Sorghum loses about $2, and wheat roughly breaks even.
Ground Truth: Higher grain prices do not make 2027 a year to switch High Plains ground out of cotton. What they change is the second crop. A 32-bushel dryland sorghum acre that lost money over cash costs in February now covers them, so sorghum is a sound replant option where cotton fails. It is not a better first choice. The acres where the answer could change are limited-water pivots. Irrigated sorghum at 80 bushels still loses $21 over variable cost at $4.90. But it uses an inch less water than cotton and carries about $345 less in variable costs per acre. A grower short on pumping capacity for a full cotton program should weigh those numbers alongside the budget ranking.
5. What sets the 2027 number, and when
What's new: The crop-insurance price that will anchor many 2027 cotton plans has not been set yet. Under RMA's cotton price provisions, Texas's projected price is the average December-futures settlement over one of three windows, depending on the county's sales closing date: December 15–January 14 (January 31 closing), January 15–February 14 (February 28 closing), or February 1–28 (March 15 closing) (USDA RMA, Commodity Exchange Price Provisions – Cotton, 23-CEPP). Monday's 79.66 cents is only an indication of where that price might land.
Evidence: Texas A&M cotton marketing economist John Robinson wrote on September 10 that the December 2027 corn-to-cotton price ratio was consistent with about 10.4 million U.S. cotton acres in 2027. That compares with 10.5 million planted in 2026 (Texas A&M AgriLife Extension, Cotton Marketing Planner, Sep 2026; USDA NASS, Sep 11, 2026). On September 28 settlements, the ratio stood at about 6.6 ($5.25 corn ÷ 79.66¢ cotton). Robinson also cautioned that a low-abandonment year, such as followed past El Niño seasons, could add several million bales to carryover.
Three dated items will move the High Plains number before the budgets are rewritten:
- The 2026 High Plains harvest. Ginning was projected to start in early October (USDA AMS, Sep 25, 2026). PCCA reported that late-September rain in West Texas arrived "too late to add much to yield" and could raise quality concerns (PCCA Cotton QuickTake, Sep 28, 2026). Grades matter here, because the 31-3-36 spot quote sits 3.75 cents above base.
- USDA's October Crop Production and WASDE reports. A further cut to Texas's 529-pound harvested yield would confirm that the 2026 planted-acre figure is closer to 350 pounds than 400.
- The 2027 Texas A&M budgets. Texas A&M says its enterprise budgets are updated each year by January 31. The 2027 set will reset cash rent, insurance premiums and custom harvest rates. Those lines have more bearing on the dryland break-even than fertilizer does.
Ground Truth: For the dryland High Plains grower, the 2027 cotton plan is a two-number check. Does the field's own planted-acre history clear about 293 pounds, the cash break-even at 72 cents? And will the insurance price, set this winter, support a guarantee above cash costs? If both hold, cotton is still the High Plains crop, and a rally in December 2027 toward the high 80s would put full cost in reach. If the field's record sits in the 200s, the grain rally has made sorghum the better planned crop there, not just the replant crop, because sorghum's cash costs are about half of cotton's.
References
- USDA Agricultural Marketing Service, Cotton and Tobacco Market News, Daily Spot Cotton Quotations, Vol. 109 No. 40, Sep 28, 2026 (ICE futures settlements incl. Dec-27 79.66¢; West TX-KS-OK spot quotations) — https://www.ams.usda.gov/mnreports/ams_3804.pdf
- USDA Agricultural Marketing Service, Weekly Cotton Market Review, Vol. 108 No. 8, Sep 25, 2026 — https://www.ams.usda.gov/mnreports/cnwwcmr.pdf
- USDA AMS Livestock, Poultry and Grain Market News, Texas Daily Grain Bids, Sep 28, 2026 — https://www.ams.usda.gov/mnreports/ams_2711.pdf
- Texas A&M AgriLife Extension (A. Wright), 2026 Estimated Costs and Returns per Acre, South Plains Extension District 2: Dryland Cotton – Herbicide Tolerant; Irrigated Cotton – Pivot; Irrigated Cotton – Drip; Dryland Sorghum; Irrigated Sorghum; Dryland Wheat; Irrigated Wheat; Feb 2026 — https://agecoext.tamu.edu/resources/crop-livestock-budgets/budgets-by-extension-district/district-2-south-plains/2026-district-2-texas-crop-and-livestock-budgets/
- A. Wright, "Cotton Costs and Returns in 2026," Ag Economics on the Plains, Texas A&M AgriLife Extension, Mar 13, 2026 — https://agrilife.org/agecon/cotton-costs-and-returns-in-2026/
- DTN/Progressive Farmer, R. Quinn, "Fertilizer Prices Rise for Six of Eight Major Fertilizers," Sep 23, 2026 (retail survey Sep 14–18, 2026) — https://www.dtnpf.com/agriculture/web/ag/crops/article/2026/09/23/fertilizer-prices-rise-six-eight
- USDA National Agricultural Statistics Service, Crop Production, Sep 11, 2026 — https://esmis.nal.usda.gov/sites/default/release-files/796056/crop0926.pdf
- USDA Economic Research Service, L. Meyer and T. Dew, Cotton and Wool Outlook: September 2026, CWS-26i, Sep 15, 2026 — https://www.ers.usda.gov/publications/115566
- USDA World Agricultural Outlook Board, World Agricultural Supply and Demand Estimates, WASDE-676 (September 2026), Sep 11, 2026 — https://www.usda.gov/oce/commodity/wasde/wasde0926.pdf
- USDA Risk Management Agency, Commodity Exchange Price Provisions, Section II – Cotton (23-CEPP-0021) — https://www.rma.usda.gov/sites/default/files/crop-policies/Commodity-Exchange-Price-Provisions---Cotton-23-CEPP.pdf
- J. R. C. Robinson, "2027/28 Fundamentals, Outlook, and Caveats," The Cotton Marketing Planner, Texas A&M AgriLife Extension, Sep 2026 — https://cottonmarketing.tamu.edu/newcrop-fundamentals-outlook-and-caveats/
- PCCA, Cotton QuickTake, Sep 28, 2026 — https://pcca.com/publications/cotton-quicktake/
- Texas A&M AgriLife Extension, Extension Agricultural Economics, Texas Crop and Livestock Budgets (update schedule) — https://agecoext.tamu.edu/resources/crop-livestock-budgets/
Disclosures
Crop Root Zone is an independent publication. Nothing here is investment advice. Market calls, where included, reflect the editors' own read and are not a recommendation to buy or sell any security.
An Extra Mile to a Better Bid Costs 0.4 to 0.5 Cents a Bushel at $6.53 Diesel. An Extra Hour in the Dump Line Costs 3 to 12 Cents, and Iowa's $1 Soybean Premium Had a Delivery Date of October 2.
Iowa's and USDA's surveys both price a grain haul as a 9-to-12-cent stop charge plus a marginal mile. Repriced to $6.53 diesel, 10 cents of basis buys 20 to 25 extra miles, and a half-hour longer line on a hired truck takes 14 back.
Soybean processors in Iowa were bidding $1 a bushel over November futures last week, and one crush plant at Council Bluffs paid that for beans delivered by Oct 2 while bidding 25 under for October–November (USDA AMS, Oct 1, 2026) [1]. Iowa country elevators averaged 59 under on Oct 2, the day a state market reporter noted "a single large company dropping soybean basis by over 60" (USDA AMS, Oct 2, 2026) [2]. A spread that wide pays for a very long haul. It also lasted days. Midwest on-highway diesel was $6.526 a gallon in the week of Sep 28, down 15.4 cents on the week and $2.795 above a year earlier (EIA, Sep 29, 2026) [5]. This piece prices two things at that fuel cost: the extra mile and the extra hour. Our Sep 23 feature repriced the truck surveys for diesel and used the average 100-mile rate as the cost of a mile (Crop Root Zone, TRZ-0224, Sep 23, 2026) [15]. Here we separate the stop from the mile, build the farm semi's own cost, and put a number on the dump line, which that piece left out.
1. The October 2 bid sheet: wide spreads, one of them dated
What's new: Rain has held Iowa's soybean harvest to 3% complete against a 17% five-year average, and corn to 5% against 10% (USDA NASS, Sep 28, 2026) [13]. Iowa crushers have taken beans in by rail to cover the gap (USDA AMS, Oct 1, 2026) [1]. Illinois is ahead of normal at 26% on corn and 21% on soybeans (USDA NASS, Sep 28, 2026) [13], and its spreads are ordinary harvest spreads.
Evidence: The table reads the three USDA bid reports for the same day. All bids are delivered by truck, current delivery.
| Delivery point, Oct 2 | Corn basis vs Dec (¢/bu) | Soybean basis vs Nov (¢/bu) |
|---|---|---|
| Iowa country elevators, state average | −43 | −59 |
| Southeast Iowa country elevators | −48.0* | −72.5* |
| Southwest Iowa country elevators | −41.0* | −60.4* |
| Council Bluffs terminal elevators | −27.5* | −58 |
| Iowa East ethanol plants | −23.5* | n/a |
| Iowa mills and processors | n/a | 0 to +125 (+67.0*) |
| Central Illinois country elevators | −36 | −34 |
| West Illinois country elevators | −44.3* | −52.0* |
| Central Illinois processors | −20.0* | −14.6* |
| Chicago processors (corn), terminals (soybeans) | −2.5* | −5.0* |
| Mississippi River barge loaders (Illinois side) | −28 | −3 |
| North Illinois River barge loaders | −35.3* | −27.2* |
Source: USDA AMS, Iowa Daily Cash Grain Bids, Illinois Grain Bids and National Daily Ethanol Report, all Oct 2, 2026. Basis: delivered by truck, current delivery; Dec corn settled at $4.9775 and Nov soybeans at $12.7825 on Oct 2. *Crop Root Zone arithmetic: the report's average price minus the futures settlement. The ethanol report prices against the Oct 1 settlement of $5.0225.
Corn offers 13 to 25 cents for leaving the country elevator: 13.5 from southwest Iowa to Council Bluffs, 16 from a central Illinois elevator to a central Illinois processor, 24.5 from southeast Iowa to an eastern Iowa ethanol plant (USDA AMS, Oct 2, 2026) [2] [3] [4]. The Illinois River pays nothing over the country elevator. The soybean numbers are larger. West Illinois elevators are 49 cents under the Mississippi River barge bid, and the low end of the Iowa processor range is 59 cents over the state's country average.
Ground Truth: The $1 crush bid was a price for a date, not for a place. It bought beans that could arrive by Oct 2 from a state with 3% of its crop cut. The same plant's October–November bid of 25 under is the spread a farm can plan a haul around, and against southwest Iowa elevators at 60 under that is 35 cents. A spot premium that is four times the forward one tells a seller who is short this week. It should move the combine into the driest bean field, not move the truck route. A farm that cannot deliver inside the window should price the forward bid and ask for it in writing.
2. The mile: a stop charge plus 0.4 to 0.5 cents
What's new: Nothing new was published; the surveys have not been read this way. Iowa's 2026 custom rates for trucking grain to market are 13.5 cents a bushel for 5 miles, 20 cents for 25 and 40.5 cents for 100, on an assumed $2.89 diesel (Iowa State University, Mar 2026) [7]. USDA's second-quarter advisory puts the North Central rate at $7.26 a loaded mile for 25 miles, $4.67 for 100 and $3.66 for 200, in a quarter when Midwest diesel averaged $5.34 (USDA AMS, Jul 2026) [11]. Neither is a per-mile price. Both are a fixed charge for stopping plus a much smaller charge for distance.
Evidence: Subtracting one distance from the next isolates the marginal mile. We use a 950-bushel corn load, 53,200 pounds, which is 887 bushels of soybeans.
| Survey | Published rate | Diesel in the survey | Implied stop charge (¢/bu)* | Marginal one-way mile, as surveyed (¢/bu)* | Marginal mile at $6.53 diesel (¢/bu)* |
|---|---|---|---|---|---|
| Iowa custom rates, 2026 | 13.5¢ at 5 mi; 20.0¢ at 25; 40.5¢ at 100 | $2.89 | 11.9 | 0.27 | 0.37–0.43 |
| USDA GTOR, North Central, Q2 2026 | $7.26, $4.67, $3.66 per loaded mile at 25, 100, 200 mi | $5.34 | 9.1 | 0.40 | 0.43–0.45 |
| USDA GTOR, national, Q2 2026 | $7.53, $4.84, $4.09 per loaded mile | $5.34 | 9.4 | 0.42 | 0.45–0.47 |
| Nebraska custom rates, 2026 | 14–15¢ field to local storage, 15 mi or less; 16¢ truck to storage or elevator | $2.93 | n/a | n/a | n/a |
| Kansas custom rates, 2026 | Corn 23.9¢ to 16 mi; soybeans 24.2¢ to 18 mi | not obtained | n/a | n/a | n/a |
Sources: Iowa State University Ag Decision Maker A3-10, Mar 2026; USDA AMS Grain Truck and Ocean Rate Advisory, Q2 2026, Jul 2026; University of Nebraska–Lincoln EC823, Apr 24, 2026; Kansas Department of Agriculture and Kansas State University, 2026; EIA, Sep 29, 2026. Basis: hired truck, one way, 80,000 lb gross. *Crop Root Zone calculations on a 950-bushel load: marginal mile is the 25-to-100-mile difference; stop charge is the short-haul rate less its miles at the marginal rate; repricing adds the change in diesel times two miles driven per loaded mile at 5.0 to 7.6 mpg.
The stop charge is $86 to $113 a load. It pays for filling, scaling, probing, dumping and waiting, and it is owed whether the truck goes 5 miles or 50. The short-haul rates in Nebraska and Kansas, 14 to 24 cents for hauls of roughly 15 miles, are mostly that charge (University of Nebraska–Lincoln, Apr 24, 2026; Kansas Department of Agriculture, 2026) [9] [10]. Neither state gives a usable distance rate. Kansas prints an additional charge of 5.5 cents per bushel per mile for corn beyond 16 miles, which on a 950-bushel load would be $52 a loaded mile. Nebraska's extra-distance charge averages 7 cents a bushel with a most common answer of 1 cent, from 11 reports. We read both as respondents answering different questions and do not use them.
The farm's own semi comes out in the same place. Iowa State's worksheet assumes a used tractor bought for $45,000, a $25,000 trailer, 8,000 miles a year, 5.0 miles per gallon and 50 miles an hour (Iowa State University, Aug 2017) [8]. Ownership costs do not change with the route, so only the operating lines count.
| Operating line | Worksheet, per year (2017) | Per mile driven, 2017 ($)* | Per mile driven, Oct 2026 ($)* | Repriced on |
|---|---|---|---|---|
| Fuel | 4,240 | 0.530 | 1.305 | $6.526 diesel, 5.0 mpg |
| Repairs and maintenance | 3,500 | 0.438 | 0.438 | Not repriced; likely low |
| Tires | 1,120 | 0.140 | 0.140 | Not repriced; likely low |
| Driver | 2,880 | 0.360 | 0.489 | $24.45/hour at 50 mph |
| Total | 11,740 | 1.468 | 2.372 | |
| Per extra one-way mile, round trip | 2.94 | 4.74 | ||
| ¢/bu corn, 950 bu | 0.31 | 0.50 | ||
| ¢/bu soybeans, 887 bu | 0.33 | 0.53 |
Source: W. Edwards, Iowa State University Ag Decision Maker A3-41, Aug 2017, operating-cost lines for the semi example; Iowa State University A3-10, Mar 2026, harvest labor wage; EIA, Sep 29, 2026. Basis: owned farm semi, empty return. *Crop Root Zone calculations: annual lines divided by 8,000 miles; fuel and labor repriced as shown.
The worksheet's own example needs 20.8 cents a bushel to haul 65 miles farther at 2017 prices, or 0.32 cents a mile (Iowa State University, Aug 2017) [8]. At today's diesel the owned truck is 0.50 cents at 5.0 mpg and 0.41 at 7.6. Our Sep 23 piece carried 86 cents a loaded mile for non-fuel operating cost. The full repair and tire lines give $1.16, which is why this figure is a little higher at slightly cheaper fuel.
0.45¢ a bushel
Mid-range cost of one extra one-way mile on a 950-bushel corn load at $6.53 Midwest diesel, hired or owned. Ten cents of basis buys about 22 miles. (Crop Root Zone calculation from USDA AMS GTOR Q2 2026; Iowa State University A3-10 and A3-41; EIA, Sep 29, 2026)
A year ago, with Midwest diesel at $3.731 (EIA, Sep 29, 2026) [6], the owned semi's mile was 0.38 cents, and 10 cents of basis bought 26 miles. It buys 20 now (Crop Root Zone calculation).
Ground Truth: Because the stop charge is paid at either buyer, it cancels out of a route choice made at the field edge. It does not cancel out of a decision to bin now and haul later. Grain that goes to the farm bin and then to a distant buyer makes two stops and passes through an auger. Iowa's survey prices the auger at 8.5 cents a bushel (Iowa State University, Mar 2026) [7]. Add a second stop at 9 to 12 cents and the deferred long haul starts roughly 18 to 20 cents behind a direct one. That is the hurdle for bushels that would otherwise have gone straight to town. For bushels headed to the bin anyway, the hurdle is zero and the later haul is the cheap one.
3. The hour: what the dump line costs
What's new: No public survey reports elevator or plant wait times, so every number in this section is our estimate from sourced unit costs. The units are solid. An idling heavy truck burns about 0.8 gallon an hour (U.S. Department of Energy, Aug 2015) [12]. Iowa's harvest wage averages $24.45 an hour, and its one hourly rate for a truck and driver, for hauling bales, averages $118 from five responses (Iowa State University, Mar 2026) [7]. Nebraska's hourly silage-truck rate averages $150 from three (University of Nebraska–Lincoln, Apr 24, 2026) [9].
Evidence:
| One extra hour at the scale | $/hour | ¢/bu corn, 950 bu* | ¢/bu soybeans, 887 bu* | Equal to extra one-way miles* |
|---|---|---|---|---|
| Owned semi, out of pocket: driver plus idle fuel | 29.67* | 3.1 | 3.3 | 6 |
| Hired truck and driver, Iowa hourly proxy | 118 | 12.4 | 13.3 | 28 |
| Hired truck and driver, Nebraska hourly proxy | 150 | 15.8 | 16.9 | 36 |
| Iowa survey's implied stop charge, whole stop | 113* | 11.9 | n/a | n/a |
Sources: Iowa State University A3-10, Mar 2026; University of Nebraska–Lincoln EC823, Apr 24, 2026; U.S. Department of Energy, Aug 2015; EIA, Sep 29, 2026. *Crop Root Zone estimates. Owned-semi hour is $24.45 wage plus 0.8 gallon at $6.526. Hourly truck rates are for bale and silage hauling and are used as proxies for a grain truck's time. Miles use 0.50¢ for the owned semi and 0.44¢ for hired.
The Iowa stop charge of about $113 a load sits almost exactly on one hour of truck time at $118. That is the cross-check: haulers appear to be charging for roughly an hour per stop. Ten minutes of line is therefore worth about 2 cents a bushel on a hired truck, the same as four and a half miles of road. Most haulers bill by the bushel, not the hour, so the charge arrives indirectly, as a truck that stops answering the phone for the plant with the long line. USDA's survey already scored trucks at 2.90 on a 5-point difficulty scale in the second quarter (USDA AMS, Jul 2026) [11].
On an owned truck the out-of-pocket hour is cheap, 3 cents. The cost is at the combine. We assume a combine delivering 2,300 bushels an hour to the cart, about 11.5 acres an hour of 200-bushel corn, and 30 minutes per load to fill, scale and dump. Both are illustrations.
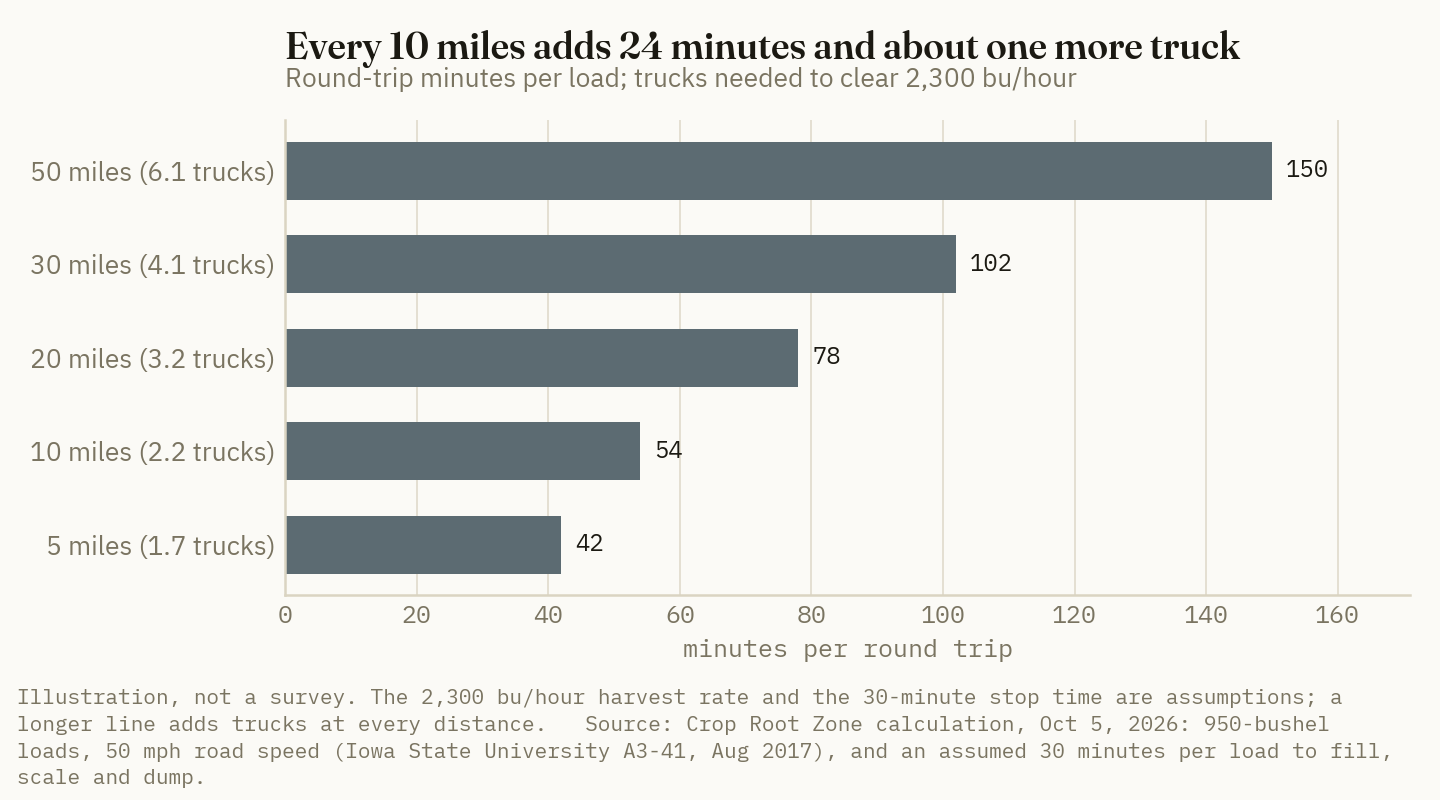
Two trucks keep that combine moving to an elevator 8 miles away. Sent to a plant 30 miles away, the same two trucks deliver about 1,120 bushels an hour, and the combine runs 49% of the time. Iowa's custom combining rate of $46.05 an acre values a combine hour at about $527 (Iowa State University, Mar 2026) [7]. Halving its output adds about 24 cents a bushel at that value, or about 16 cents counting only the 65% of a harvesting charge that Iowa State assigns to depreciation, interest, insurance and repairs (Crop Root Zone estimate). The 22 extra miles cost 10 to 11 cents in truck operating cost. The idle combine costs more than the haul.
Ground Truth: With a fixed fleet, the break-even basis for a longer haul off the combine is roughly two and a half to three times what the mile math says: about 26 to 35 cents for 22 extra miles, not 11. Almost no corn spread on the Oct 2 sheet clears that. The fix is not a better bid. It is a buffer: a bin, a bag or a pile that lets the trucks run the long route at night and after rain while the combine unloads into something that does not drive away. The value of on-farm storage this fall includes the right to take a 20-cent spread that the harvest fleet cannot reach.
4. How far each October 2 spread pays to drive
What's new: Put together, the mile and the hour turn the bid sheet into distances.
Evidence:
| Spread on Oct 2 | Basis gain (¢/bu) | Extra one-way miles, hired* | Owned semi, 5.0 mpg* | Hired, 30 min longer wait* | |
|---|---|---|---|---|---|
| Iowa country → Iowa soybean processors, low end of range | 59.0 | ██████████ |
122–127 | 110 | 111 |
| West Illinois country → Mississippi River, soybeans | 49.0 | ████████░░ |
101–106 | 92 | 89 |
| Southwest Iowa country → Council Bluffs crush, Oct–Nov soybeans | 35.4 | ██████░░░░ |
73–76 | 66 | 61 |
| Central Illinois country → Chicago processors, corn | 33.5 | ██████░░░░ |
74–77 | 67 | 62 |
| Southeast Iowa country → Iowa East ethanol, corn | 24.5 | ████░░░░░░ |
54–56 | 49 | 41 |
| Central Illinois country → central Illinois processors, soybeans | 19.4 | ███░░░░░░░ |
40–42 | 36 | 27 |
| West Illinois country → Mississippi River, corn | 16.3 | ███░░░░░░░ |
36–38 | 33 | 23 |
| Central Illinois country → central Illinois processors, corn | 16.0 | ███░░░░░░░ |
35–37 | 32 | 22 |
| Southwest Iowa country → Council Bluffs terminal, corn | 13.5 | ██░░░░░░░░ |
30–31 | 27 | 16 |
| Central Illinois country → North Illinois River, corn | 0.7 | ░░░░░░░░░░ |
2 | 1 | 0 |
Sources: USDA AMS Iowa Daily Cash Grain Bids, Illinois Grain Bids and National Daily Ethanol Report, Oct 2, 2026; USDA AMS Grain Transportation Report, Oct 1, 2026, for the Council Bluffs October–November crush bid. Gains are differences between regional averages, not bids at named facilities. *Crop Root Zone estimates: gain divided by 0.43–0.45¢ per bushel-mile for corn and 0.46–0.48¢ for soybeans (hired, GTOR North Central marginal mile at $6.53 diesel) or 0.50¢ and 0.53¢ (owned). The last column subtracts half an hour at $118 and uses the mid-range hired mile. Miles are beyond the haul to the nearer buyer.
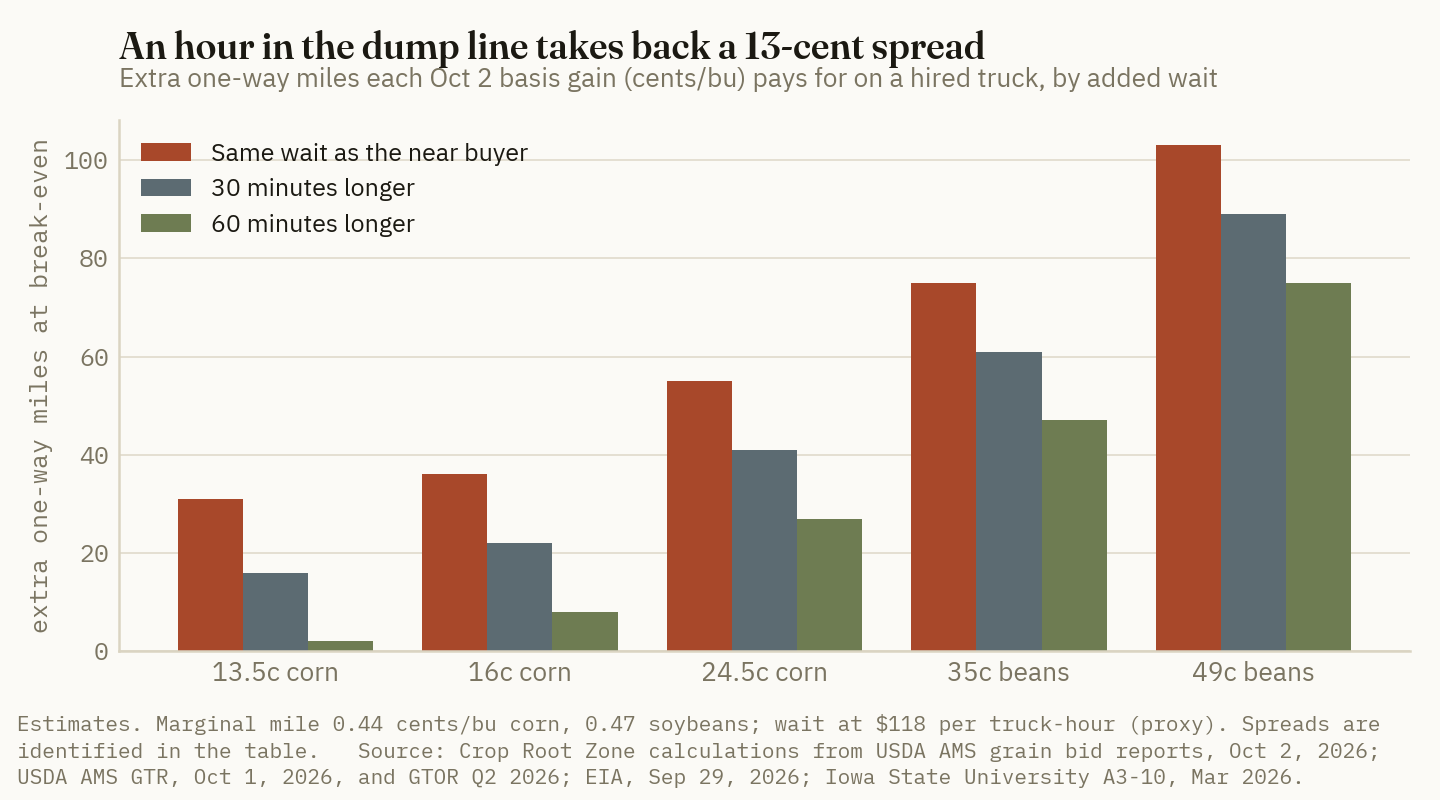
The soybean spreads survive almost any line. Forty-nine cents from western Illinois to the river pays for about 90 miles after a half-hour penalty, and most of that region is closer than that. The corn spreads do not have the same margin. Thirteen to 16 cents pays for 30 to 37 miles with equal lines and 16 to 23 with a half-hour disadvantage. Chicago's 33.5 cents pays for about 75 miles, and most central Illinois elevators are farther from a Chicago processor than that (Crop Root Zone estimate).
Ground Truth: Soybeans should get the long haul and the hired truck this month, and corn should get the short one. A soybean load carries 7% fewer bushels and costs 7% more per bushel-mile, but its spreads are two to three times corn's, and at 3% harvested in Iowa the crushers' need is not finished. When a neighbor says the plant line is an hour, subtract 12 cents from the plant's bid before comparing it with the elevator's.
5. What to watch, and what this does not cover
What's new: Four things move this arithmetic in October.
Evidence: EIA's next weekly diesel release is Oct 6; each 50 cents a gallon moves the marginal mile by 0.014 to 0.021 cents a bushel, or about 1.4 to 2.1 cents on a 100-mile haul (Crop Root Zone calculation from EIA, Sep 29, 2026) [5]. Iowa's 90,000-pound harvest proclamation expires Oct 10 and excludes interstates (Office of the Governor of Iowa, Sep 10, 2026) [14]. At that weight a semi carries about 1,129 bushels of corn and the mile falls to about 0.37 cents (Crop Root Zone calculation). We found no extension posted in the sources we checked by Oct 5. Several states, including Nebraska, Missouri, Indiana and North Dakota, now allow dyed diesel in highway-registered farm trucks, and Missouri, Nebraska, Texas and South Dakota have eased weight limits (USDA AMS, Oct 1, 2026) [1]. We did not price the dyed-fuel saving by state. USDA's third-quarter truck advisory, the first taken at these fuel prices, was due about December when we last reported on it (Crop Root Zone, TRZ-0224, Sep 23, 2026) [15].
Limits. Repair and tire costs are Iowa State's 2017 figures and are probably low. The hourly truck rates are for bales and silage and rest on five and three responses. Stop time, harvest rate and the combine's hourly value are our assumptions. Basis gains compare regional averages on one day, and the Iowa soybean numbers were moving by more than 50 cents within that day. We could not obtain Ohio's 2026 custom rates. The bid a farm is actually quoted, and the line it actually finds, decide the haul.
References
- USDA Agricultural Marketing Service, Grain Transportation Report, Oct 1, 2026 — https://ams-prod.azureedge.us/sites/default/files/media/GTR10012026.pdf
- USDA AMS Livestock, Poultry and Grain Market News, "Iowa Daily Cash Grain Bids" (Report 2850), Oct 2, 2026 — https://www.ams.usda.gov/mnreports/ams_2850.pdf
- USDA AMS Livestock, Poultry and Grain Market News, "Illinois Grain Bids" (Report 3192), Oct 2, 2026 — https://www.ams.usda.gov/mnreports/ams_3192.pdf
- USDA AMS Livestock, Poultry and Grain Market News, "National Daily Ethanol Report" (Report 3617), Oct 2, 2026 — https://www.ams.usda.gov/mnreports/ams_3617.pdf
- U.S. Energy Information Administration, Gasoline and Diesel Fuel Update, week of Sep 28, 2026, released Sep 29, 2026 — https://www.eia.gov/petroleum/gasdiesel/
- U.S. Energy Information Administration, Midwest (PADD 2) No. 2 Diesel Retail Prices, weekly series, released Sep 29, 2026 — https://www.eia.gov/dnav/pet/hist/LeafHandler.ashx?n=PET&s=EMD_EPD2D_PTE_R20_DPG&f=W
- A. Johanns and C. Hart, Iowa State University Extension and Outreach, Ag Decision Maker File A3-10, "2026 Iowa Farm Custom Rate Survey," Mar 2026 — https://www.extension.iastate.edu/agdm/crops/pdf/a3-10.pdf
- W. Edwards, Iowa State University Extension and Outreach, Ag Decision Maker File A3-41, "Estimating Grain Transportation Costs," Aug 2017 — https://www.extension.iastate.edu/agdm/crops/html/a3-41.html
- G. McClure and J. Jansen, University of Nebraska–Lincoln, "2026 Nebraska Agricultural Custom Rates," EC823, Apr 24, 2026 — https://cap.unl.edu/sites/unl.edu.ianr.agecon.center-for-ag-profitability/files/media/file/2026-nebraska-custom-rates-report_ada.pdf
- Kansas Department of Agriculture and Kansas State University Land Use Survey Office, "Kansas Custom Rates 2026," 2026 — https://www.agmanager.info/sites/default/files/pdf/CustomRates_2026.pdf
- USDA Agricultural Marketing Service, Grain Truck and Ocean Rate Advisory, Second Quarter 2026, published Jul 2026 — https://ams-prod.azureedge.us/sites/default/files/media/GTOR2ndQtr2026.pdf
- U.S. Department of Energy, Alternative Fuels Data Center, "Long-Haul Truck Idling Burns Up Profits," prepared by Argonne National Laboratory, Aug 2015 — https://afdc.energy.gov/files/u/publication/hdv_idling_2015.pdf
- USDA National Agricultural Statistics Service, "Crop Progress," week ending Sep 27, 2026, released Sep 28, 2026 — https://release.nass.usda.gov/reports/prog3926.txt
- Office of the Governor of Iowa, "September-October 2026 Harvest Proclamation," Sep 10, 2026 — https://governor.iowa.gov/news/2026-09-10/september-october-2026-harvest-proclamation
- Crop Root Zone, TRZ-0224, "Diesel Added 48 to 73 Cents to Every Loaded Mile of a Grain Haul in a Year. USDA's 100-Mile Truck Rate Added 4, and Midwest Diesel Is Another $1.34 Higher Since," Sep 23, 2026
Disclosures
Crop Root Zone is an independent publication. Nothing here is investment advice. Market calls, where included, reflect the editors' own read and are not a recommendation to buy or sell any security.
Cooling a 30,000-Bushel Corn Bin This Fall Takes About $146 of Electricity. A Point of Shrink Below 15% Costs $1,600, and a Musty Load Costs $3,000.
With a 3-horsepower fan on a 30,000-bushel bin, each cooling cycle takes about 88 hours and 304 kWh. Three cycles cost half a cent a bushel at Iowa's July rate; each 10°F roughly doubles storage life. Shrink and quality discounts run three to thirty times larger.
Corn harvest stood at 17% complete in the 18 major states on Sep 27, with Illinois at 26% against a 17% five-year average (USDA NASS, Sep 28, 2026) [1]. That corn went into bins warm. The Iowa state average cash bid was $4.60 on Oct 1, and the six regional averages ran $4.53 to $4.63 against $3.67 to $3.78 a year earlier (USDA AMS, Oct 1, 2026) [2]. A 30,000-bushel bin therefore holds about $138,000 of grain, roughly a fifth more than last fall. The tool that protects it is a fan of a few horsepower. This piece prices that fan at the electricity rates EIA published on Sep 24 (EIA, Sep 24, 2026) [3], using airflow and storage-life figures from North Dakota State, Minnesota, Iowa State, Oklahoma State, Kentucky and Georgia extension. On a worked example bin, the fall cool-down costs about $146 in Iowa. The moisture the cooling air carries off, and the discounts a warm bin risks, are each several times that.
Earlier Crop Root Zone coverage priced grain bags, field drydown against the dryer, and ground piles. This piece covers only the bin fan.
1. The fan, the front and the hours
What's new: Nothing in the physics. What changes each fall is how many hours the weather offers and how early the grain went in. The working rule from North Dakota State's Ken Hellevang is that the hours needed to move a cooling front through 56-pound grain equal 15 divided by the airflow in cubic feet per minute per bushel. At 0.2 cfm/bu that is about 75 hours (NDSU, Oct 18, 2010) [4]. The temperature change is not complete until the front has passed all the way through the bin (University of Minnesota, 1980) [8].
Evidence: Oklahoma State publishes cooling hours by airflow for clean grain and for grain with high foreign material. Hellevang's rule sits at the low end of the high-foreign-material column, about 25% above the clean-grain hours.
| Airflow (cfm/bu) | 15 ÷ airflow rule (hours)* | OSU, clean grain (hours) | OSU, high foreign material (hours) | OSU class |
|---|---|---|---|---|
| 0.05 | 300 | 240 | 300–350 | Light |
| 0.1 | 150 | 120 | 150–175 | Light |
| 0.2 | 75 | 60 | 75–85 | Medium |
| 0.5 | 30 | 24 | 30–35 | Fast |
| 1.0 | 15 | 12 | 14–16 | High speed |
Source: C. Jones and J. Hardin, Oklahoma State University, BAE-1101, Table 1 (wheat and corn), rev. 2010; rule from NDSU, Oct 18, 2010. Basis: hours of continuous fan operation to move one cooling front through the bin. *Crop Root Zone arithmetic from the NDSU rule.
Iowa State's Dirk Maier makes the same point from the other side: at a typical 0.1 cfm/bu, 120 hours is 80% of the fan time needed to move a front completely through a cored, un-peaked grain mass (Iowa State University, Oct 24, 2025) [11]. Kentucky's Sam McNeill wrote that an overfilled bin takes twice as long to aerate and doubles the energy cost (University of Kentucky, Oct 24, 2001) [10].
Power requirements are small. Georgia's aeration bulletin lists 0.03 horsepower per 1,000 bushels to push 0.1 cfm/bu through 25 feet of shelled corn and 0.06 horsepower for 0.2 cfm/bu, at static pressures of 0.77 and 1.00 inch of water (University of Georgia, rev. Apr 9, 2024) [13]. Minnesota's table gives 1.0 inch for corn up to 20 feet deep at either airflow, against 2.0 inches for wheat at 0.2 cfm/bu (University of Minnesota, 1980) [8]. Installed fans are larger than the table minimum. Hellevang's published examples are a 3-horsepower, 18-inch axial fan delivering 0.17 cfm/bu on a 42-foot bin filled 26 feet deep with barley, drawing 3.45 kW (NDSU, Feb 3, 2015) [5], and a 5-horsepower low-speed centrifugal delivering 0.21 cfm/bu on a 42-foot bin holding 40,000 bushels of soybeans at 36 feet (NDSU, Feb 20, 2020) [6].
The worked bin: A 42-foot bin with corn level at 27 feet holds about 29,900 bushels at 1.25 cubic feet per bushel, the factor Hellevang's own examples imply. Call it 30,000. We fit it with the 3-horsepower axial fan and carry over the 0.17 cfm/bu and 3.45 kW from the barley example. That is an assumption, not a measurement. Corn resists airflow less than small grains, so the same fan would likely move somewhat more air and finish sooner. On those inputs, one cycle takes 15 ÷ 0.17 = 88 hours, or 3.7 days of continuous running, and uses 88 × 3.45 = 304 kWh. That is about 10 kWh per 1,000 bushels.
Ground Truth: The clean-grain and dirty-grain columns differ by 25% to 45% in fan hours, and an overfilled bin doubles them. A change in the electricity rate moves the bill by a few percent. Coring the bin and leveling the peak is the largest lever on aeration cost that an operator controls, and it also removes the fines column where hot spots start. The hours that hurt are the ones not run. A front stopped two-thirds of the way up leaves the warmest grain at the top center, under the roof, where moisture migrates to.
2. What a cycle costs at this fall's electricity prices
What's new: EIA's Electric Power Monthly released Sep 24 carries July 2026 prices, the latest state data available. Iowa residential power averaged 15.99 cents per kWh, up 4.4% from July 2025, and commercial 13.27 cents. Illinois residential was 19.22 cents, up 11.6%. Ohio commercial rose 22%, to 14.06 cents (EIA, Sep 24, 2026) [3]. EIA publishes no farm class. A bin site may be billed on a farm-residential schedule or a general-service one, so both are shown.
Evidence: Three published cost benchmarks and Georgia's power table can be reduced to kWh per 1,000 bushels per cycle and repriced.
| Benchmark | Original basis | kWh per 1,000 bu per cycle | ¢/bu per cycle at 15.99¢* | ¢/bu, three cycles* |
|---|---|---|---|---|
| Georgia B 712 power table | 0.03 hp per 1,000 bu at 0.1 cfm/bu, 25 ft; 120 fall hours | 4.1** | 0.07 | 0.20 |
| NDSU 3-hp axial, worked bin | 3.45 kW, 0.17 cfm/bu, 88 hours on 30,000 bu corn | 10.1 | 0.16 | 0.49 |
| Kentucky, 2001 | 10-hp fan, 15 hours, 10,000 bu; $10.50 at 7¢/kWh | 15.0 | 0.24 | 0.72 |
| Oklahoma State BAE-1101 | 0.7–0.9¢/bu for three cycles at 8–10¢/kWh | 29–30 | 0.47–0.48 | 1.40–1.44 |
Source: University of Georgia B 712, rev. Apr 9, 2024; NDSU (Hellevang), Feb 3, 2015; University of Kentucky, Oct 24, 2001; Oklahoma State University BAE-1101, rev. 2010; EIA Electric Power Monthly Table 5.6.A, Iowa residential, July 2026. *Crop Root Zone arithmetic: each source's implied kWh repriced to 15.99¢/kWh. **Estimate: Georgia's figure is a fan power requirement, converted at the 1.15 kW per horsepower implied by NDSU's 3.45 kW for a 3-hp fan. It is a floor, not an installed-fan figure.
The four sources span a factor of seven and still agree on the conclusion. Three cycles cost between a fifth of a cent and a cent and a half per bushel. Kentucky's benchmark uses a drying-size fan at 1 horsepower per 1,000 bushels. It cools in 15 hours and uses about half again as much energy per cycle as the 3-horsepower aeration fan.
Three cycles is the usual fall count. McNeill steps grain to 60°F in October, 50°F in November and 40°F in December (University of Kentucky, Oct 24, 2001) [10]. Iowa State advises starting a cycle when average air is 10 to 20 degrees below grain temperature and finishing between 30 and 40°F (Iowa State University, Oct 28, 2021) [12]. For the worked bin, three cycles are about 265 fan hours and 913 kWh.
| State | Residential, Jul 2026 (¢/kWh) | YoY | Commercial, Jul 2026 (¢/kWh) | Three cycles, residential ($)* | ¢/bu, residential* | ¢/bu, commercial* | |
|---|---|---|---|---|---|---|---|
| Michigan | 23.05 | +12.2% | 16.46 | 211 | 0.70 | 0.50 | ██████████ |
| Ohio | 19.45 | +11.9% | 14.06 | 178 | 0.59 | 0.43 | ████████ |
| Illinois | 19.22 | +11.6% | 15.19 | 176 | 0.59 | 0.46 | ████████ |
| Wisconsin | 19.06 | +4.4% | 13.93 | 174 | 0.58 | 0.42 | ████████ |
| Minnesota | 17.45 | +3.1% | 13.49 | 159 | 0.53 | 0.41 | ████████ |
| Indiana | 16.73 | +3.4% | 13.30 | 153 | 0.51 | 0.40 | ███████ |
| Missouri | 16.09 | +3.4% | 12.64 | 147 | 0.49 | 0.38 | ███████ |
| Iowa | 15.99 | +4.4% | 13.27 | 146 | 0.49 | 0.40 | ███████ |
| South Dakota | 15.37 | +5.9% | 12.17 | 140 | 0.47 | 0.37 | ███████ |
| Kansas | 15.27 | +5.6% | 12.04 | 139 | 0.46 | 0.37 | ███████ |
| Nebraska | 13.78 | +7.3% | 9.39 | 126 | 0.42 | 0.29 | ██████ |
| North Dakota | 13.41 | +0.8% | 8.22 | 122 | 0.41 | 0.25 | ██████ |
Source: EIA, Electric Power Monthly, Table 5.6.A, July 2026 data, released Sep 24, 2026. Basis: state average price to ultimate customers, all charges included; July is a summer-rate month and fall bills may differ. *Crop Root Zone arithmetic: 913 kWh for three cycles on the 30,000-bushel worked bin. Bars scale residential cost to Michigan = 10 blocks.
0.49¢/bu
Electricity to move three cooling fronts through a 30,000-bushel corn bin with a 3-horsepower fan at Iowa's July 2026 residential rate: 913 kWh, about $146, or 32 bushels of $4.60 corn. (Crop Root Zone calculation from NDSU, Feb 3, 2015; EIA, Sep 24, 2026; USDA AMS, Oct 1, 2026)
Hellevang budgets more generously, at 12 cycles a year for insect and mold protection (NDSU, Feb 3, 2015) [5]. On the worked bin that is about 3,650 kWh, or $584 and 1.9 cents a bushel at the Iowa residential rate (Crop Root Zone arithmetic).
Ground Truth: Illinois residential power rose 11.6% in a year. On this bin that adds about $18 to the fall cool-down, about four bushels. No plausible rate change makes aeration expensive, and no operator should ration fan hours to save power. The one electricity number worth watching is the fan left running. Each unneeded day is 83 kWh, about $13 in Iowa. A fan left on through all of October runs 744 hours against the 88 one cycle needs and wastes about $362, and the power is the smaller part of what it costs.
3. What the cooling buys: storage life by temperature
What's new: The payoff from each cycle is measured in days of storage life, and the tables that measure it have not changed. Allowable storage time roughly doubles for each 10°F of cooling at a given moisture (NDSU, Oct 18, 2010) [4]. Insects reproduce best at 77 to 90°F, slow at 55 to 75°F and go dormant at about 37 to 41°F by one summary, or below about 50°F by another (NDSU, Feb 20, 2020; NDSU, Nov 5, 2015) [6] [16].
Evidence: Hellevang's table is built on a 0.5% maximum dry matter loss and is described as approximate.
| Corn moisture | 70°F (days) | 60°F (days) | 50°F (days) | 40°F (days) | Days added by first 10°F* |
|---|---|---|---|---|---|
| 15% | 125 | 240 | >300 | >300 | 115 |
| 16% | 70 | 120 | 230 | >300 | 50 |
| 17% | 45 | 75 | 130 | 280 | 30 |
| 18% | 30 | 50 | 90 | 200 | 20 |
| 20% | 14 | 25 | 50 | 90 | 11 |
Source: K. Hellevang, NDSU, "Corn Drying and Storage Tips for 2011," Sep 20, 2011, approximate allowable storage time for cereal grains, a composite based on 0.5% maximum dry matter loss. *Crop Root Zone arithmetic: 60°F column minus 70°F column.
Minnesota's older table, on the same dry-matter basis, runs in months and carries every cell. At 15% moisture it gives 5.2 months at 70°F, 9.2 at 60°F, 16 at 50°F and 29 at 40°F (University of Minnesota, 1980) [8]. The two tables differ in places. At 16% and 60°F, Minnesota shows 5.0 months and Hellevang 120 days. Both are approximations.
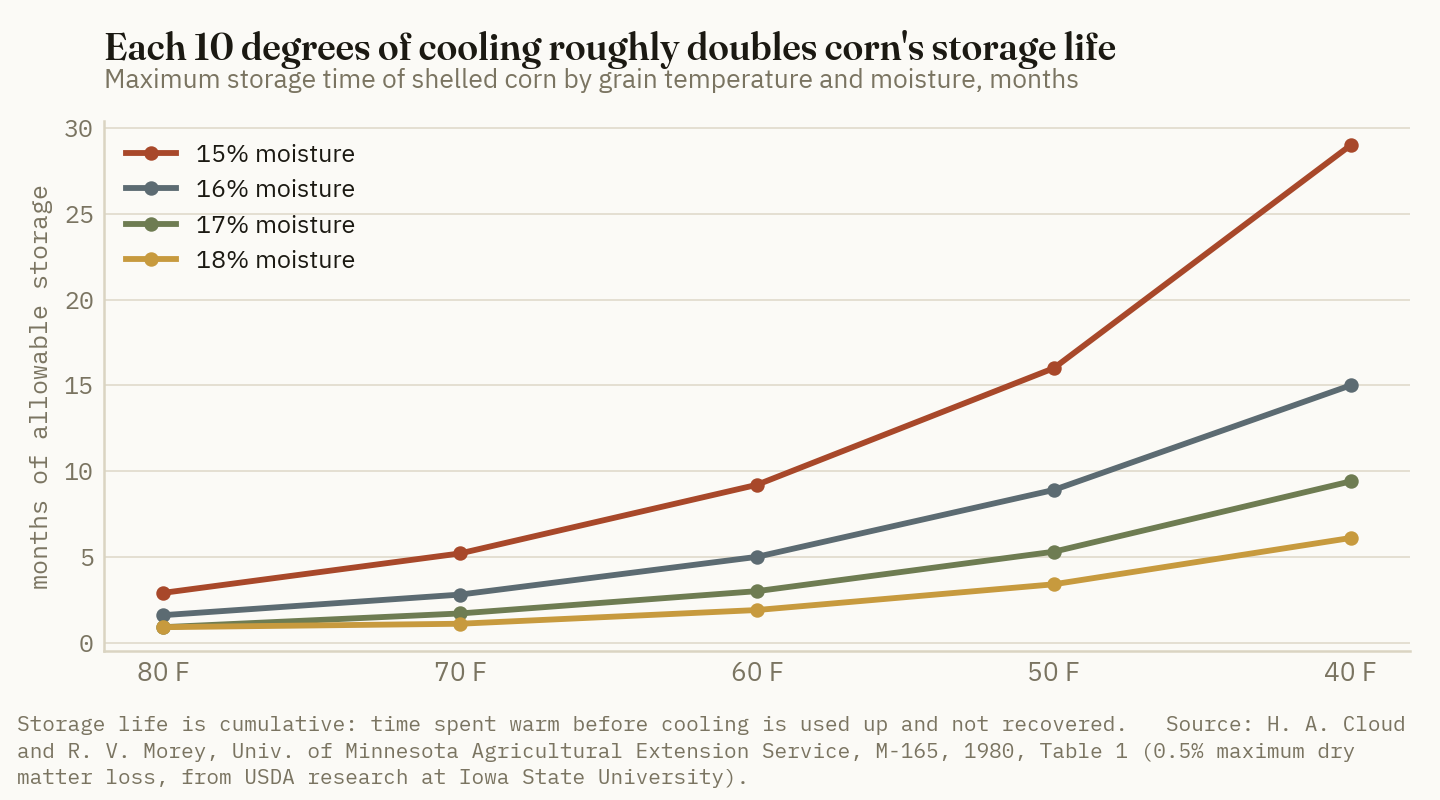
On the worked bin at 16% moisture, the first cycle costs about $49 in Iowa and adds 50 days of allowable storage. The second costs the same and adds 110. Winter targets differ by latitude: 20 to 25°F in northern corn areas (NDSU, Oct 18, 2010) [4], 35 to 45°F in Iowa State's current guidance (Iowa State University, Oct 24, 2025) [11], and no lower than 30°F in its 2021 note, because colder grain adds little and can form ice (Iowa State University, Oct 28, 2021) [12].
Ground Truth: Storage life is cumulative, so the days spent warm before the first cycle are not recovered. Take 17% corn binned at 70°F in the last week of September. Fourteen days at that temperature use 14 of 45 allowable days, or 31% of the grain's life. Cooled to 50°F after that, it has about 90 days left, not 130 (Crop Root Zone arithmetic, applying the table linearly). With Illinois harvest nine points ahead of average and normal October highs and lows averaging about 53°F in Iowa and 56°F in Illinois (NDSU, Feb 20, 2020) [6], the first cycle is the valuable one. It should run as soon as nights allow, on a partly filled bin if necessary, not after the last load goes in.
4. The costs that are not on the power bill
What's new: Aeration removes water. Minnesota's bulletin and Hellevang both put it at about a quarter of a percentage point of moisture for each 10°F of cooling (University of Minnesota, 1980; NDSU, Sep 20, 2011) [8] [7]. A 40°F cool-down therefore takes about one point. Maier's range is wider: corn binned at 14.5% to 15.5% could shrink 0.3 to 1.9 points below market moisture, and he prefers a controller that runs fans on temperature and humidity over a simple thermostat (Iowa State University, Oct 24, 2025) [11]. Oklahoma State puts aeration moisture loss at 0.3 to 0.5 pound per bushel per year (Oklahoma State University, rev. 2010) [9].
Evidence: Shrink is priced with the standard formula, moisture lost divided by 100 minus final moisture (NDSU, Sep 20, 2011) [7]. Corn that falls from 15% to 14% loses 1.16% of its weight. At $4.60 that is 5.3 cents a bushel, or about $1,605 on the worked bin (Crop Root Zone arithmetic). Maier's range is 1.6 to 10.1 cents a bushel on the same basis. Oklahoma State's is 2.5 to 4.1 cents. Each is several times the 0.49 cents of electricity.
The other side of the ledger is what a warm bin risks. Bartlett's yellow corn discount scale for Sheffield, Illinois, effective Aug 1, 2026, takes 2 cents a bushel for each point of damage from 5.1% to 10.0%, 4 cents for heat damage of 0.3% to 0.7%, 10 cents for musty or sour corn and 15 cents for infested corn, with heat damage above 0.2% subject to rejection (Bartlett, Aug 1, 2026) [14]. Those lines track the federal standard: U.S. No. 2 corn allows 5.0% total damaged kernels and 0.2% heat-damaged, and corn with a musty or sour odor, or corn that is heating, is U.S. Sample grade (7 CFR 810.404) [15].
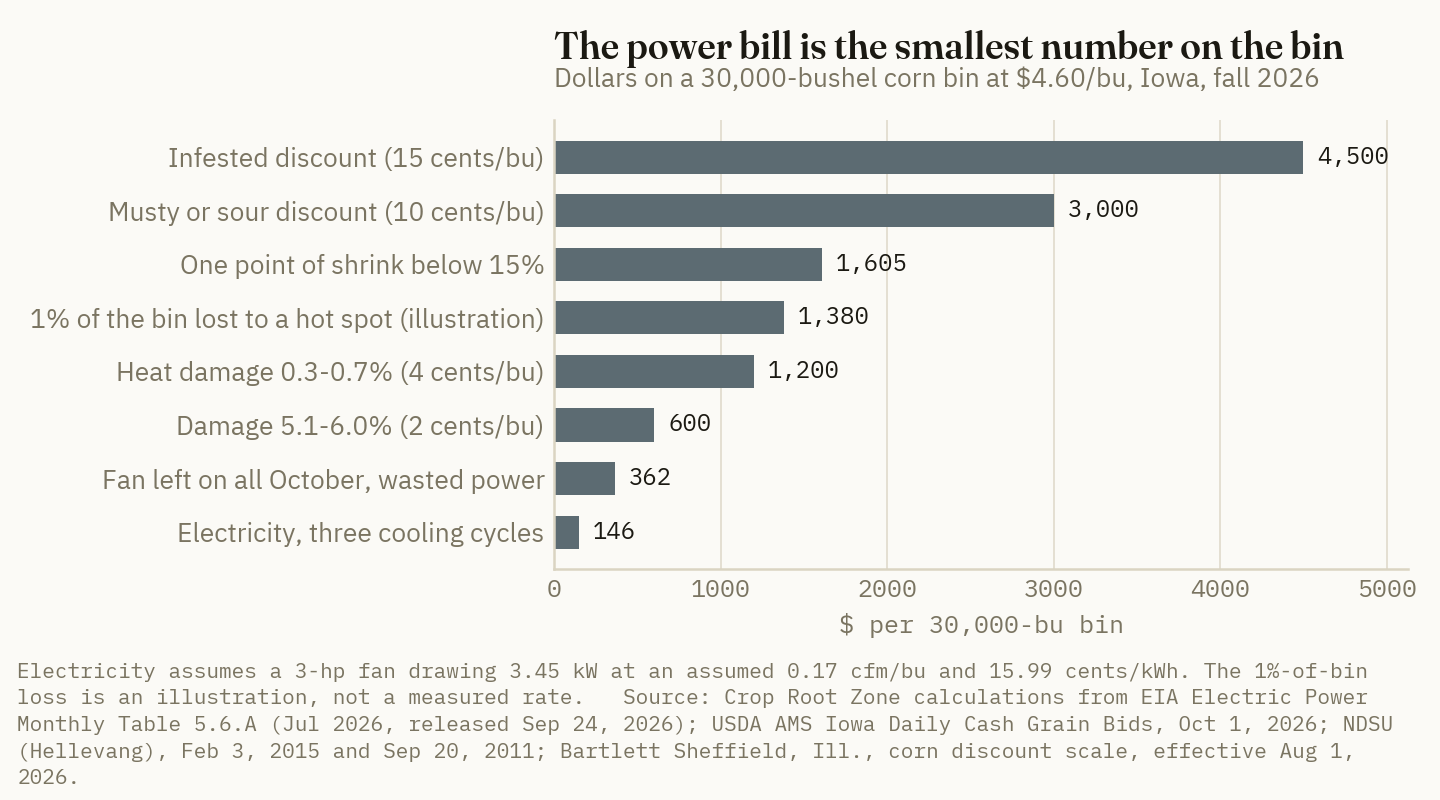
The chart also carries one illustration of our own: a hot spot or crust that takes 1% of the bin, 300 bushels, is $1,380 at $4.60. That is an example, not a measured loss rate. A musty discount on the whole bin is $3,000, about 20 times the season's electricity. Counting power alone, the fan pays for itself if it lowers the odds of a musty bin by five percentage points (Crop Root Zone arithmetic).
Ground Truth: The shrink is the real cost of aeration, and most of it can be planned for at the dryer. Hellevang notes that cooling corn in the bin as it comes off the dryer takes out about a point of moisture (NDSU, Sep 20, 2011) [7]. For corn that will be sold by early summer, Minnesota's short-term storage figure is 15.5% (University of Minnesota, 1980) [8]. Corn binned at 15.5% to 16% and cooled 40°F finishes close to the 15% the elevator pays on, where corn binned at 15% finishes near 14% and gives away 5.3 cents. We reported on Sep 21 that owned-dryer energy ran near 2.8 cents per bushel-point at $1.48 propane (Crop Root Zone, TRZ-0216, Sep 21, 2026) [17]. Shutting the dryer off a point sooner on bins that will be cooled promptly is worth about 8 cents a bushel in propane and shrink together, sixteen times the fan's power bill. It does not apply to corn held past June. Minnesota's figures for that are 14% for a year and 13% beyond.
5. What to watch through December
What's new: Three inputs to this math will update before the bins reach winter temperature.
Evidence: EIA's next Electric Power Monthly is due Oct 23 and will carry August prices (EIA, Sep 24, 2026) [3]. A 10% rate change moves the worked bin's fall bill by about $15. The corn price matters more. Each 50 cents on the Iowa bid changes the value of a point of shrink on the bin by about $175 and the value at risk by $15,000 (Crop Root Zone arithmetic). The third input is the weather itself. Iowa State's rule needs average air 10 to 20 degrees below the grain, and extension guidance is to keep fans off in rain, fog and snow (NDSU, Feb 20, 2020) [6]. We did not price demand or facility charges, which a general-service account may carry and which the EIA state average smooths over. An operator on such a schedule should check the bill, not the average.
Readers can replace our assumed 0.17 cfm/bu with their own bin's figure. The University of Minnesota's fan selection program returns airflow and static pressure for a named fan, bin diameter and grain depth. We did not run it for this piece. The rest of the arithmetic needs only the fan's kW draw and the rate on the bill.
References
- USDA National Agricultural Statistics Service, "Crop Progress," week ending Sep 27, 2026, released Sep 28, 2026 — https://release.nass.usda.gov/reports/prog3926.txt
- USDA AMS Livestock, Poultry and Grain Market News, "Iowa Daily Cash Grain Bids" (Report 2850), Oct 1, 2026 — https://www.ams.usda.gov/mnreports/ams_2850.pdf
- U.S. Energy Information Administration, Electric Power Monthly, Table 5.6.A, "Average Price of Electricity to Ultimate Customers by End-Use Sector, by State, July 2026 and 2025," released Sep 24, 2026 — https://www.eia.gov/electricity/monthly/epm_table_grapher.php?t=epmt_5_6_a
- K. Hellevang, North Dakota State University Extension, "Aeration Key to Storing 16 to 20 Percent Moisture Corn," Oct 18, 2010 — https://www.ag.ndsu.edu/news/newsreleases/2010/oct-18-2010/aeration-key-to-storing-16-to-20-percent-moisture-corn
- K. Hellevang, North Dakota State University, "Grain Storage Management," presentation, West Winfield, N.Y., Feb 3, 2015 (hosted by Cornell Cooperative Extension) — https://nydairyadmin.cce.cornell.edu/pdf/event/pdf217_pdf2.pdf
- K. Hellevang, North Dakota State University, "Grain Storage Best Management Practices," International Crop Expo, Feb 20, 2020 (hosted by Texas A&M) — https://pheed.tamu.edu/wp-content/uploads/sites/102/2020/04/Storage-Management-12Mar2020.pdf
- K. Hellevang, NDSU Extension Service, "Corn Drying and Storage Tips for 2011," Sep 20, 2011 (hosted by University of Wisconsin Extension) — https://fyi.extension.wisc.edu/energy/files/2019/11/Corn_Drying_and_Storage_Tips-NDSU_Hellevang-2011.pdf
- H. A. Cloud and R. V. Morey, University of Minnesota Agricultural Extension Service, "Management of Stored Grain with Aeration," M-165, 1980 (University of Minnesota Digital Conservancy copy) — https://conservancy.umn.edu/server/api/core/bitstreams/e664f115-be79-439d-bc91-223a65a550a1/content
- C. Jones and J. Hardin, Oklahoma Cooperative Extension Service, "Aeration and Cooling of Stored Grain," BAE-1101, rev. 2010 — https://pods.okstate.edu/fact-sheets/BAE-1101pod2010.pdf
- S. McNeill, University of Kentucky Cooperative Extension Service, "Top 10 Reminders for Stored Grain Managers," Oct 24, 2001 — https://news.mgcafe.uky.edu/article/top-10-reminders-stored-grain-managers
- D. Maier, Iowa State University Extension and Outreach, Integrated Crop Management, "Time to Cool and Core Storage Bins," Oct 24, 2025 — https://crops.extension.iastate.edu/post/time-cool-and-core-storage-bins
- K. TeBockhorst, Iowa State University Extension and Outreach, Integrated Crop Management, "Cool Stored Grain Now," Oct 28, 2021 — https://crops.extension.iastate.edu/post/cool-stored-grain-now-1
- J. W. Worley, University of Georgia Cooperative Extension, "Aerating Grain in Storage," Bulletin 712, reviewed Apr 9, 2024 — https://fieldreport.caes.uga.edu/publications/B712/
- Bartlett, "Yellow Corn Discount Scale, Sheffield, Illinois," effective Aug 1, 2026 — https://bartlettco.com/wp-content/uploads/2026/05/Sheffield-Scale-of-Discounts-8-1-26.pdf
- 7 CFR 810.404, "Grades and grade requirements for corn," U.S. Standards for Corn (read via Cornell Legal Information Institute, Oct 2, 2026) — https://www.law.cornell.edu/cfr/text/7/810.404
- K. Hellevang, North Dakota State University Extension, "Grain Management Vital Now," Nov 5, 2015 — https://www.ag.ndsu.edu/news/newsreleases/2015/nov-2-2015/grain-management-vital-now
- Crop Root Zone, TRZ-0216, "At $1.48 Propane, a Late-September Day of Field Drydown Saves About $4.40 an Acre. By Late October It Saves $1.90, and Above 21% Moisture the Dryer Sets the Harvest Pace," Sep 21, 2026
Disclosures
Crop Root Zone is an independent publication. Nothing here is investment advice. Market calls, where included, reflect the editors' own read and are not a recommendation to buy or sell any security.
A Fall Chisel Pass Now Costs About 5 Bushels of Corn. Long-Term Trials Pay It Back on Wet Corn-on-Corn Ground, and Almost Nowhere Ahead of Soybeans.
Iowa's $20.75 chisel rate, repriced to $5.61 farm diesel, takes 4.9 bushels of $4.59 corn; a disk ripper takes about 7. University plots clear that mainly on poorly drained corn-on-corn. Ahead of soybeans, a 1.8-bushel bar is rarely met.
Harvest is moving, and behind the combine the same decision comes up again: chisel the stalks this fall or leave them. The cost side of that decision has a fresh price this year. Iowa State's 2026 custom rate survey puts a fall chisel pass at $20.75 an acre on average, a disk-chisel at $23.00 and a V-ripper with tandem disk at $26.10 (Iowa State University, Mar 2026). Those rates were set on $2.89 diesel. Illinois farm diesel was $5.61 on Sep 18 (USDA AMS, Sep 18, 2026), and Midwest on-highway diesel was still $6.53 in the week of Sep 28, $2.80 above a year earlier (EIA, Sep 29, 2026). Repriced for fuel, a custom chisel pass costs about $23 an acre. That is 4.9 bushels of corn at the Sep 30 Iowa cash average of $4.59, or 1.8 bushels of soybeans at $12.47 (USDA AMS, Sep 30, 2026). This piece prices the pass three ways (hired, owned at full cost, owned at cash cost) and sets those break-evens against what long-term university plots in Ohio, Indiana, Iowa and Minnesota have measured.
On Sep 14 we reported the fuel inside a fall program on corn ground (Crop Root Zone, TRZ-0190, Sep 14, 2026). This piece looks at the whole cost of the tillage pass and asks whether the bushels come back.
1. What a hired pass costs this fall
What's new: The three big public custom rate surveys were all published in 2026, and the two with stated timing were priced well before diesel's late-summer run-up. Iowa's survey went out in early February and assumed $2.89 diesel (Iowa State University, Mar 2026). Ohio's was collected from January to April. The Ohio authors note that Midwest diesel ran from $3.36 to $5.81 over that period, and they assume most respondents priced near the low end (Ohio State University Extension, 2026). Kansas covers custom work done in 2025 and 2026 (Kansas Department of Agriculture and Kansas State University, 2026).
Evidence: The three surveys agree closely on the cost of a primary tillage pass. Illinois has no state survey in this table. Its benchmark is farmdoc's cost-based estimate for a new machine on a 1,400-acre grain farm, which includes no profit margin. farmdoc says custom operators should add 5% to 15% to it (farmdoc, Aug 2025).
| Operation | Iowa 2026 avg | Ohio 2026 avg | Kansas 2026 avg | farmdoc 2025 full cost (IL) |
|---|---|---|---|---|
| Chisel plow | 20.75 | 23.58 | 21.52 (4–12 in.) | 19.50 |
| Disk-chisel | 23.00 | 24.65 | — | 34.70 (coulter chisel w/ leveler) |
| Vertical tillage | 22.15 | 21.31 | 20.76 (2–4 in.) | 18.50 |
| Subsoil, 8–15 in. | 25.20 | 24.30 | 27.40 (in-line ripper) | 29.90 (in-line ripper) |
| V-rip over 15 in. / deep chisel | 27.20 | 26.33 | 25.41 (over 12 in.) | — |
| V-rip with tandem disk / disk ripper | 26.10 | — | — | 40.40 (combination ripper) |
| Strip-till, no fertilizer | 23.20 | 30.25 | 26.28 | 26.10 |
Source: Iowa State University Extension, Ag Decision Maker A3-10, "2026 Iowa Farm Custom Rate Survey," Mar 2026 ($2.89 diesel); Ohio State University Extension, "Ohio Farm Custom Rates 2026" (343 respondents); Kansas Department of Agriculture and K-State Land Use Survey Office, "Kansas Custom Rates 2026"; D. Lattz and G. Schnitkey, farmdoc, "Machinery Cost Estimates: Field Operations," Aug 2025 ($3.00 diesel, $22/hr labor, new machine, 10-year ownership). All values $/acre and include fuel and operator. Ohio's V-rip figure rests on 6 responses.
Two rows stand out. farmdoc's full-cost estimate for a disk ripper is $40.40, well above Iowa's $26.10 survey average. That gap is real. Survey rates reflect what operators charge, often on older and paid-off iron. farmdoc's figure is what a new combination ripper and a 390-horsepower tractor cost to own. The second point: vertical tillage costs about as much to hire as a chisel pass in every survey, even though it burns less fuel.
Repricing for diesel: farmdoc's guide puts fuel use at 0.7 gal/acre for a chisel, 2.1–2.2 for a disk ripper or coulter chisel, 1.6 for an in-line ripper and 0.5 for vertical tillage (farmdoc, Aug 2025). Iowa State's fuel guide gives 0.90 for a chisel, 1.30 for a disk-chisel and 1.70 for a subsoiler (ISU A3-27, Feb 2026, as compiled in TRZ-0190). Adding the $2.72-a-gallon gap between the survey's $2.89 diesel and today's $5.61 farm price gives the fall-2026 rate. The next table shows that rate and the bushels it takes to pay it.
| Hired pass (Iowa basis) | Survey rate | At $5.61 diesel* | Corn bu at $4.59 | Soy bu at $12.47 | |
|---|---|---|---|---|---|
| V-rip over 15 in. | 27.20 | 31.55–32.91 | 6.9–7.2 | 2.5–2.6 | ██████████ |
| V-rip with tandem disk | 26.10 | 31.81 | 6.9 | 2.6 | ██████████ |
| Subsoil 8–15 in. | 25.20 | 29.55–29.82 | 6.4–6.5 | 2.4 | █████████ |
| Disk-chisel | 23.00 | 26.54–28.98 | 5.8–6.3 | 2.1–2.3 | ████████ |
| Strip-till, no fertilizer | 23.20 | 25.65 | 5.6 | 2.1 | ████████ |
| Vertical tillage | 22.15 | 23.51 | 5.1 | 1.9 | ███████ |
| Chisel plow | 20.75 | 22.65–23.20 | 4.9–5.1 | 1.8–1.9 | ███████ |
Source: ISU A3-10, Mar 2026; USDA AMS Illinois Production Cost Report, Sep 18, 2026 ($5.61 farm diesel, F.O.B. average); USDA AMS Iowa Daily Cash Grain Bids, Sep 30, 2026 (state averages $4.59 corn, $12.47 soybeans); fuel use from farmdoc, Aug 2025 and ISU A3-27, Feb 2026. *Crop Root Zone estimate: survey rate plus gal/acre × $2.72. The range reflects the two fuel guides. Custom operators may add a surcharge that differs from this pass-through. Bars scale to the V-rip high value = 10 blocks.
Ground Truth: Diesel has moved the break-even less than the headlines suggest. Passing the full $2.72 fuel increase into a chisel rate adds $1.90 to $2.45 an acre, or about half a bushel of corn. At survey diesel the same pass needed 4.5 bushels; it now needs about 5. A grower who skipped fall tillage last year because it did not pay has no new reason to run it now. One who ran it because the yield came back has little reason to stop over fuel alone. The variable worth arguing about is the yield response, and that changes by ten bushels or more with rotation and drainage.
2. Owning the tillage tool: full cost versus cash cost
What's new: Owning the tool shifts the break-even more than diesel does, and in both directions depending on which cost is counted.
Evidence: farmdoc breaks its full cost into tractor overhead, implement overhead (depreciation, interest, insurance, housing and repairs), fuel and lube, and labor (farmdoc, Aug 2025). Repricing only the fuel and lube line to $5.61, with lube at farmdoc's 10% of fuel, gives the full and cash cost of an owned pass this fall.
| Owned pass (farmdoc basis) | Overhead | Fuel + lube at $5.61* | Labor | Full cost* | Corn bu, full | Corn bu, fuel + labor only |
|---|---|---|---|---|---|---|
| Combination (disk) ripper, 18 ft | 31.50 | 12.96 | 1.90 | 46.36 | 10.1 | 3.2 |
| Coulter chisel w/ leveler | 25.90 | 13.58 | 1.60 | 41.08 | 8.9 | 3.3 |
| In-line ripper | 22.20 | 9.87 | 2.30 | 34.37 | 7.5 | 2.7 |
| Chisel plow, 34 ft | 16.10 | 4.32 | 1.20 | 21.62 | 4.7 | 1.2 |
| Vertical tillage, 30 ft | 16.10 | 3.09 | 0.90 | 20.09 | 4.4 | 0.9 |
Source: D. Lattz and G. Schnitkey, farmdoc, "Machinery Cost Estimates: Field Operations," Aug 2025, Table 1 (new machine, 10-year ownership, $22/hr labor; implement sizes matched to a 1,400-acre farm); USDA AMS, Sep 18 and Sep 30, 2026. *Crop Root Zone estimate: farmdoc gal/acre × $5.61 × 1.10, replacing farmdoc's $3.00 fuel line. farmdoc rounds gallons to one decimal, so small differences from its own fuel column remain. Repairs sit inside overhead and are not separated, so the "fuel + labor only" column understates the true cash cost of a pass.
Two different decisions sit in this table. A grower weighing whether to buy or keep a disk ripper faces a full cost of about $46 an acre, or 10 bushels of corn. That is more than any long-term chisel or ripper trial in Section 3 shows for corn after soybeans. A grower who already owns a paid-for chisel and is deciding about this fall only saves fuel, labor and some repair wear by leaving it parked. That is roughly $5.50 an acre plus repairs, or a bushel and a bit. farmdoc also notes that halving the acres a machine covers raises its per-acre cost by about 80% (farmdoc, Aug 2025). A ripper bought for a few hundred acres of problem ground costs far more per acre than the table shows.
4.9 bu/acre
Corn needed to pay a hired fall chisel pass this fall: Iowa's $20.75 survey rate repriced to $5.61 farm diesel, at the Sep 30 Iowa cash average of $4.59. (Crop Root Zone calculation from ISU A3-10, Mar 2026; USDA AMS, Sep 18 and Sep 30, 2026)
3. What sixty years of plots say the pass returns
What's new: Ohio State's Triplett-Van Doren plots began in 1962 and are among the longest-running no-till comparisons anywhere. In July 2025 Ohio State published corn and soybean averages through 2024 for both sites: Wooster, a well-drained silt loam, and Hoytville, a poorly drained heavy clay (Ohio State University Extension, Jul 10, 2025).
Evidence (corn): Within each rotation, the Ohio plots compare chisel, moldboard and no-till. The difference between chisel and no-till is the yield return to the chisel pass.
| Site and rotation | No-till (bu/ac) | Chisel (bu/ac) | Chisel minus no-till | Clears 4.9-bu hired chisel? |
|---|---|---|---|---|
| Wooster (well drained), corn after soybean | 155.45 | 145.53 | −9.9 | No |
| Wooster, continuous corn | 148.28 | 146.68 | −1.6 | No |
| Hoytville (poorly drained clay), corn after soybean | 144.44 | 144.74 | +0.3 | No |
| Hoytville, continuous corn | 127.52 | 129.98 | +2.5 | No |
| Hoytville, continuous corn, moldboard instead of chisel | 127.52 | 136.52 | +9.0 | Yes |
Source: A. de Camargo Santos, M. Rakkar, S. Culman and L. Deiss, "Corn Performance Improved by Long-term Diversified Crop Rotations and No-tillage in Ohio from 1962 to 2024," Ohio State University Extension ANR-0183, Jul 10, 2025, Table 1 (Wooster 1964–2024, Hoytville 1965–2024). Differences are Crop Root Zone calculations.
Purdue's long-term plots at West Lafayette began in 1975 on Chalmers silty clay loam, a dark, poorly drained prairie soil. They give a sharper split. Over 1981–1994, corn after soybean averaged 184.5 bu/acre with fall moldboard plowing (plus spring disking and field cultivation) and 178.4 with no-till. Continuous corn averaged 174.5 plowed and 143.3 no-till (Purdue Extension, AY-329-W). In the 2008 season, fall chisel beat no-till by 6 bushels after soybean and by 12 in continuous corn. The authors wrote that the after-soybean gap was not statistically significant, and that tillage was beneficial only in continuous corn (Purdue Pest&Crop No. 26, Nov 14, 2008).
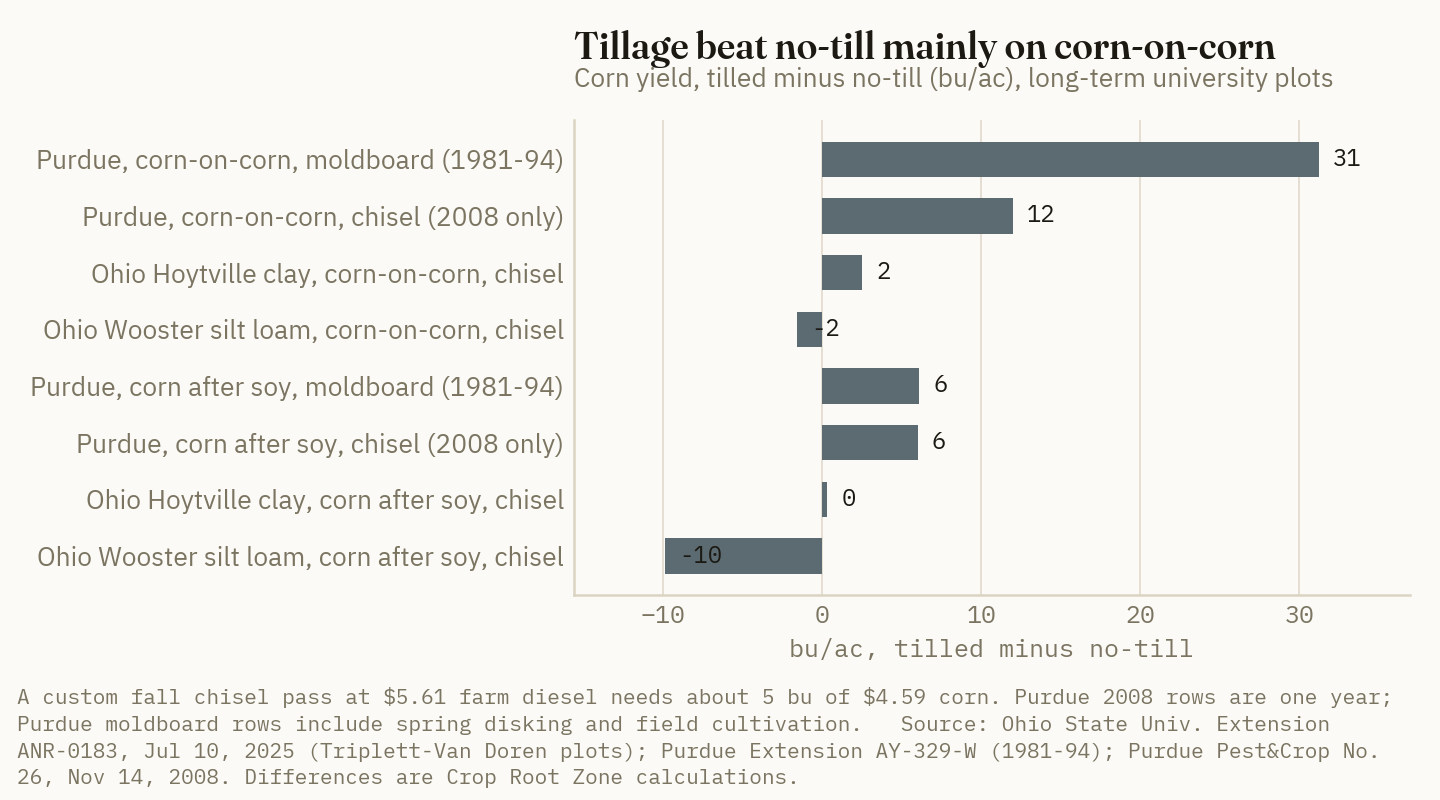
Iowa State's study at seven research farms ran from 2003 to 2013. It tested no-till, strip-till, chisel, deep rip and moldboard in three rotations. It found larger yield and economic penalties for no-till at the northern, poorly drained sites than at the well-drained southern ones. Strip-till and conventional tillage were both significantly higher than no-till in the north (Al-Kaisi et al., Agronomy Journal, 2015, as summarized by the University of Wisconsin and Iowa State). Continuous corn yielded 11% to 28% less than rotated corn depending on site, and conventional tillage input costs ran 7.5% above no-till. We could not reach the paper's site-by-site yield tables (publisher-hosted). The size of the northern penalty therefore stays a direction here, not a number.
Evidence (soybeans): The soybean results are cleaner. At Wooster, no-till soybeans averaged 38.47 bu/acre against 35.41 after chisel, so tillage cost 3.1 bushels. At Hoytville, chisel led by 1.2 bushels, 45.88 to 44.69 (Ohio State University Extension, ANR-0184, Jul 10, 2025). Iowa State's 2002–2008 trials at six farms found no significant soybean yield difference among the five tillage systems. The authors wrote that conventional tillage's soybean advantage "in most cases" did not exceed 1 bushel (Iowa State University, Mar 16, 2009). In on-farm trials in Minnesota and North Dakota from 2015 to 2018, the University of Minnesota compared strip-till, chisel and shallow vertical tillage. Tillage did not affect soybean yield at any farm in any year except one sandy site in 2018, where strip-till beat both chisel and vertical tillage by 3.7 bushels (University of Minnesota Extension, Nov 2019, rev. Jan 2024). None of these results clears 1.8 bushels for tillage ahead of soybeans.
Ground Truth: The fall pass that fails most clearly is chiseling corn stalks that will go to soybeans. That is also among the most common fall passes in the Corn Belt. It costs about $23 hired and needs 1.8 bushels. The university record shows 3 bushels lost on well-drained soil, 1.2 gained on the heaviest clay, and nothing measurable across Iowa and Minnesota. On a 1,000-acre corn-soybean farm, the soybean-bound half of the acres is roughly $11,000 to $12,000 of hired tillage, and the trials do not find the bushels to pay for it. Those acres should be the first to come off this fall's tillage list.
4. Where the pass still earns its cost, and the cheaper option there
What's new: The trials point to one case where tillage pays: continuous corn on poorly drained, high-residue ground in the northern Corn Belt. Purdue's 1981–1994 data show no-till continuous corn at 77.7% of rotated, plowed corn on Chalmers soil. Purdue's agronomists tie the loss to uneven early growth and lower stands in cold, residue-covered seedbeds (Purdue Extension, AY-329-W).
Evidence: Purdue's continuous-corn gap of 12 to 31 bushels easily covers a $32 disk-ripper pass (6.9 bushels). Hoytville's chisel gap of 2.5 bushels does not. Hoytville's moldboard gap of 9 bushels does cover the cost, and the plots show why the tool and the soil matter as much as the rotation. Iowa State's northern sites add a useful detail: strip-till matched conventional tillage there. Strip-till without fertilizer is a $23.20 Iowa survey rate, about $25.65 repriced. It disturbs only the row, not the whole surface. Where it also carries the fall P and K or nitrogen band, the survey's strip-till-with-fertilizer rates of $28.15 to $29.65 replace a separate application pass (ISU A3-10, Mar 2026).
Three caveats limit how far the plot data travel. First, the transition matters. Ohio State reports that no-till continuous corn at Hoytville carried yield penalties for up to 20 years before improving, while Wooster's silt loam responded within three or four years (Ohio State University Extension, ANR-0183). A field switched to no-till this fall will not yield the long-term average next year. Second, much of the Purdue record pairs no-till against fall moldboard plowing, which few growers now use. Third, none of these long-term studies has a vertical-tillage arm with decades of data. For a pass that costs as much to hire as a chisel, its yield record rests on short-term and on-farm work, such as the Minnesota trials above, which found no consistent advantage.
| Situation (corn-belt soils) | Hired cost at $5.61 diesel | Bushels needed | What long-term trials found | Read |
|---|---|---|---|---|
| Corn stalks to soybeans, any drainage | $22.65–23.20 (chisel) | 1.8 soy | −3.1 to +1.2 bu | Skip |
| Soybean stubble to corn, well drained | $22.65–23.20 (chisel) | 4.9 corn | −9.9 bu (Wooster) | Skip |
| Soybean stubble to corn, poorly drained | $22.65–23.20 (chisel) | 4.9 corn | +0.3 to +6 bu | Marginal |
| Corn on corn, well drained | $31.81 (disk ripper) | 6.9 corn | −1.6 bu (Wooster, chisel) | Skip |
| Corn on corn, poorly drained | $31.81 (disk ripper) | 6.9 corn | +2.5 (chisel) to +31 bu | Likely pays; strip-till is the cheaper test |
Source: Sections 1–3 tables; Ohio State University Extension ANR-0183 and ANR-0184, Jul 10, 2025; Purdue AY-329-W and Pest&Crop No. 26, Nov 14, 2008; Iowa State University, Mar 16, 2009. "Read" column is Crop Root Zone's assessment and assumes hired work. An owner with a paid-for tool and spare time faces the much lower cash threshold in Section 2.
Ground Truth: For the 2026 fall, the move is to sort fields by rotation and drainage before the tillage rig leaves the shed, not to cut tillage across the board. Corn-on-corn on tiled-but-wet, dark prairie ground is where the plots return 12 bushels or more, and that is where the tillage budget should go. Strip-till is worth pricing on those acres, because the northern Iowa sites found it held conventional yields at a lower rate. Everywhere else, the $23 to $32 an acre is better left in the operating line until spring.
5. What to watch before the ground freezes
What's new: Two numbers will move between now and freeze-up, and each changes the break-even differently.
Evidence: The first is diesel. EIA's Midwest series fell 15 cents to $6.53 in the week of Sep 28 (EIA, Sep 29, 2026). The next bi-weekly USDA Illinois farm diesel print will show whether the $5.61 farm price followed. Each $0.50 change moves a hired chisel pass by $0.35 to $0.45 an acre and a disk ripper by about $1.05, or roughly 0.1 to 0.2 bushel (Crop Root Zone estimate from farmdoc and ISU fuel rates). The second is the price of the bushel. Iowa cash corn fell 21 cents on Sep 30 alone, to $4.59, while December 2027 corn futures settled at $5.1725 (USDA AMS, Sep 30, 2026). Valued at December 2027 futures less the current 42-cent Iowa average basis, about $4.75 (Crop Root Zone estimate), the chisel break-even eases to about 4.8 bushels. Neither move is large enough to change any row of the table above. A grower whose operator adds a fuel surcharge well above the $2 to $2.50 an acre that the fuel pass-through implies for a chisel should ask how it was calculated.
Ground Truth: A custom-tillage bill this fall should be checked against two numbers: the gallons the pass actually burns and the $2.72-a-gallon diesel increase since the surveys were priced. Anything far above that is margin, not fuel. The bigger saving is not negotiating the rate. It is not hiring the pass on soybean-bound acres at all.
References
- Iowa State University Extension and Outreach, Ag Decision Maker A3-10 / FM 1698, "2026 Iowa Farm Custom Rate Survey," A. Johanns and C. Hart, rev. Mar 2026 — https://www.extension.iastate.edu/agdm/crops/pdf/a3-10.pdf
- B. Ward, E. Richer, J. Barker and A. Bennett, Ohio State University Extension, "Ohio Farm Custom Rates 2026," 2026 — https://go.osu.edu/2026ohiofarmcustomrates
- Kansas Department of Agriculture and Kansas State University Land Use Survey Office, "Kansas Custom Rates 2026," 2026 — https://www.agmanager.info/sites/default/files/pdf/CustomRates_2026.pdf
- D. Lattz and G. Schnitkey, University of Illinois farmdoc, "Machinery Cost Estimates: Field Operations," Aug 2025 — https://farmdoc.illinois.edu/assets/management/machinery-costs/field_operations_2025.pdf
- USDA AMS, Illinois Production Cost Report (Bi-weekly), report 3195, week ending Sep 18, 2026 — https://mymarketnews.ams.usda.gov/viewReport/3195
- USDA AMS Livestock, Poultry and Grain Market News, "Iowa Daily Cash Grain Bids" (Report 2850), Sep 30, 2026 — https://www.ams.usda.gov/mnreports/ams_2850.pdf
- U.S. Energy Information Administration, "Gasoline and Diesel Fuel Update," weekly on-highway diesel, Midwest (PADD 2), week of Sep 28, 2026, released Sep 29, 2026 — https://www.eia.gov/petroleum/gasdiesel/
- Iowa State University Extension and Outreach, Ag Decision Maker A3-27, "Fuel Required for Field Operations," rev. Feb 2026 (values as compiled in Crop Root Zone TRZ-0190, Sep 14, 2026; PDF not re-reached for this piece) — https://www.extension.iastate.edu/agdm/crops/html/a3-27.html
- Crop Root Zone, TRZ-0190, "Midwest Diesel Is $2.19 a Gallon Above Last September. A Harvest-and-Fall-Tillage Pass on Corn Ground Burns About 2.9 Gallons an Acre," Sep 14, 2026
- A. de Camargo Santos, M. Rakkar, S. Culman and L. Deiss, "Corn Performance Improved by Long-term Diversified Crop Rotations and No-tillage in Ohio from 1962 to 2024," Ohio State University Extension ANR-0183, Jul 10, 2025 — https://ohioline.osu.edu/factsheet/anr-0183
- A. de Camargo Santos, M. Rakkar, S. Culman and L. Deiss, "Soybean Yield Response to Long-term No-tillage Across Contrasting Ohio Soils," Ohio State University Extension ANR-0184, Jul 10, 2025 — https://ohioline.osu.edu/factsheet/anr-0184
- C. R. Boomsma and T. J. Vyn, "Plant-to-Plant Uniformity is Essential for Optimum Yield in No-Till Continuous Corn," Purdue Extension AY-329-W (Purdue long-term rotation and tillage experiment, 1981–1994) — https://www.extension.purdue.edu/extmedia/AY/AY-329-W.pdf
- T. J. Vyn and T. D. West, "Conventional Tillage Not Required, but Crop Rotation Still Beneficial, for High Corn Yields in 2008," Purdue Pest&Crop No. 26, Nov 14, 2008 — https://www.agry.purdue.edu/staffbio/Vyn_PandC26.pdf
- M. M. Al-Kaisi, S. V. Archontoulis, D. Kwaw-Mensah and F. Miguez, "Tillage and Crop Rotation Effects on Corn Agronomic Response and Economic Return at Seven Iowa Locations," Agronomy Journal 107(5), 2015 (findings as summarized by University of Wisconsin Corn Agronomy, Jul 2015, and Iowa State; full text not reached, publisher-hosted) — http://wisccorn.blogspot.com/2015/07/B057.html
- M. Al-Kaisi and M. Hanna, "No-Till is Better Choice for Soybean after Corn," Iowa State University Integrated Crop Management, Mar 16, 2009 — https://crops.extension.iastate.edu/cropnews/2009/03/no-till-better-choice-soybean-after-corn
- M. Al-Kaisi, "Let's Talk No-till," Iowa State University Integrated Crop Management, Oct 30, 2018 — https://crops.extension.iastate.edu/cropnews/2018/10/lets-talk-no-till
- J. DeJong-Hughes, "Four years of tillage research wraps up," University of Minnesota Extension Crop News, Nov 2019, rev. Jan 1, 2024 — https://blog-crop-news.extension.umn.edu/2019/11/four-years-of-tillage-research-wraps-up.html
Disclosures
Crop Root Zone is an independent publication. Nothing here is investment advice. Market calls, where included, reflect the editors' own read and are not a recommendation to buy or sell any security.
Every Soybean Left on a Square Foot Costs $3.13 an Acre This Fall. A 15-Minute Loss Check Pays if It Saves a Tenth of a Bushel.
At Sep 29 bids, each soybean per square foot left behind costs $3.13 an acre and each corn kernel $2.40. Most loss happens at the head. Slowing from 5 to 4 mph and a $3.95 air-reel premium both pay back.
Harvest is 18% done for both crops, on pace with the five-year average (USDA NASS via DTN, Sep 28, 2026). This year, what the combine leaves behind is expensive. USDA's Iowa report for Sep 29 put the state average cash bid at $4.80 for corn and $12.53 for soybeans. A year earlier the regional averages were about $3.70 and $9.24 (USDA AMS, Sep 29, 2026). Central Illinois elevators bid $4.87 and $12.63 the same day (USDA AMS, Sep 29, 2026). The extension rules of thumb for counting losses have not changed: two corn kernels or four soybeans per square foot equals one bushel an acre (Iowa State University, Sep 9, 2026). The price of that bushel has changed. A soybean lost per square foot now costs $3.13 an acre, up from about $2.31 a year ago. This piece prices where the bushels go, what the university measurements say is achievable, and which fixes pay back at today's bids.
1. What a seed on the ground is worth
What's new: Iowa State engineers restated the counting rules this month. A 1-ft by 1-ft square holding 2 kernels of corn or 4 soybeans means 1 bu/ac lost. A 30-in by 30-in square holding 12 kernels or 25 soybeans means the same (Houser and Fuhrer, Iowa State University, Sep 9, 2026). For whole ears, each 3/4-lb ear found in 1/100 acre equals about 1 bu/ac (Iowa State University, PM 574, Nov 2008). NC State adds a caution for soybeans. Up to 10 very small beans, or as few as two very large ones, can equal a bushel (NC State Extension, Nov 22, 2017). Seed size moves the count.
Evidence: Pricing the rules at the Sep 29 bids gives the value of each seed on the ground:
| Crop and count | Bushels/acre | Iowa, $4.80 corn / $12.53 soy | Central Illinois, $4.87 / $12.63 | Iowa, a year earlier* |
|---|---|---|---|---|
| Corn, 1 kernel per sq ft | 0.5 | $2.40 | $2.44 | $1.85 |
| Corn, 2 kernels per sq ft | 1.0 | $4.80 | $4.87 | $3.70 |
| Corn, one 3/4-lb ear per 1/100 acre | 1.0 | $4.80 | $4.87 | $3.70 |
| Soybeans, 1 bean per sq ft | 0.25 | $3.13 | $3.16 | $2.31 |
| Soybeans, 4 beans per sq ft | 1.0 | $12.53 | $12.63 | $9.24 |
Source: Iowa State University, Sep 9, 2026 and PM 574, Nov 2008 (counting rules); USDA AMS Iowa Daily Cash Grain Bids and Illinois Grain Bids, Sep 29, 2026 (country elevator averages, current delivery, truck-delivered). *Simple average of the Iowa report's six regional year-ago country elevator prices; Crop Root Zone calculation.
$3.13 an acre
The value of one soybean per square foot left behind the combine at the Sep 29 Iowa average bid of $12.53. One corn kernel per square foot is worth $2.40. (Crop Root Zone calculation from USDA AMS, Sep 29, 2026 and Iowa State University, Sep 9, 2026)
The price of losses rose unevenly. Soybeans are up about 36% from a year ago and corn about 30%. Because a bushel of soybeans is only four seeds per square foot, each soybean on the ground is now worth about 30% more than each kernel of corn. The research also shows where to look. NC State puts gathering losses at more than 75% of soybean machine losses (NC State Extension, Nov 22, 2017), and PAMI's Manitoba work puts about 80% of soybean harvest loss at the header (Sprenger, PAMI, Jun 2020). In corn, Iowa State puts gathering-unit losses at half or more of total machine loss (PM 574, Nov 2008), and Ohio State at about 66% (Hartschuh and Hawkins, Ohio State University, 2021). Iowa State notes that grain loss monitors detect separating and cleaning losses but not gathering losses (PM 574, Nov 2008).
Ground Truth: The expensive seeds fall where the monitor cannot see them. A grower who adjusts the combine by the in-cab loss monitor is tuning the part of the machine that accounts for a quarter or less of soybean loss. This fall, the ten minutes a check takes are best spent on hands and knees in front of the rear axle of the bean head, not behind the chaff spreader.
2. Where the bushels go, and what the best operators hold them to
What's new: The most detailed public breakdown of corn losses is still Iowa State's field survey of 84 randomly selected combines harvesting corn in central Iowa. Extension staff ran it in the 1970s, and the university keeps it as its benchmark in PM 574. The average machine lost 3.7 bu/ac to harvesting and another 2.1 bu/ac to ears dropped before harvest, 5.8 bu/ac in all. The top 10% of machines held harvesting loss to 0.5 bu/ac and total loss to 1.5 (Iowa State University, PM 574, Nov 2008). Iowa State's guidance is that combine losses in good standing corn can be held to 1 bu/ac or less. It records losses as high as 20 bu/ac behind poorly adjusted machines in weedy or badly lodged corn.
Evidence: Repricing the survey at the Sep 29 Iowa bid shows which parts of the machine the money comes from:
| Loss source (corn) | Average, bu/ac | Top 10%, bu/ac | Gap, bu/ac | Gap at $4.80, $/ac | |
|---|---|---|---|---|---|
| Machine ear loss (head) | 1.5 | 0.0 | 1.5 | 7.20 | ██████████ |
| Stalk roll shelling (head) | 0.9 | 0.3 | 0.6 | 2.88 | ████░░░░░░ |
| Cylinder (threshing) loss | 0.6 | 0.0 | 0.6 | 2.88 | ████░░░░░░ |
| Separating loss | 0.7 | 0.2 | 0.5 | 2.40 | ███░░░░░░░ |
| Total harvesting loss | 3.7 | 0.5 | 3.2 | 15.36 | |
| Preharvest dropped ears | 2.1 | 1.0 | 1.1 | 5.28 | ███████░░░ |
Source: Iowa State University Extension, PM 574, "Profitable Corn Harvesting," rev. Nov 2008, Table 3 (84 combines, central Iowa); USDA AMS Iowa Daily Cash Grain Bids, Sep 29, 2026 ($4.80 state average). Gap values are Crop Root Zone calculations. Bars scale to machine ear loss = 10 blocks.
The two head losses make up 2.1 of the 3.2-bushel gap, worth $10.08 of the $15.36. The same survey found losses were lowest when kernel moisture was 19% to 23%, and that they rose with lodging and weeds. A cornhead set 2 inches off the planter's row spacing lost more than 1 bu/ac extra, a finding the authors say later data confirmed. PM 574's targets are specific. Keep separating losses under 0.3 bu/ac. Slow down if more than one ear per 1/100 acre is dropped at the head. Set snapping bars about 1-1/4 inches apart in front and 1-3/8 inches at the back (PM 574, Nov 2008).
Soybean benchmarks come from NC State's harvest guide. It puts typical soybean field losses at about 10% of yield, and 15% to 20% in many cases. It calls a 3% to 4% machine loss "practical to achieve." For a 40-bushel crop, its acceptable maximums are 1.2 bu/ac in total, 1.1 of it at the gathering unit (NC State Extension, Nov 22, 2017). Applied to USDA's September national yield forecast of 52.8 bu/ac (USDA WASDE via McKeany-Flavell, Sep 11, 2026), a 10% field loss is about 5.3 bu/ac, or $66 an acre at $12.53. A 3% to 4% machine loss is 1.6 to 2.1 bu/ac, or $20 to $26. These are estimates. They apply ratios from older survey work to this year's crop, not measurements of it.
Ground Truth: The survey is fifty years old and the machines are not. What it measured has held up: the gap between an average operator and a good one is mostly at the head, and it is closed with wrenches, not new equipment. Deck-plate spacing, chain timing, snout height and matching the head to the planter cost nothing but time. At today's corn price, the gap between an average-set and a well-set machine is worth about $15 an acre. On 1,000 acres that is about $15,000. Iowa's survey puts hired harvest labor at $24.45 an hour (FM 1698, Mar 2026), so the gap would pay an operator for more than 600 hours.
3. Ground speed, reel settings and the price of a loss check
What's new: The clearest public data on speed come from the Prairie Agricultural Machinery Institute (PAMI). In 2016 it ran combines through Manitoba soybeans at 2, 3, 4 and 5 mph. Losses were about 1.36 bu/ac at each of the three lower speeds and 2.18 bu/ac at 5 mph (PAMI 2016 study, via Top Crop Manager, Aug 15, 2017). A later PAMI summary of several projects found losses about 0.5 bu/ac higher on average at 5 to 7 mph than at 3 to 4 mph. It noted that one study found no significant speed effect, and that about 80% of soybean losses occur at the header (Sprenger, PAMI, via Manitoba Pulse & Soybean Growers, Jun 2020). The extension settings agree. Keep ground speed at 3 mph or less. Run the reel about 25% faster than ground speed. Keep the reel axis 6 to 12 inches ahead of the cutterbar (NC State Extension, Nov 22, 2017; Iowa State University, Sep 9, 2026).
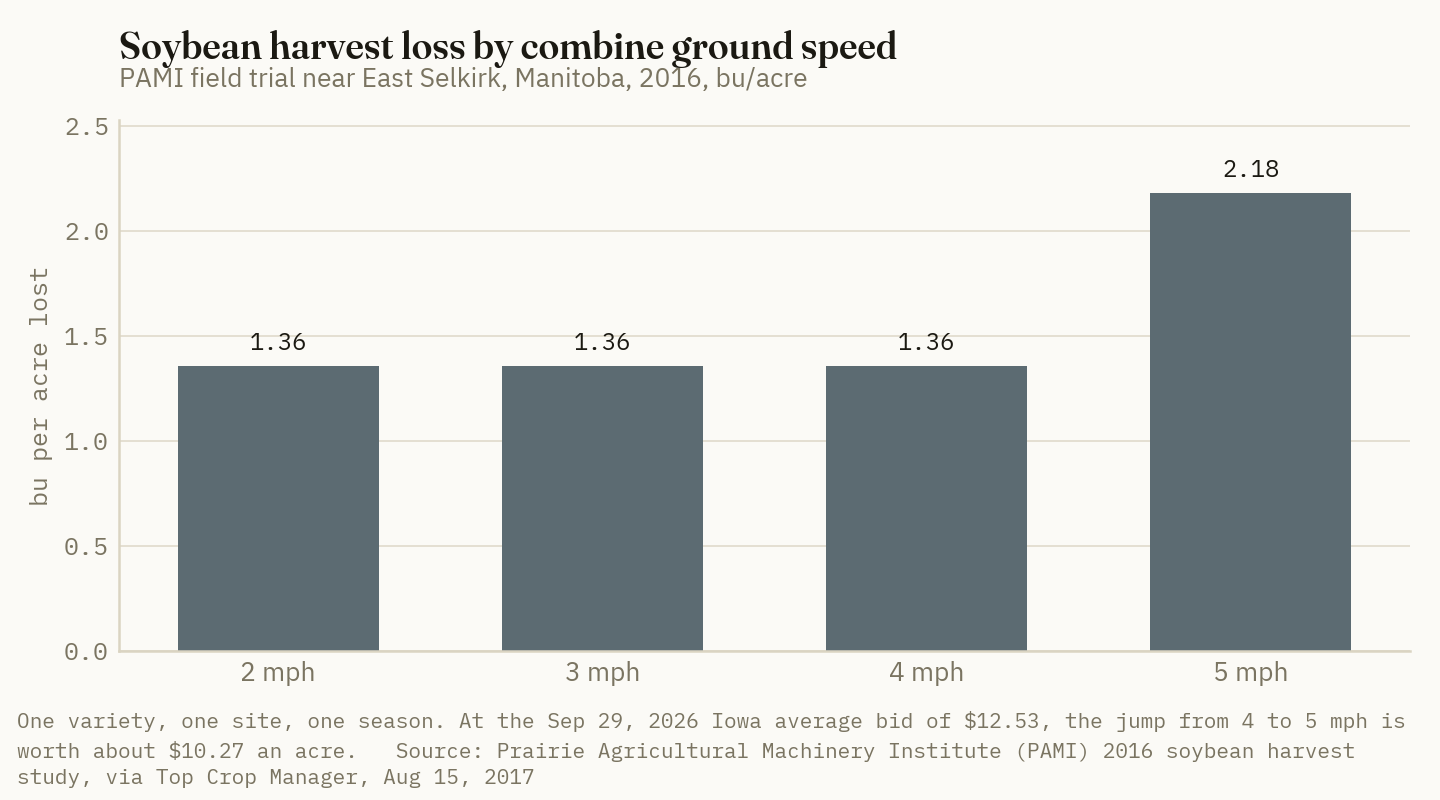
Evidence: Slowing down costs capacity. Iowa State's field-capacity tables assume combines run at a median 4.5 mph. They credit a 35-ft soybean platform with 14.3 acres an hour and a 12-row corn head with 12.8 (Iowa State University, A3-24, Feb 2026). Dropping from 5 to 4 mph cuts capacity by a fifth and adds a quarter to the time per acre. The cost of that time depends on how it is counted. Iowa State's rental worksheet treats 65% of a custom harvesting charge as ownership and repair cost, leaving about 35% for fuel and labor (Iowa State University, FM 1698, Mar 2026). We price the extra quarter of an hour two ways. The low figure uses only the fuel-and-labor share of Iowa's $43.05 soybean combining rate. The high figure uses the whole rate, as if every combine hour were worth a custom operator's price:
| Soybeans, 5 mph to 4 mph | $/acre |
|---|---|
| Loss avoided, PAMI 2016 (0.82 bu/ac) | 10.27 |
| Loss avoided, PAMI multi-study average (0.5 bu/ac) | 6.27 |
| Extra time, fuel and labor share only (25% × 35% × $43.05) | 3.77* |
| Extra time, full custom rate (25% × $43.05) | 10.76* |
| Timeliness cost of finishing later (see Section 4) | about 1.06* |
Source: PAMI via Top Crop Manager, Aug 15, 2017 and Manitoba Pulse & Soybean Growers, Jun 2020; Iowa State University FM 1698, Mar 2026 (soybean combining $43.05/ac); USDA AMS, Sep 29, 2026 ($12.53). *Crop Root Zone estimates. The timeliness line assumes 1,000 acres with a 35-ft head, 10 field hours a day, and Wisconsin's 0.2%-per-day post-maturity loss rate applied to a 52.8-bushel crop. Slowing down adds about 1.6 days, and the average acre is cut about 0.8 day later.
A loss check is cheaper still. Iowa State's procedure is to stop well in from the field edge, disengage and raise the head, back up 15 to 20 feet, and count (PM 574). We assume it takes 15 minutes. That is an estimate, and it is generous for a practiced crew. At 12.8 acres an hour and Iowa's $46.05 corn combining rate, 15 minutes of corn combine time is worth about $147 at full custom value. In soybeans, at 14.3 acres an hour and $43.05, it is about $154. Spread over one 10-hour day, the check pays for itself if it trims loss by 0.24 bu/ac in corn or 0.09 bu/ac in soybeans. That is half a kernel per square foot of corn, or about a third of a bean.
Ground Truth: At $12.53 soybeans, going faster is almost never worth it. Slowing from 5 to 4 mph saves $6 to $10 an acre in the PAMI data. The time-driven cost is about $4, and the added days in the field cost about $1. The trade is close only if every combine hour is priced at the full custom rate, and even then it roughly breaks even. The bigger point is the threshold. PAMI saw no gain below 4 mph and a sharp jump above it. The speed that matters is the one where losses jump, and a grower finds it only by stopping and counting at two speeds in the same field. Iowa State's 2018 advice for difficult conditions was 2.5 to 3 mph in soybeans (Shouse, Iowa State University, Oct 18, 2018). Growers with wide heads and big engines run well above that.
4. What waiting costs: shatter, stalks and the mid-November cliff
What's new: Delay costs yield in both crops, and on different clocks. In soybeans, the University of Wisconsin work by Philbrook and Oplinger remains the reference. It ran at Arlington, Wis., from 1983 to 1986, with a first harvest 3 to 7 days past maturity (R8) and three more at 14-day intervals. Loss of potential yield rose linearly by about 0.2% a day, from 6.1% at the first harvest to 13.9% 42 days later. Preharvest, shatter and stem losses all grew with delay (Philbrook and Oplinger, Agronomy Journal 81:251–258, 1989). In corn, Ohio State ran eight experiments over three years at three Ohio locations, harvesting in early to mid October, November and December. Yield fell about 13% between the October and December dates. About 11 points of that came after the early-to-mid-November harvest, so nearly 90% of the delay loss occurred past mid-November. The loss ranged from 5% to 12% in five experiments and 21% to 24% in the other three (Thomison, Geyer and Minyo, Ohio State University, 2018).
Evidence: Priced at today's bids and USDA's September national yields of 178.5 bu/ac corn and 52.8 bu/ac soybeans (USDA WASDE via McKeany-Flavell, Sep 11, 2026):
| Delay | Yield lost | bu/ac | $/ac at Sep 29 Iowa bid | |
|---|---|---|---|---|
| Soybeans, one week past first harvest | ~1.4% | 0.74 | 9.26* | █░░░░░░░░░ |
| Soybeans, two weeks | ~2.8% | 1.48 | 18.52* | ██░░░░░░░░ |
| Soybeans, six weeks (42 days) | 7.8 points | 4.12 | 51.60* | █████░░░░░ |
| Corn, early-mid Oct to early-mid Nov | ~2% | 3.6 | 17.14* | ██░░░░░░░░ |
| Corn, early-mid Nov to Dec | ~11% | 19.6 | 94.25* | ██████████ |
Source: Philbrook and Oplinger, Agronomy Journal, 1989 (0.2%/day soybeans); Thomison, Geyer and Minyo, Ohio State University C.O.R.N. Newsletter 2018-35 (corn harvest-date trials); USDA WASDE Sep 11, 2026 yields; USDA AMS Iowa bids, Sep 29, 2026. *Crop Root Zone calculations applying research percentages to 2026 national average yields. Actual losses depend on hybrid, variety, weather and stalk health. Bars scale to the corn November-to-December loss = 10 blocks.
Soybean delay has a second cost that is not a field loss. Iowa State shows that beans sold at 10% moisture carry about 3.3% less saleable weight than beans at 13%, and at 8% about 5.4% less (Saeugling, Iowa State University, Sep 15, 2023). On a 52.8-bushel crop at 10% moisture, that is about 1.7 bushels of water weight, or roughly $22 an acre at today's bid. The same article notes that header loss and shatter are worse in dry beans. NC State's advice is to start soybeans when they first reach 15% moisture (NC State Extension, Nov 22, 2017).
The 2026 corn crop comes into this with weak stalks. Iowa State field agronomists reported on Sep 22 that "the biggest concern for farmers at this point is crop standability." They cited high winds, persistent rain and summer stress, and a weather summary warned of ear rots, mycotoxins and stalk rots after "record warmth, exceptionally high humidity, and frequent heavy rainfall" (Iowa State University, Sep 22, 2026). In Champaign County, Illinois, Diplodia stalk rot was named as the main cause of lodging in surveyed fields (farmdoc, Sep 11, 2026). A seed-company agronomist working southeast Nebraska and southwest Iowa said nearly every hybrid showed some stalk integrity or crown rot problem (Brownfield Ag News, Sep 18, 2026). Nebraska's guidance is to consider harvesting early when more than 10% of plants fail a push test (Jackson-Ziems et al., University of Nebraska–Lincoln CropWatch, Sep 19, 2025). Only 57% of the remaining U.S. corn crop was rated good to excellent on Sep 27, 9 points below a year earlier (USDA NASS via DTN, Sep 28, 2026).
Ground Truth: Harvest order is the most valuable setting on the combine this year. A field that fails the push test and stands into December is exposed to the Ohio trials' 21% to 24% loss range, not the 13% average, which at today's bid is roughly $180 to $205 an acre on a 178-bushel crop (our estimate). No reel or deck-plate adjustment recovers that. The field drydown bill is a separate calculation. It has to be very large to justify leaving weak-stalked corn past mid-November, because the Ohio data show almost no extra drying after that date. In soybeans the clock runs slower. A week's delay costs about $9 an acre, less than a poorly set header does, so it pays to start beans at 15% moisture and cut them carefully rather than rushing at 5 mph.
5. Air reels, drapers and corn reels: what equipment pays
What's new: Iowa's 2026 custom-rate survey prices the header options directly. Standard soybean combining averages $43.05 an acre from 94 responses. With an air reel it averages $47.00 from 21 responses, and with a draper head $48.20 from 95. Corn combining averages $46.05, and the added charge for a corn reel in downed corn averages $12.55 an acre, with a range of $5 to $30 from 34 responses (Iowa State University, FM 1698, Mar 2026). PAMI's field work puts the benefit of an air system on a soybean header at an average 0.5 to 1 bu/ac. A properly adjusted draper beat an auger header by the same 0.5 to 1 bu/ac, and a badly set draper lost up to 1.5 bu/ac more than a well-set one (Sprenger, PAMI, Jun 2020). PAMI's 2016 study reported air reels cutting losses by more than half against an auger header alone, about 1.25 bu/ac (via Top Crop Manager, Aug 15, 2017).
Evidence: Comparing each custom premium with the value of the loss it removes:
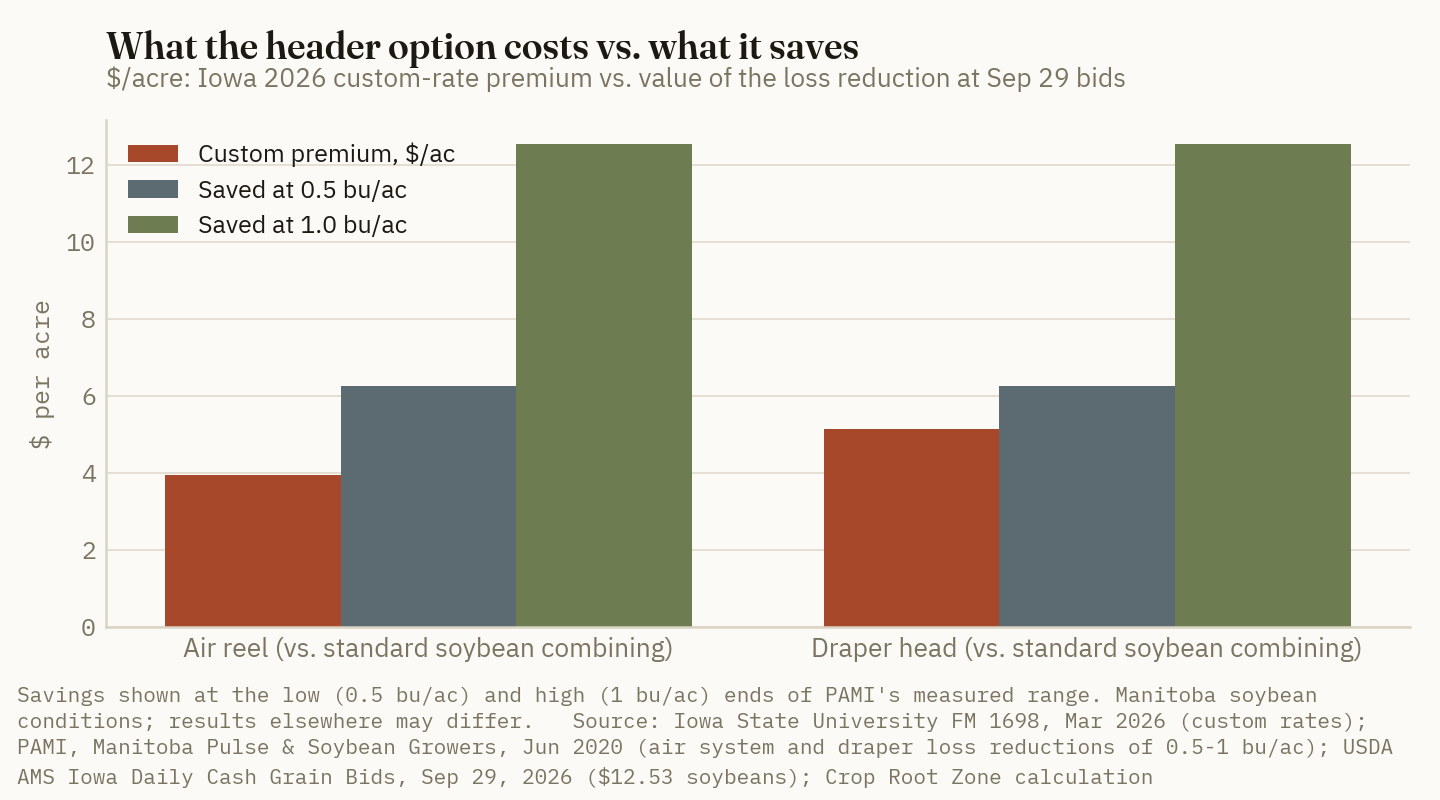
| Option | Custom premium, $/ac | Break-even loss reduction | Measured reduction | Source of measurement |
|---|---|---|---|---|
| Air reel, soybeans | 3.95 | 0.32 bu/ac* | 0.5–1.0 bu/ac | PAMI, Manitoba |
| Draper head, soybeans | 5.15 | 0.41 bu/ac* | 0.5–1.0 bu/ac (vs. auger) | PAMI, Manitoba |
| Corn reel, downed corn | 12.55 | 2.6 bu/ac* | No public trial found; down-corn losses of 10–15% "even when care is taken" | Hanna, Iowa State, via Bayer |
| Cornhead matched to row spacing | 0 | any | >1 bu/ac | PM 574 survey |
Source: Iowa State University FM 1698, Mar 2026 (premiums are differences between survey averages); PAMI via Manitoba Pulse & Soybean Growers, Jun 2020; Hanna, Iowa State University, "Harvesting lodged corn," Sep 18, 2006; PM 574, Nov 2008; USDA AMS Iowa bids, Sep 29, 2026. *Crop Root Zone calculation at $12.53 soybeans and $4.80 corn.
Ownership is harder to price. We found no public list price for a new air reel or air-bar kit, so we did not assume one. The break-even can still be framed from the savings side. On 1,000 soybean acres a year, a 0.5 bu/ac reduction is worth about $6,265 a season at today's bid, and a 1 bu/ac reduction about $12,530. Over five seasons, before discounting, that is roughly $31,000 to $63,000 a 1,000-acre operation could spend on the attachment and still break even (Crop Root Zone estimate). Halve the soybean price and halve the result. The corn reel has a second benefit. Bayer's agronomy guidance, citing Ohio State's Thomison, says reels on the corn head "may allow for increased harvest speed" in down corn. It also cites Iowa State's Hanna for losses of 10% to 15% in down corn "even when care is taken" (Bayer Crop Science, Nov 29, 2023). Some of a reel's value may therefore show up as capacity rather than bushels.
Ground Truth: For a grower hiring custom harvest, the air-reel premium is one of the few upcharges this fall that clearly pays. At $12.53, it needs a third of a bushel and PAMI measured half a bushel to a bushel. A draper is similar, but the same PAMI work shows a badly set draper giving back its whole advantage. A header upgrade without a loss check buys the potential saving, not the saving itself. The corn reel is the opposite case. At $12.55 it needs 2.6 bushels an acre, so it pays only in fields that are genuinely down. In 2026 there may be more of those than usual.
References
- USDA AMS Livestock, Poultry and Grain Market News, "Iowa Daily Cash Grain Bids" (Report 2850), Sep 29, 2026 — https://www.ams.usda.gov/mnreports/ams_2850.pdf
- USDA AMS Livestock, Poultry and Grain Market News, "Illinois Grain Bids" (Report 3192), Sep 29, 2026 — https://www.ams.usda.gov/mnreports/ams_3192.pdf
- DTN/Progressive Farmer, "USDA Crop Progress: Corn 18% Harvested, Soybeans 17% Harvested as of Sept. 27," Sep 28, 2026 — https://www.dtnpf.com/agriculture/web/ag/news/article/2026/09/28/usda-crop-progress-corn-18-harvested
- D. Houser and L. Fuhrer, "Five Steps to Reduce Loss, Improve Combine Performance and Prepare for Next Year," Iowa State University Integrated Crop Management, Sep 9, 2026 — https://crops.extension.iastate.edu/post/five-steps-reduce-loss-improve-combine-performance-and-prepare-next-year
- M. Hanna, Iowa State University Extension, PM 574, "Profitable Corn Harvesting," rev. Nov 2008 — https://crops.extension.iastate.edu/files/inline-files/PM574.pdf
- J. Dunphy and E. O. Beasley, NC State Extension, "Reduce Soybean Harvest Losses," Nov 22, 2017 — https://content.ces.ncsu.edu/reduce-soybean-harvest-losses
- J. Hartschuh and E. Hawkins, "Minimizing Corn Harvest Losses At The Combine," Ohio State University C.O.R.N. Newsletter 2021-33 — https://agcrops.osu.edu/newsletter/corn-newsletter/2021-33/minimizing-corn-harvest-losses-combine
- McKeany-Flavell, "September 2026 WASDE Updates," Sep 11, 2026 (USDA corn yield 178.5 bu/ac; soybean yield 52.8 bu/ac) — https://www.mckeany-flavell.com/september-2026-wasde-updates-09-11-26/
- Top Crop Manager, "PAMI uncovers keys to higher returns on soybeans" (PAMI 2016 study, East Selkirk, Man.), Aug 15, 2017 — https://www.topcropmanager.com/pami-uncovers-keys-to-higher-returns-on-soybeans-20731/
- C. Sprenger, Prairie Agricultural Machinery Institute, "Harvest Header Losses in Soybeans," Manitoba Pulse & Soybean Growers, Jun 2020 — https://manitobapulse.ca/2020/06/harvest-header-losses-in-soybeans/
- Iowa State University Extension and Outreach, Ag Decision Maker A3-24 / PM 696, "Estimating the Field Capacity of Farm Machines," rev. Feb 2026 — https://www.extension.iastate.edu/agdm/crops/pdf/a3-24.pdf
- Iowa State University Extension and Outreach, FM 1698 / Ag Decision Maker A3-10, "2026 Iowa Farm Custom Rate Survey," rev. Mar 2026 — https://www.extension.iastate.edu/agdm/crops/pdf/a3-10.pdf
- S. Shouse, "Harvest loss in difficult conditions," Iowa State University Integrated Crop Management, Oct 18, 2018 — https://crops.extension.iastate.edu/post/harvest-loss-difficult-conditions
- B. D. Philbrook and E. S. Oplinger, "Soybean field losses as influenced by harvest delays," Agronomy Journal 81:251–258, 1989 (University of Wisconsin–Madison; abstract findings as indexed; full text not reached, publisher-hosted)
- P. Thomison, A. Geyer and R. Minyo, "Harvest Delays Impact Corn Performance," Ohio State University C.O.R.N. Newsletter 2018-35 — https://agcrops.osu.edu/newsletter/corn-newsletter/2018-35/harvest-delays-impact-corn-performance
- A. Saeugling, "Soybean harvest: When the time is right," Iowa State University Integrated Crop Management, Sep 15, 2023 — https://crops.extension.iastate.edu/post/soybean-harvest-when-time-right
- R. Vittetoe et al., "Regional Crop Update: September 2026," Iowa State University Integrated Crop Management, Sep 22, 2026 — https://crops.extension.iastate.edu/post/regional-crop-update-september-2026
- farmdoc / University of Illinois, "Illinois Crop Update | September 11, 2026" — https://farmdoc.illinois.edu/field-crop-production/illinois-crop-update-september-11-2026.html
- Brownfield Ag News, "Agronomist warns of corn stalk issues heading into harvest," Sep 18, 2026 — https://www.brownfieldagnews.com/news/agronomist-warns-of-corn-stalk-issues-heading-into-harvest/
- T. Jackson-Ziems, J. Brhel and D. S. Wangila, "Harvest 2025 Prep Guide: Minimize Losses in Disease-Stressed Corn," University of Nebraska–Lincoln CropWatch, Sep 19, 2025 — https://cropwatch.unl.edu/harvest-2025-prep-guide-minimize-losses-disease-stressed-corn
- M. Hanna, "Harvesting lodged corn," Iowa State University Integrated Crop Management, Sep 18, 2006 — https://crops.extension.iastate.edu/encyclopedia/harvesting-lodged-corn
- Bayer Crop Science, "Harvesting Lodged and Down Corn," Nov 29, 2023 — https://www.cropscience.bayer.us/articles/bayer/harvesting-down-corn
Disclosures
Crop Root Zone is an independent publication. Nothing here is investment advice. Market calls, where included, reflect the editors' own read and are not a recommendation to buy or sell any security.
Ag Lime Costs 2.7 Cents a Pound of Effective Neutralizing Material, Delivered and Spread. Pelletized Lime Costs 11 to 21. In Six Iowa Trials, 200 Pounds an Acre Moved pH by a Tenth.
At Missouri's surveyed $30.58 a ton delivered and spread, ag lime costs 2.7 cents per pound of effective calcium carbonate; public pelletized prices work out to 11 to 21. In Iowa State's six-site trials, 100 to 400 pounds of pellets left average pH at 5.71 or lower.
Harvest opens the liming window, and with it the offer of pelletized lime at 200 to 400 pounds an acre in place of one to three tons of bulk ag lime. The two products are the same rock. Pelletized lime is limestone ground finer, then bound into granules with lignosulfonate so that it flows through a dry-fertilizer spreader (Mallarino and Haq, Iowa State University, 2017) [8]. Missouri's 2026 custom-rate guide puts ag lime at an average $30.58 a ton delivered and spread, material included (University of Missouri Extension, Mar 2026) [1]. The public pelletized prices we found run $188 to $373 a ton before spreading [3][4][5][6]. Every Corn Belt state already publishes the yardstick that makes the two comparable: pounds of effective neutralizing material in a ton. On that basis ag lime costs about 2.7 cents a pound and pelletized lime 11 to 21 cents, by our calculation. Iowa State then tested the low-rate claim directly at six sites: 200 pounds of pellets an acre left soil pH 0.12 above the unlimed control (Mallarino and Haq, Iowa State University, 2022) [9].
1. What a ton of each costs this fall
What's new: Two state custom-rate surveys published in March 2026 give current ag-lime figures. No state survey prices pelletized lime, and we found no extension budget or dealer sheet that posts a bulk truckload price for it. The pelletized prices below are public retail listings, mostly bagged, and they are labelled as such.
Evidence: Missouri respondents reported $20 to $40 a ton to deliver and spread lime, lime included, with a median of $32.50 from six responses [1]. Iowa's survey prices the spreading alone: $8.30 a ton on average, $5 to $14, from 31 responses (Iowa State University Extension, Mar 2026) [2]. Spreading dry fertilizer, which is how pellets go on, averaged $8.15 an acre in Iowa and $7.97 in Missouri [1][2]. Ohio State specialists wrote that pelletized lime "can cost 5-7 times more per ton than ag lime" (Mullen and Diedrick, Ohio State University, Apr 2009) [7]. Applied to Missouri's average, that multiple implies $153 to $214 a ton for bulk pellets. We use that as an estimate, not a quote.
| Product and form | $/ton | Basis | Date |
|---|---|---|---|
| Ag lime, delivered and spread, average | 30.58 | Missouri survey, lime included; range $20–$40, 6 responses | Mar 2026 |
| Ag lime, spreading only, average | 8.30 | Iowa survey, per ton spread; range $5–$14, 31 responses | Mar 2026 |
| Bulk ag lime, material | 53.00 | Mississippi State food-plot guide | Sep 2023 |
| Pelletized, bulk truckload | 153–214* | Estimate: 5 to 7 times Missouri's ag-lime average | — |
| Pelletized, 40-lb bags | 187.50 | Mississippi State guide, $3.75 a bag | Sep 2023 |
| Pelletized dolomitic, 2,000-lb tote | 325.00 | Ohio retailer, FOB store | Oct 2026 |
| Pelletized, pallet of 50-lb bags | 346.28 | Maine retailer, $484.79 per 1.4-ton pallet | 2026 |
| Pelletized, 40-lb bags | 362.50 | New York retailer, $7.25 a bag | Aug 2026 |
| Pelletized dolomitic, 50-lb bags by the ton | 373.20 | Ohio retailer, $9.33 a bag | Oct 2026 |
| Pulverized (not pelletized), pallet of 50-lb bags | 195.00 | Maine retailer, $273 per 1.4-ton pallet | 2026 |
| Pulverized (not pelletized), 40-lb bags | 312.50 | New York retailer, $6.25 a bag | Aug 2026 |
Sources: University of Missouri Extension, G302, Mar 2026 [1]; Iowa State University Extension, FM 1698, Mar 2026 [2]; Ohio Earth Food, accessed Oct 5, 2026 [3]; Pierce Milling, price page updated Aug 14, 2026 [4]; Long Horn Horse & Pet Supply, 2026 price list [5]; Mississippi State University Extension, P3102, Sep 2023 [6]. Per-ton figures for bagged and palletized goods are Crop Root Zone conversions from the posted unit price. *Estimate from the Ohio State multiple [7]; no public bulk pelletized quote was obtained.
Ground Truth: The retail listings separate two premiums that the sales pitch runs together. At the Maine store, bagged pulverized lime is $195 a ton and bagged pellets $346, so pelletizing adds about $151. At the New York store the gap is $50. The rest of the distance from a $31 delivered-and-spread ton is bagging, freight and store margin. A grower quoted pellets by the bag or tote is mostly paying for packaging, and should ask for a bulk price and a guaranteed analysis before comparing anything.
2. How states score a ton of lime
What's new: Each state reduces purity and fineness to one number, and pelletized products are scored on the same scale as quarry lime. Ohio State's guidance is that a pellet "is a regular lime source" ground finer and bound, and that its analysis sheet carries the same effective-neutralizing figure as any other lime (Lentz and Culman, Ohio State University, 2014) [18].
Evidence: The scores differ in sieves and units but not in logic: calcium carbonate equivalent (CCE) times a fineness factor.
| State | Score | Unit | Fineness credit by particle size |
|---|---|---|---|
| Iowa | ECCE | % of ton | Sum of 0.1 × % passing 4-mesh, 0.3 × % passing 8-mesh, 0.6 × % passing 60-mesh, times CCE |
| Kentucky | RNV | % of ton | Half credit between 10- and 50-mesh, full credit finer than 50-mesh, none coarser than 10-mesh |
| Missouri | ENM | lb per ton | CCE × fineness × 800; 25% credit at 8–40 mesh, 60% at 40–60, 100% finer than 60 |
| Ohio | ENP | lb per ton | 20% credit at 8–20 mesh, 60% at 20–60, 100% finer than 60; times total neutralizing power and dry matter |
| Wisconsin | NI | index grade | Purity and fineness; sold in ten-point zones such as 60–69 and 80–89 |
Sources: Mallarino and Haq, 2017 [8]; University of Kentucky, ID-163, revised Feb 2025 [10]; University of Missouri Extension, G9107, reviewed Sep 2017 [11]; Ohio Aggregates & Industrial Minerals Association, accessed Oct 5, 2026 [12]; University of Wisconsin Extension, accessed Oct 5, 2026 [13].
The scores move a great deal between piles. Kentucky's regulatory sampling of three quarries over seven years found RNVs from 24% to 99%, and the state's old default assumption was 67% [10]. The ag lime Iowa State bought for its trials tested 91.4% CCE with only 37% passing a 60-mesh screen, for an ECCE of 56.2%. The pelletized product tested 90.1% CCE with 97% passing 60-mesh, for 88.6% [8]. That is 1,124 pounds of effective material in a ton of that ag lime and 1,772 in a ton of those pellets. The pellets are 1.6 times as concentrated. They are not ten times as concentrated.
Missouri's guide gives the pricing rule: divide the price per ton by the effective pounds per ton [11]. Doing that with the Section 1 prices and the Iowa State analyses gives the comparison this piece is about.
| Product and price basis | $/ton | Cents per lb ECCE | |
|---|---|---|---|
| Ag lime, delivered and spread, Missouri average | 30.58 | 2.7 | █░░░░░░░░░ |
| Ag lime, Missouri survey range | 20–40 | 1.8–3.6 | █░░░░░░░░░ |
| Pelletized, bulk estimate | 153–214* | 8.6–12.1* | █████░░░░░ |
| Pelletized, 40-lb bags, 2023 | 187.50 | 10.6 | █████░░░░░ |
| Pelletized, 2,000-lb tote | 325.00 | 18.3 | █████████░ |
| Pelletized, pallet of 50-lb bags | 346.28 | 19.5 | █████████░ |
| Pelletized, 40-lb bags | 362.50 | 20.5 | ██████████ |
| Pelletized, 50-lb bags by the ton | 373.20 | 21.1 | ██████████ |
Source: Crop Root Zone calculation. Price per ton [1][3][4][5][6] divided by 1,124 lb ECCE per ton for ag lime and 1,772 lb for pelletized lime, the dry-basis analyses in Mallarino and Haq, 2017 [8]. Ag lime price includes spreading; pelletized prices do not. The ag lime in that study carried 6.5% moisture, which would raise its cost per pound about 7%. Retail pellets are assumed to match the tested product; the label analysis governs. *Estimated price, see Section 1. Bars scale cents per pound; 21.1 = 10 blocks, rounded, with ranges drawn at the midpoint.
2.7¢ against 18.3¢
Cost per pound of effective calcium carbonate: ag lime delivered and spread at Missouri's 2026 average, and pelletized lime in a 2,000-pound tote before spreading. (Crop Root Zone calculation from University of Missouri Extension, Mar 2026; Ohio Earth Food, Oct 2026; Mallarino and Haq, 2017)
3. What the replicated trials measured
What's new: The only trial built to find the lowest pelletized rate that works is Iowa State's 2020–2021 study: six sites, initial pH 5.1 to 5.9, one application of 100 to 6,400 pounds an acre in fall 2019, corn then soybean. It was funded by the pellet manufacturer and used its product [9].
Evidence: By spring 2021 the six-site average pH was 5.53 unlimed, 5.60 at 100 pounds, 5.65 at 200, 5.71 at 400, 5.78 at 800, 6.01 at 1,600 and 6.5 at 6,400 [9]. Iowa's target is 6.0 or 6.5 depending on subsoil. Only the two highest rates held pH at or above 6.0 across the two years. Corn gained 3 to 7 bushels an acre at 100 and 200 pounds and 13 to 16 bushels at 1,600 and 6,400; soybean gained 1 to 3 and 5 to 6. The authors' conclusion is that rates below what the soil test calls for "limited crop yield significantly at several sites" [9].
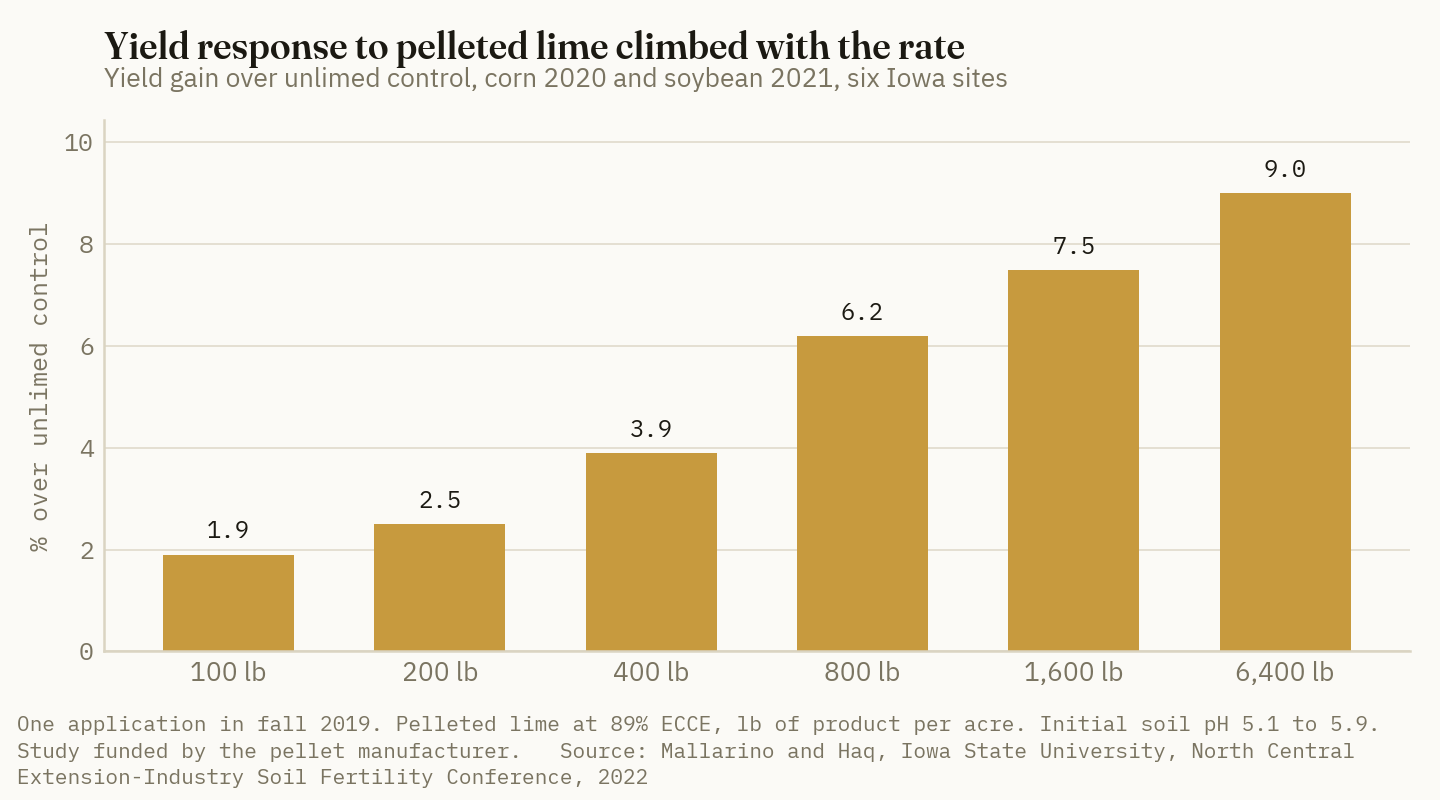
The earlier Iowa State study, 2014–2016, put pellets and ag lime side by side at equal CCE rates of 1, 2, 4 and 8 tons an acre. Pellets reached their maximum pH faster. At 12 months they stood at 6.1, 6.4, 6.8 and 7.0 across the four rates against 5.9, 6.0, 6.4 and 6.7 for ag lime. Yield did not differ by source at any site: at the responsive sites the 1-ton rate took corn from 206 bushels to 218 with ag lime and 219 with pellets [8].
| Trial | Design | pH result | Yield result |
|---|---|---|---|
| Iowa State, 2014–16 | 6 sites; ag lime (56.2% ECCE) vs pellets (88.6%) at 1–8 tons CCE/acre | Pellets faster and 0.2–0.4 higher at 12 months | No difference between sources at any site |
| Iowa State, 2020–21 | 6 sites; pellets at 100–6,400 lb/acre | 100–400 lb: 0.07–0.18 above control; 1,600 lb: 6.01 | +1.9% to +3.9% at 100–400 lb; +7.5% at 1,600; +9.0% at 6,400 |
| Kentucky, 2021–22 | 16 sites; pellets (RNV 83) vs ag lime (RNV 79), both at 2 tons of 100% effective lime | +0.67 pellets, +0.77 ag lime at 12 months; not statistically different | Not measured |
| Ohio State, Wooster, 2010 | 1 site, 1 year; both sources at 1.3, 2.5 and 5 tons/acre | Ag lime faster at most sampling dates; sub-requirement rates missed target with either source | Low-rate pellets equal to untreated control; all ag lime rates higher |
| Missouri, no-till, 48 months | Ag lime (377 ENM) at 6 and 12 tons vs pellets (580 ENM) at 200 lb/acre a year | Ag lime adjusted pH to 6 inches by 48 months; pellets failed to adjust pH | Not reported in abstract |
Sources: Mallarino and Haq, 2017 and 2022 [8][9]; Ritchey, Grove and Teutsch, University of Kentucky, Nov 2022 [14]; Lentz et al., Journal of the NACAA, 2010 [15]; Flanary, Chapple and Crawford, Journal of the NACAA, Nov 2011 [16]. The Ohio and Missouri rows are from the published abstracts; the Missouri journal page could not be opened on Oct 5, 2026.
The Missouri trial shows the arithmetic of the low-rate program most plainly. Two hundred pounds of 580-ENM pellets is 58 pounds of ENM a year. Six tons of 377-ENM ag lime is 2,262 pounds. At that pace the pellet program takes 39 years to deliver what the recommendation delivered in one pass, by our calculation from the abstract [16]. Iowa State's literature review found the same pattern in older Wisconsin, Michigan, Kansas and Oklahoma work: no difference between sources at equal effective rates, and little pH movement from banded or low-rate pellets [8].
Ground Truth: The Iowa data hold one finding that cuts in the pellets' favor and one that cuts against the standard cost comparison. Iowa's ECCE test rated the pellets correctly but, in the authors' words, overestimated ag lime: by our reading of the 12-month figures, ag lime needed about twice the CCE tonnage to reach the same pH [8]. So the 6.7-to-1 price gap per pound of ECCE in Section 2 is closer to 5.5-to-1 per unit of pH actually moved in the first year. That is a real correction, and it does not come near closing the gap. What a buyer gets from fine grinding is speed in the first few months. The yield record says the crop did not pay for that speed.
4. Dollars per acre to move pH
What's new: Iowa State's side-by-side trial allows a direct cost per acre for a measured pH result, without relying on any state's fineness factors.
Evidence: In that trial, 1 ton CCE of pellets (1.11 tons of product) or 2 tons CCE of ag lime (2.19 tons of product) brought the six-site average to pH 6.0–6.1 at 12 months. Reaching 6.4 took 2 tons CCE of pellets or 4 of ag lime [8].
| Target reached at 12 months | Ag lime, tons/acre | Ag lime, $/acre | Pellets, tons/acre | Pellets at $325 tote, $/acre | Pellets at bulk estimate, $/acre |
|---|---|---|---|---|---|
| Equal yield, 1 ton CCE of either | 1.09 | 33 | 1.11 | 369 | 178–246* |
| pH 6.0–6.1 | 2.19 | 67 | 1.11 | 369 | 178–246* |
| pH 6.4 | 4.38 | 134 | 2.22 | 730 | 348–483* |
Source: Crop Root Zone calculation from Mallarino and Haq, 2017 [8]. Product tons are CCE tons divided by 91.4% CCE for ag lime and 90.1% for pellets. Ag lime at $30.58 a ton delivered and spread [1]. Pellets at the price shown plus $8.15 an acre for dry-bulk spreading [2]. Six-site averages from a mean starting pH of about 5.4; a given field's lime requirement depends on its buffer pH. *Estimated price, see Section 1.
The reduced-rate program can be priced the same way. Two hundred pounds of pellets is $32.50 at the tote price, $40.65 with spreading. At the bulk estimate it is $23 to $30 with spreading. The measured return in Iowa was 3 to 7 bushels of corn on soils that started at pH 5.1 to 5.9 [9]. Dividing cost by response, the 200-pound rate needs corn above $5.81 a bushel to pay at the tote price even at the top of that range, and $3.35 to $4.22 at the bulk estimate. At the bottom of the range it needs $7.81 or more at any price in Section 1.
Ground Truth: The reduced rate is priced off the ag-lime invoice, not the soil test. Sixteen hundred pounds of pellets, the lowest rate that held pH at 6.0 in Iowa, carries 1,424 pounds of ECCE. The same effective pounds from 56%-ECCE ag lime is 1.27 tons, or about $39 an acre delivered and spread. Two hundred pounds of pellets from a tote, spread, is about $41. The two programs cost the same per acre. One returned 13 to 16 bushels of corn in the Iowa trials and the other 3 to 7. A grower comparing per-acre quotes will see parity and conclude the products are equivalent, which is the comparison the 200-pound rate is built to produce.
5. Where pelletized lime pays
What's new: Four situations are usually offered as the case for pellets. Only some survive the numbers.
Evidence:
A one-year lease. The argument is that a tenant should not buy three years of lime for a landlord. But ag lime paid in the first crop in Iowa: the 1-ton CCE rate, about $33 an acre here, added 12 bushels of corn at the three responsive sites of six, and the soybean gain of 6.2 bushels came the following year [8]. A tenant on an acid field is better served by a modest ag-lime rate than by a pellet rate that the same trials show leaves pH where it was. The lease argument holds only where the field's pH is already near target and nothing is needed.
No lime truck within reach. Pellets match ag lime per effective pound only when ag lime costs $206 a ton delivered and spread against the tote price, or $97 to $136 against the bulk estimate, by our calculation from Section 2. Missouri's survey range tops out at $40 [1]. Freight would have to multiply the delivered price several times over.
Small or steep fields. Missouri's guide notes that larger jobs "will often cost less per unit than a similar small job" [1]. We found no public figure for lime-truck minimum loads or small-field surcharges. Where a spreader truck cannot safely work a slope or will not come for five acres, pellets through a farm's own spinner spreader are the available product, and the comparison is against no lime at all. The full effective rate still applies.
Blending with dry fertilizer. This is the strongest case. The spreading pass is already paid for, so the marginal cost is product only. Missouri requires the dealer to guarantee the ENM per ton of the final blend on the sales ticket [11]. Ohio State's guidance accepts pellets as suitable for blending and cautions against surface-applying urea where lime was recently spread (Lentz, Ohio State University, 2014) [17]. A blend rate of 200 pounds supplies about 177 pounds of ECCE. Treat it as partial maintenance against acidification. It does not correct an acid field.
The decision still starts with where the acid acres are. Earlier Crop Root Zone work priced grid sampling at about $8 an acre (TRZ-0240) [20] and showed why liming past the target carries its own recurring cost on manganese-responsive soils (TRZ-0134) [19]. Kentucky's guide works an example in which two ag limes at the same price per ton differ by almost 25% in cost for the same job because of RNV alone [10].
Ground Truth: Ask every lime seller the same three questions: price per ton, guaranteed effective pounds per ton under your state's score, and cost to spread. Divide. If the answer for pellets is under about 3 cents a pound of ECCE, or the quarry-lime answer is over 10, the usual ranking has flipped and pellets are the buy. We found no public price this fall at which that happens. The more common mistake runs the other way: a 250-pound pellet program bought every year at $40 to $50 an acre, on a field whose soil test would be satisfied once, for several years, by the same money in ag lime.
References
- Kientzy, D.; Brown, B., "Custom Rates for Farm Services in Missouri," University of Missouri Extension, G302, revised Mar 2026 (survey fall 2025–winter 2026; "Deliver and spread lime: including lime, per ton" average $30.58, median $32.50, range $20–$40, 6 responses; dry fertilizer single spread $7.97/acre) — https://extension.missouri.edu/publications/g302
- Johanns, A.; Hart, C., "2026 Iowa Farm Custom Rate Survey," Iowa State University Extension and Outreach, Ag Decision Maker File A3-10, FM 1698, revised Mar 2026 (spreading lime $8.30/ton average, $5–$14, 31 responses; dry bulk fertilizer applied $8.15/acre, 59 responses) — https://www.extension.iastate.edu/agdm/crops/pdf/a3-10.pdf
- Ohio Earth Food, "Pelletized Dolomite Lime 50#" product page (50-lb bag $10.75; $9.33 a bag by the ton; 2,000-lb totes $325 per ton), accessed Oct 5, 2026 — https://ohioearthfood.com/products/pelletized-dolomite-lime
- Pierce Milling Inc., Delevan, New York, "Lime & Fertilizer" price page (pelletized lime $7.25 per 40-lb bag; pulverized lime $6.25 per 40-lb bag), updated Aug 14, 2026 — https://piercemilling.com/lime-fertilizer/
- Long Horn Horse & Pet Supply, Maine, "Fertilizer & Lime" 2026 price list (pelletized lime $484.79 per 1.4-ton pallet; pulverized lime $273.00 per 1.4-ton pallet), accessed Oct 5, 2026 — https://longhorn.me/products/fertilizer-lime/
- Strickland, B.; Crouse, K.K.; Hamrick, B., "Getting the Most Bang for Your Buck: Guide for Liming and Fertilizing Wildlife Food Plots," Mississippi State University Extension, P3102, Sep 2023 (bulk aglime $53 per ton; pelletized lime $3.75 per 40-lb bag) — https://extension.msstate.edu/publications/getting-the-most-bang-for-your-buck-guide-for-liming-and-fertilizing-wildlife-food-plots
- Mullen, R.; Diedrick, K., pelletized lime article, C.O.R.N. Newsletter 2009-09, Ohio State University Extension, Apr 14–21, 2009 — https://agcrops.osu.edu/newsletters/2009/09
- Mallarino, A.P.; Haq, M.U., "Evaluation of Agricultural Lime and Pelleted Lime to Increase Soil pH and Crop Yield," Iowa State University, North Central Extension-Industry Soil Fertility Conference proceedings, 2017 — https://www.agronext.iastate.edu/soilfertility/info/Mallarino-Haq%20Aglime-Pelleted%20lime%20article%20NC%20fert%20conf%202017.pdf
- Mallarino, A.P.; Haq, M.U., "Application Rate Strategies to Optimize Use of Pelleted Lime in Corn and Soybean Production," Iowa State University, North Central Extension-Industry Soil Fertility Conference proceedings, 2022 (funding provided by Calcium Products) — https://www.agronext.iastate.edu/soilfertility/info/PelletedLimeNCFertConf2022.pdf
- Ritchey, E.L.; Murdock, L.W.; Ditsch, D.; McGrath, J.M.; Sikora, F.J., "Agricultural Lime Recommendations Based on Lime Quality," University of Kentucky Cooperative Extension Service, ID-163, revised Feb 2025 — https://publications.mgcafe.uky.edu/sites/publications.ca.uky.edu/files/ID163.pdf
- Buchholz, D.D., "Missouri Limestone Quality: What Is ENM?," University of Missouri Extension, G9107, reviewed Sep 2017 — https://extension.missouri.edu/publications/g9107
- Ohio Aggregates & Industrial Minerals Association, "Ohio's Effective Neutralizing Power for Aglime," accessed Oct 5, 2026 — https://oaima.org/aws/OAIMA/pt/sp/aglime_enp
- Peters, J., "FAQs about Liming in Wisconsin," University of Wisconsin–Madison Extension, undated, accessed Oct 5, 2026 — https://cropsandsoils.extension.wisc.edu/articles/faqs-about-liming-in-wisconsin
- Ritchey, E.; Grove, J.; Teutsch, C., "Calcium or Lime? Which Raises Soil pH? A Follow-up," Corn & Soybean News 4(10), University of Kentucky Grain and Forage Center of Excellence, Nov 2022 — https://graincrops.mgcafe.uky.edu/files/cornsoynewsletter2022vol04_iss10_nov.pdf
- Lentz, E.M.; Diedrick, K.A.; Dygert, C.E.; Henry, D.C.; Mullen, R.W., "Soil pH and Corn Grain Yield Response to Low Rates of Pelletized Lime and Typical Aglime," Journal of the NACAA 3(1), 2010 (abstract) — https://nacaa.com/journal/3043c536-3f9a-4784-a90c-f8d7b46fbe77
- Flanary, W.; Chapple, R.; Crawford, J., surface-applied agricultural and pelletized lime in no-till, University of Missouri Extension, Journal of the NACAA 4(2), Nov 2011 (abstract as indexed; the journal page returned an error on Oct 5, 2026, and the article title was not confirmed) — https://nacaa.com.customers.tigertech.net/journal/index.php?jid=113
- Lentz, E., "Pelletized Lime in Production Systems," C.O.R.N. Newsletter 2014-07, Ohio State University Extension, 2014 — https://agcrops.osu.edu/newsletter/corn-newsletter/2014-07/pelletized-lime-production-systems
- Lentz, E.; Culman, S., "Select Lime Source Based on ENP," C.O.R.N. Newsletter 2014-28, Ohio State University Extension, 2014 — https://agcrops.osu.edu/newsletter/corn-newsletter/2014-28/select-lime-source-based-enp
- Crop Root Zone, TRZ-0134, "Lime Costs $30 a Ton and Is Nearly Impossible to Take Back. On Lakebed Soils It Buys You an Annual Manganese Bill."
- Crop Root Zone, TRZ-0240, "A 2.5-Acre Grid Sample Costs About $8 an Acre. Over Four Years, It Pays if It Moves 2 Pounds of Phosphate an Acre a Year."
Disclosures
Crop Root Zone is an independent publication. Nothing here is investment advice. Market calls, where included, reflect the editors' own read and are not a recommendation to buy or sell any security.
A $15 Nematode Seed Treatment Needs 1.2 Bushels of 2027 Soybeans. Across 51 Site-Years, None of Six Products Cut Cyst Nematode Reproduction. Peking Varieties Averaged 1.9 Bushels More in Iowa.
At November 2027 soybeans of $12.56, fluopyram and pydiflumetofen seed treatments need 1.1 to 1.2 bushels; a 51-site-year trial found none of six products reduced nematode reproduction, while Peking varieties out-yielded PI 88788 varieties at seven of nine Iowa State sites in 2025.
Soybean growers pulling post-harvest soil samples this month are also looking at 2027 seed orders, and the order form usually offers a nematode-protectant seed treatment as an add-on. The two chemical options with public price points, fluopyram (ILEVO, BASF) and pydiflumetofen (Saltro, Syngenta), have been costed by University of Nebraska on-farm researchers at $15 and $14 an acre on top of the base fungicide and insecticide package (UNL On-Farm Research, 2020) [2]. November 2027 soybeans settled at $12.56¼ on October 1 (West Plains, accessed Oct 2, 2026) [1]. At that price the treatment has to return 1.1 to 1.2 bushels an acre. The largest standardized public test of these products, 51 site-years in 13 states and one Canadian province, found that none of six reduced soybean cyst nematode (SCN) reproduction, early or season-long (Bissonnette et al., Plant Disease, Jun 2024) [11]. Two weeks ago Iowa State data reported by DTN showed SCN's reproduction on the resistance most varieties carry rising about 2% a year (DTN, Sep 18, 2026) [17]. This piece prices the seed treatment against what replicated trials measured, and against the two cheaper decisions that sit ahead of it: the soil sample and the resistance source.
1. What the treatment costs in 2027 bushels
What's new: No manufacturer or national retailer posts a public per-unit price for these products. The usable public figures come from university on-farm research reports, which state the cost used in their net-return calculations. They are dated, and we treat them as estimates of the 2027 cost.
Evidence: Nebraska's 2017 report priced ILEVO at $10.19 per fluid ounce, or $15.17 an acre at the label rate of 1.18 fl oz per 140,000-seed unit and a 140,000 seeding rate (UNL On-Farm Research, 2017) [3]. Its 2020 report used $15 an acre for ILEVO and $14 for Saltro over a $12 base treatment, at 130,000 seeds an acre [2]. Missouri's strip-trial program analysed ILEVO at $14 and $10 an acre (University of Missouri Extension, accessed Oct 2, 2026) [4]. The biological Clariva (Pasteuria nishizawae, Syngenta) was priced at $21 an acre in a 2014 Nebraska trial planted at 160,000 seeds (UNL On-Farm Research, 2014) [5], and at "about $8 to $10 per acre" above the same package without the nematicide when it launched (Heatherly, MSSOY, Nov 28, 2013) [6]. For the newer biologicals on The SCN Coalition's product list, including Bacillus amyloliquefaciens (Aveo EZ), heat-killed Burkholderia rinojensis (BIOST) and cis-jasmone plus Bacillus (Trunemco) [20], we found no public price at all.
| Line item | $/acre | Bushels to pay at $12.56¼ | Price basis | |
|---|---|---|---|---|
| Fall SCN egg count, one sample per 20 acres | 1.50 | 0.12 | ISU clinic fee $30 per sample, in-state | █░░░░░░░░░ |
| Fall SCN egg count, one sample per 10 acres | 3.00 | 0.24 | As above | █░░░░░░░░░ |
| Clariva add-on, launch estimate | 8.00–10.00* | 0.6–0.8 | Extension estimate, 2013 | ████░░░░░░ |
| Saltro add-on | 14.00* | 1.1 | Nebraska on-farm report, 2020; 130,000 seeds | ███████░░░ |
| ILEVO add-on | 15.00* | 1.2 | Nebraska on-farm reports, 2017 and 2020 | ███████░░░ |
| Clariva, as charged in one trial | 21.00* | 1.7 | Nebraska on-farm report, 2014; 160,000 seeds | ██████████ |
Sources: Iowa State University Plant and Insect Diagnostic Clinic, accessed Oct 2, 2026 [8]; UNL On-Farm Research Network, 2014, 2017, 2020 [2][3][5]; Heatherly, MSSOY, Nov 28, 2013 [6]; CBOT November 2027 soybeans, Oct 1, 2026 settlement via West Plains [1]. *Dated public figures, not re-verified with any retailer for 2027; treat as estimates. Bushels are Crop Root Zone arithmetic, cost ÷ $12.5625, at futures before local new-crop basis, which would raise them. Bars scale bushels; 1.7 bu = 10 blocks, rounded.
For scale, eleven Nebraska on-farm site-years in 2023–2025 put the whole company seed-treatment package at $13.72 to $29.00 an acre (UNL CropWatch, Apr 9, 2026) [7]. In the 2020 Nebraska report the nematode line, at $14 to $15, was larger than the $12 base package it sat on [2].
1.2 bu/acre
What a $15 nematode-protectant seed treatment must return at November 2027 soybeans of $12.56¼, before basis. (Crop Root Zone arithmetic from UNL On-Farm Research, 2020, and the Oct 1, 2026 settlement)
Ground Truth: A 1.2-bushel hurdle is below the resolution of the trials that would have to prove it. Variety-to-variety least significant differences in Iowa State's 2025 SCN trials ran 4.4 to 7.7 bushels with four replications [16]. A grower's own two-strip comparison cannot see 1.2 bushels either. The purchase therefore rests on pooled multi-site evidence, and that evidence, below, splits by disease, not by nematode count.
2. What the replicated trials measured
What's new: The standardized multi-state trial published in 2024 is the only public study that ran six products side by side under one protocol. Its abstract is blunt on nematodes: no seed treatment "offered significant nematode control versus the nontreated check," whatever the starting egg count [11]. On yield it says ILEVO and Saltro "provided more consistent increases in yield over the nontreated check" across SCN environments. The abstract gives no bushel figure, and we could not reach the full text.
Evidence: Iowa State's own program supplies the counts. Across 45 experiments in 2014–2016, Clariva Complete Beans cut the SCN reproductive factor in two and raised yield in five, all strip trials; it lowered yield significantly in three (Bissonnette et al., Plant Health Progress, 2018) [9]. Across 38 low-disease experiments in 2015–2017, ILEVO cut the reproductive factor in five and raised yield in four, by 1.9 to 3.7 bushels. None of the four yield gains came where reproduction fell. Pooled 2015–2016 strip trials showed "a small but significant" 0.8 bushel (Bissonnette et al., Plant Disease, Nov 2020) [10].
| Study | Product | Experiments | Significant SCN reproduction cut | Significant yield gain |
|---|---|---|---|---|
| Iowa State / Iowa Soybean Association, 2014–16 | Clariva Complete Beans | 45 | 2 | 5 (and 3 losses) |
| Iowa State / Iowa Soybean Association, 2015–17 | ILEVO | 38 | 5 | 4 |
| 13 states + one Canadian province, 2019–21 | Six products | 51 site-years | None, any product | ILEVO, Saltro "more consistent"; no bushel figure in abstract |
| Delaware / Maryland, 2020–21 | ILEVO, Saltro, four biologicals | 5 | 0 | 1 |
| Michigan State on-farm, 2016–17 | ILEVO | 11 | Mixed, not tested | 3 |
| Nebraska on-farm, 2014 | Clariva | 1 | Not testable | 0 (63 vs 63 bu) |
| Nebraska on-farm, 2017 | ILEVO | 1 | — | 0 (P = 0.96) |
| Nebraska on-farm, 2020 | ILEVO; Saltro | 1 | 0 (P = 0.53) | ILEVO +3 bu; Saltro 0 |
Sources: Bissonnette et al., 2018, 2020, 2024 [9][10][11]; Kessler and Koehler, Journal of Nematology, 2023 [12]; Michigan State University SMaRT report, 2016–2017 [13]; UNL On-Farm Research Network [2][3][5]. Counts are as stated in each abstract or report; significance levels are the authors' own.
Counting only the multi-experiment studies gives the frequency a buyer should expect.
| Study set | Significant yield gain | Share | |
|---|---|---|---|
| Iowa, Clariva Complete Beans | 5 of 45 | 11% | ████░░░░░░ |
| Iowa, ILEVO, low sudden death syndrome | 4 of 38 | 11% | ████░░░░░░ |
| Mid-Atlantic, six products | 1 of 5 | 20% | ███████░░░ |
| Michigan, ILEVO, fields with sudden death syndrome history | 3 of 11 | 27% | ██████████ |
| All four | 13 of 99 | 13% | █████░░░░░ |
Source: Crop Root Zone arithmetic from [9][10][12][13]. Bars scale the share; 27% = 10 blocks, rounded.
In the one Mid-Atlantic trial with a yield difference, Saltro-treated seed made 56.7 bushels against 42.9 for seed with no treatment of any kind, so the gap includes the base fungicide and insecticide [12]. Its abstract reports no statistical difference among treatments in reproductive factor or in females on roots. A University of Missouri greenhouse test of the same six products found that only ILEVO reduced SCN females, by 59% to 72% per root, and that it also cut root mass 28%; the five others did not differ from the base treatment (Barizon et al., Journal of Nematology, 2025) [15].
Ground Truth: In Iowa's 83 experiments, the nematode was suppressed in seven and yield rose in nine, and the two lists share no experiment that the abstracts identify. A product sold to protect yield by suppressing SCN is not doing it by that route in the field. Whatever a grower is buying at $15, the public record says it is not a season-long reduction in egg numbers, so it should not be counted on to lower the egg count the next soybean crop inherits.
3. The yield response follows sudden death syndrome
What's new: Iowa State's authors describe ILEVO as a fungicide seed treatment for sudden death syndrome (SDS) "that also has nematicidal activity" [10]. Where trials separated the two targets, the money was in the disease.
Evidence: A meta-analysis of more than 200 trials in 12 states and Ontario from 2013 to 2015 estimated a 35% reduction in foliar SDS and a yield gain of 295 kg/ha, or 7.6%, for fluopyram over the commercial base (Kandel et al., Plant Disease, Jun 2018) [14]. That is about 4.4 bushels an acre by our conversion. The same paper found the probability of a yield gain above 80% when disease was high and "very low when the foliar symptoms of the disease were absent." Missouri's strip trials on 20 farms gave the same split: even odds of 3.5 bushels or more on the four farms where SDS was confirmed, and a response unlikely to exceed 1.0 bushel where it was not [4]. Michigan's 11 on-farm trials were placed on fields with an SDS history and averaged 2.8 bushels in 2016 and 1.8 in 2017, with local seed dealers and the product's then-owner contributing to the trials [13].
| Setting | Measured yield response, bu/acre | Value at $12.56¼ | Against a $15 treatment |
|---|---|---|---|
| Iowa strip trials, low SDS, pooled 2015–16 | 0.8 | $10.05 | Short by $4.95 |
| Missouri strips, no SDS confirmed | ≤1.0 | ≤$12.56 | Short |
| Michigan, SDS-history fields, 2017 | 1.8 | $22.61 | Pays |
| Michigan, SDS-history fields, 2016 | 2.8 | $35.18 | Pays |
| Missouri strips, SDS confirmed | ≥3.5 (even odds) | ≥$43.97 | Pays |
| Meta-analysis, 200+ trials, SDS-targeted | ~4.4* | ~$55 | Pays |
Sources: Bissonnette et al., 2020 [10]; University of Missouri Extension strip-trial summary [4]; Michigan State University SMaRT report [13]; Kandel et al., 2018 [14]. Dollar values are Crop Root Zone arithmetic at $12.5625. *Converted from 295 kg/ha at 67.25 kg/ha per bu/acre.
Ground Truth: The field variable that predicts whether this seed treatment pays is the SDS history, not the SCN egg count. On ground that has shown SDS, every public estimate clears 1.2 bushels. On SCN ground without it, the best pooled estimate is 0.8 bushel, two-thirds of the hurdle. A grower ordering the treatment across every acre because the soil test came back positive for SCN is paying the SDS price on fields that will return the SCN response.
4. The resistance source moves more bushels than the seed coating
What's new: Iowa State field data from 2001 through 2023 show SCN's ability to reproduce on PI 88788 resistance rising about 2% a year. The projection is roughly 40% control by the end of the decade and average losses near 9 bushels an acre, about 12% of yield potential. Peking, the only other source in commercial use, is in about 20% of seed offerings [17]. Nine bushels is $113 an acre at the November 2027 settlement, by our arithmetic.
Evidence: Iowa State's 2025 variety report tested 71 resistant varieties and a susceptible check at each of nine infested sites, four replications each. Every site's SCN population reproduced at more than 10% on PI 88788; only Moorhead's did so on Peking (Tylka et al., Iowa State University, Dec 2025) [16]. The report lists each variety's yield and reproductive factor. We averaged them by resistance source.
| Site | Eggs/100 cc at planting | SCN reproduction on PI 88788, % | Peking mean, bu/acre | PI 88788 mean, bu/acre | Difference | Median reproductive factor, Peking / PI 88788 |
|---|---|---|---|---|---|---|
| Fruitland (SE) | 1,097 | 85.7 | 73.5 | 65.0 | +8.5 | 0.65 / 16.25 |
| Oskaloosa (SC) | 3,012 | 49.3 | 71.7 | 68.8 | +2.9 | 0.3 / 1.2 |
| Oelwein (NE) | 4,384 | 62.4 | 75.1 | 72.9 | +2.2 | 0.3 / 0.6 |
| Vinton (EC) | 4,019 | 29.6 | 73.5 | 71.5 | +2.1 | 0.2 / 0.5 |
| Ames (C) | 1,505 | 61.8 | 64.0 | 62.1 | +1.9 | 0.4 / 1.1 |
| Pocahontas (NW) | 3,406 | 66.7 | 69.3 | 67.9 | +1.4 | 0.4 / 0.8 |
| Mason City (NC) | 1,454 | 59.4 | 64.2 | 63.8 | +0.4 | 0.3 / 0.5 |
| Moorhead (WC) | 344 | 53.8 | 78.4 | 79.3 | −0.9 | 1.4 / 1.9 |
| Glenwood (SW) | 3,823 | 46.5 | 85.4 | 86.5 | −1.1 | 0.3 / 0.8 |
| Nine-site average | +1.9 |
Source: Crop Root Zone arithmetic from Tylka et al., "Evaluation of Iowa Soybean Varieties Resistant to Soybean Cyst Nematode 2025," IPM52, Dec 2025, Tables 1–9 [16]. Group means of 22 to 38 Peking and 31 to 48 PI 88788 varieties per site, blends excluded; differences are taken before rounding. These are different varieties, not a paired test of the trait, and the report publishes no significance test by resistance source. A reproductive factor below 1.0 means fewer eggs at harvest than at planting.
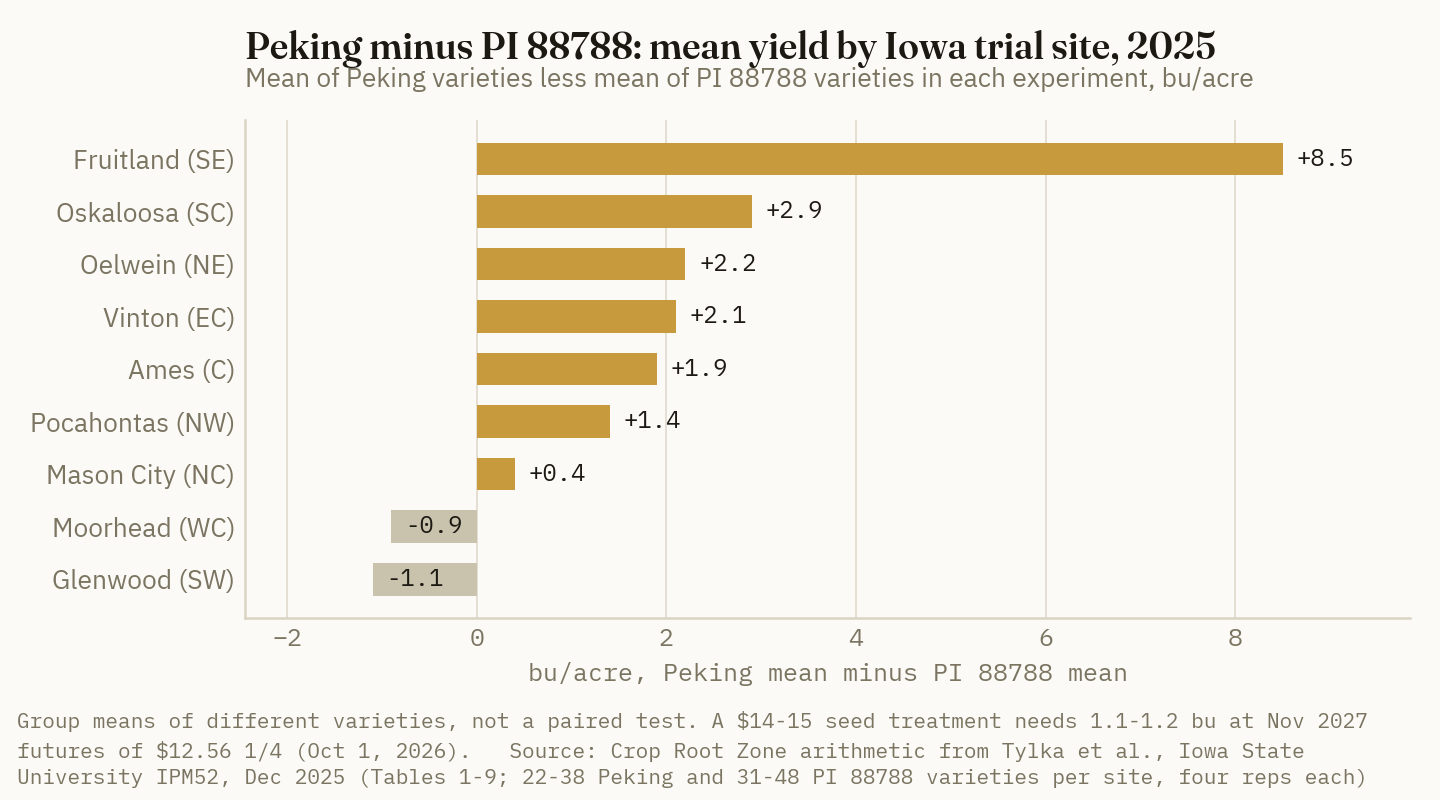
Peking's group mean was higher at seven of nine sites. The average gap, 1.9 bushels, is worth about $24 an acre. Without Fruitland it is 1.1 bushels. At Fruitland, where the population reproduced at 85.7% on PI 88788, the median PI 88788 variety finished the season with sixteen times the eggs it started with, and the gap was $107 an acre. The two sites where Peking trailed are instructive. Moorhead's population already reproduces on Peking at 54.4%. Glenwood's top eight yielders were all PI 88788 varieties. Resistant varieties as a group beat the single susceptible check by 4.0 to 27.4 bushels, site by site. We found no public figure for a seed-price premium on Peking varieties, so the cost side of this switch is open.
Ground Truth: The variety decision does both jobs the seed treatment is sold for. On average it returned more yield in 2025 than the treatment's break-even, and at eight of nine sites the median Peking variety ended the season with fewer eggs than it started with, something no seed treatment did in 51 site-years. The average hides the risk, though. A 1.9-bushel mean built from an 8.5 and two negatives says the payoff depends on which population is in the field, and that is exactly what a fall sample plus an HG type test reports.
5. What to do this fall
What's new: Two products change the 2027–2028 picture without changing this fall's order. Syngenta's Victrato (cyclobutrifluram) is EPA-registered and was offered for the 2026 planting season, subject to state approvals; the company claims 3.3 bushels over a base treatment (High Plains Journal, Nov 14, 2025) [18]. That is a manufacturer figure, and we found no independent multi-state result yet. BASF plans to launch Nemasphere, a transgenic SCN trait, in 2028 [17].
Evidence: Iowa State's clinic charges $30 for an SCN egg count, $35 from out of state, and advises one sample of 10 to 20 cores for every 10 to 20 acres, taken after harvest and before the ground freezes [8]. That is $1.50 to $3.00 an acre, or 0.12 to 0.24 bushel, and it is not an annual cost. The University of Missouri offered four free egg counts per farmer in a program announced in August 2025 (University of Missouri Extension, Aug 25, 2025) [19]; growers should confirm it still runs. Iowa State refers HG type tests, which report how well a population reproduces on PI 88788 and Peking, to the Missouri and Illinois labs [8].
The order of operations follows from the costs. First, sample. A tenth of a bushel buys the number that every later decision depends on. Second, pick the resistance source. Where a population reproduces heavily on PI 88788, a Peking variety is the one input in this review with both a yield and an egg-count result behind it, and Iowa State advises growing Peking in rotation with high-yielding PI 88788 varieties that allow little reproduction [16]. DTN's report of the Iowa State work puts Peking's useful life at 20 years in rotation against 10 if used alone [17]. Third, buy the fluopyram or pydiflumetofen treatment by field, on SDS history. Fourth, treat a biological nematode seed treatment as untested at any price a grower is quoted: across the six products in the multi-state and greenhouse work, none of the biologicals separated from the base treatment on nematodes [11][15], and none has a public price to set a break-even against. Earlier Crop Root Zone coverage found the same pattern for soybean inoculants on ground with a soybean history (TRZ-0225) [21].
Ground Truth: The seed order form asks the questions in the wrong sequence. It offers the $15 line first, on every unit, and leaves the variety's resistance source in the fine print. A grower who reverses the sequence spends $1.50 to $3.00 an acre to learn the egg count, moves the infested fields to the right resistance source, and puts the treatment only on the SDS acres. On a farm where a third of the soybean ground has shown SDS, that cuts the treatment bill by two-thirds, about $10 an acre across all soybean acres by our arithmetic, and keeps the fields where it pays.
References
- West Plains LLC, market quotes for CBOT November 2027 soybeans (ZSX27; prior settle $12.5625, the Oct 1, 2026 settlement), accessed Oct 2, 2026 — https://www.westplainsllc.com/markets.aspx?c=ZSX27&cn=Soybeans
- University of Nebraska–Lincoln, Nebraska On-Farm Research Network, "Evaluating Soybean Seed Treatments for Sudden Death Syndrome in Soybeans," Study 0276185202001, York County, 2020 ($15/acre ILEVO, $14/acre Saltro over a $12/acre base; 8 reps) — https://resultsfinder.unl.edu/sites/unl.edu.ianr.extension.on-farm-research.results-finder/files/pdf/0276185202001.pdf
- University of Nebraska–Lincoln, Nebraska On-Farm Research Network, "Multi-Hybrid Planting for Spatial Soybean Seed Treatments," Study 078155201704, Saunders County, 2017 (ILEVO at 1.18 fl oz per 140,000-seed unit; $15.17/acre, $10.19/oz; 17 reps) — https://resultsfinder.unl.edu/sites/unl.edu.ianr.extension.on-farm-research.results-finder/files/pdf/0078155201704.pdf
- University of Missouri Extension, Strip Trial Program, "ILeVO Trials" (20 Missouri farms, 2017–2018; analysed at $14 and $10/acre), accessed Oct 2, 2026 — https://extension.missouri.edu/programs/strip-trial-program/strip-trials/ilevo-trials
- University of Nebraska–Lincoln, Nebraska On-Farm Research Network, "Clariva Seed Treatment on Soybeans," Study 010053201401, Dodge County, 2014 ($21/acre; 7 reps; 63 vs 63 bu/acre, P = 0.62) — https://resultsfinder.unl.edu/sites/unl.edu.ianr.extension.on-farm-research.results-finder/files/pdf/0010053201401.pdf
- Heatherly, L.G., "New Seed Treatment Combination for Soybeans," Mississippi Soybean Promotion Board (MSSOY), Nov 28, 2013 — https://mssoy.org/articles/new-seed-treatment-combination-soybeans
- Ribeiro, M.; Brhel, J.; Leise, A.; Prochaska, T.J.; Wangila, D.S.; Mangel, D.; McMechan, J., "Cutting Seed Treatment Costs in Midwest Soybean," UNL CropWatch, Apr 9, 2026 — https://cropwatch.unl.edu/cutting-seed-treatment-costs-midwest-soybean/
- Iowa State University Plant and Insect Diagnostic Clinic, "Soybean Cyst Nematode Sample Submission" (egg count $30 in-state, $35 out-of-state), accessed Oct 2, 2026 — https://yardandgarden.extension.iastate.edu/pidc/soybean-cyst-nematode-sample-submission
- Bissonnette, K.M.; Marett, C.C.; Mullaney, M.P.; Gebhart, G.D.; Kyveryga, P.; Mueller, T.A.; Tylka, G.L., "Effects of Clariva Complete Beans Seed Treatment on Heterodera glycines Reproduction and Soybean Yield in Iowa," Plant Health Progress 19:1–8, 2018 — https://doi.org/10.1094/PHP-08-17-0043-RS
- Bissonnette, K.M.; Marett, C.C.; Mullaney, M.P.; Gebhart, G.D.; Kyveryga, P.; Mueller, T.A.; Tylka, G.L., "Effects of ILeVO Seed Treatment on Heterodera glycines Reproduction and Soybean Yield in Small-Plot and Strip-Trial Experiments in Iowa," Plant Disease 104(11):2914–2920, Nov 2020 (abstract via Crossref) — https://doi.org/10.1094/PDIS-06-19-1132-RE
- Bissonnette, K.M.; Barizon, J.; Adee, E.; et al., "Management of Soybean Cyst Nematode and Sudden Death Syndrome with Nematode-Protectant Seed Treatments Across Multiple Environments in Soybean," Plant Disease 108(6):1729–1739, Jun 2024 (abstract via Crossref and the University of Kentucky research portal; full text not reached) — https://doi.org/10.1094/PDIS-02-23-0292-RE
- Kessler, A.C.; Koehler, A.M., "Seed Treatments for Management of Soybean Cyst Nematode, Heterodera glycines, in Mid-Atlantic Soybean Production," Journal of Nematology 55:e2023-1, 2023 (funded by the Maryland Soybean Board and Atlantic Soybean Council) — https://doi.org/10.2478/jofnem-2023-0026
- Michigan State University Extension, SMaRT on-farm research report, "2016 and 2017 ILeVO Seed Treatment Trial" (7 trials in 2016, 4 in 2017; acknowledges local seed dealers and Bayer Crop Science), hosted by MSSOY — https://mssoy.org/sites/default/files/documents/msu-ilevo-2016-2017-opt.pdf
- Kandel, Y.R.; McCarville, M.T.; Adee, E.A.; et al., "Benefits and Profitability of Fluopyram-Amended Seed Treatments for Suppressing Sudden Death Syndrome and Protecting Soybean Yield: A Meta-Analysis," Plant Disease 102(6):1093–1100, Jun 2018 (abstract via Crossref) — https://doi.org/10.1094/PDIS-10-17-1540-RE
- Barizon, J.; Bissonnette, K.; Biggs, M.; Haafke, A.; Bish, M., "Influence of Heterodera glycines Virulence Phenotypes on the Performance of Nematode-Protectant Seed Treatments," Journal of Nematology 57:e2025-1, 2025 (funded by SCN Diagnostics and BASF) — https://doi.org/10.2478/jofnem-2025-0032
- Tylka, G.L.; Gebhart, G.D.; Marett, C.C.; Mullaney, M.P.; Rasmussen, J.T., "Evaluation of Iowa Soybean Varieties Resistant to Soybean Cyst Nematode 2025," Iowa State University Extension and Outreach, IPM52, Dec 2025 (supported by Iowa Soybean Association checkoff funds) — https://faculty.sites.iastate.edu/gltylka/files/inline-files/2025%20ISU%20SCN%20Resistant%20Variety%20Trial%20Report.pdf
- Wilde, M., "Better SCN Management and a New Trait Can Help Combat the Top Soybean Yield Robber," DTN/Progressive Farmer, Sep 18, 2026 — https://www.dtnpf.com/agriculture/web/ag/crops/article/2026/09/18/better-scn-management-new-trait-can
- High Plains Journal, "Vicrato seed treatment to be available for 2026" (headline as published; the product is Victrato), Nov 14, 2025; manufacturer claims — https://hpj.com/2025/11/14/vicrato-seed-treatment-to-be-available-for-2026/
- University of Missouri Extension, "Free SCN tests available to Missouri farmers," Aug 25, 2025 — https://extension.missouri.edu/news/free-scn-tests-available-to-missouri-farmers
- The SCN Coalition, "Nematode-Protectant Seed Treatments" (product list by active ingredient, in order of market introduction), hosted by MSSOY, accessed Oct 2, 2026 — https://www.mssoy.org/sites/default/files/documents/nem-protectant-seed-trt-scn-coal.pdf
- Crop Root Zone, TRZ-0225, "A $2.50 Soybean Inoculant Needs a Fifth of a Bushel to Pay. On Ground That Has Grown Soybeans, Two Decades of University Trials Mostly Can't Find It. On New Ground, Manitoba Found 15."
Disclosures
Crop Root Zone is an independent publication. Nothing here is investment advice. Market calls, where included, reflect the editors' own read and are not a recommendation to buy or sell any security.
Mosaic's New $10 Residue Enzyme Needs 1.9 Bushels of 2027 Corn. Its Best Published Stand Gain Is Worth About 1.5.
At December 2027 corn of $5.17, fall residue products need 1.9 to 4.2 bushels and nitrogen on stalks 5.8 to 7.6. Of seven independent studies that weighed the residue, one found a significant spray effect, at one farm in five.
Mosaic Biosciences launched Renuvis Enzara on August 17. It is an enzyme-based residue digester sprayed on corn and soybean stalks in the fall or spring (Mosaic via Stock Titan, Aug 17, 2026). Trade press reports a suggested retail price of about $10 an acre, sold through Mosaic dealers (The Daily Scoop, Sep 2026). At the September 30 settlement for December 2027 corn, $5.17¼ (West Plains, accessed Oct 1, 2026), the product costs 1.9 bushels of next year's crop if it rides along with another pass. Mosaic says it ran 2025 trials at 91 locations in 21 states. The best result it has published is an improvement in stand establishment of "up to" 5.6% in corn-on-corn and 6.4% in soybeans after corn (Mosaic, accessed Oct 1, 2026). It has not published a yield figure. Two weeks ago this publication reviewed the replicated digester evidence and the harvest-futures break-evens (TRZ-0193). This piece asks the question a buyer faces this month. What must a fall residue pass return in 2027 bushels, and does any independent trial show it doing that? That includes the new enzyme, the older microbial products, and the nitrogen still sprayed on stalks.
1. What a fall residue pass costs in 2027 bushels
What's new: Three kinds of product compete for the same post-harvest pass. Enzara uses endoglucanase enzymes, applied at 16 fluid ounces an acre (AgNavigator, Aug 20, 2026). Mosaic says they work at temperatures as low as 32°F and through freeze-thaw cycles. Microbial digesters such as Meltdown and Biocat 1000 are sold as live consortia or "biocatalysts." The oldest option is plain nitrogen, either UAN or ammonium sulfate, sprayed or spread on stalks to narrow the carbon-to-nitrogen ratio.
Evidence: The new-crop board sets the hurdle. December 2027 corn settled at $5.17¼ and November 2027 soybeans at $12.60 on September 30 (West Plains; Yahoo Finance, accessed Oct 1, 2026). Retail UAN32 averaged $0.74 per pound of N in DTN's September 21–25 survey (DTN, Sep 30, 2026). No Corn Belt USDA report carries an ammonium sulfate price. The nearest public print is a $584/ton FOB distributor ask in Pennsylvania (USDA AMS, Sep 18, 2026).
| Program | Product $/acre | Application $/acre | Applied $/acre | Price basis |
|---|---|---|---|---|
| Renuvis Enzara, tank-mixed | ~10.00 | 0 | ~10.00 | Reported suggested retail, Sep 2026 |
| Renuvis Enzara, own pass | ~10.00 | 8.50* | ~18.50 | As above + ISU ground spraying |
| Meltdown, 32 oz, tank-mixed | 11.00† | 0 | 11.00† | Retailer list, Aug 2021 |
| Meltdown, own pass | 11.00† | 8.50* | 19.50† | As above + ISU ground spraying |
| Biocat 1000, seller's applied figure | 14.75 | 7.00 | 21.75 | Seller's page, accessed Oct 1, 2026 |
| Ammonium sulfate, 75 lb | 21.90 | 8.15* | 30.05 | USDA AMS Pennsylvania ask, $584/ton FOB |
| Ammonium sulfate, 100 lb | 29.20 | 8.15* | 37.35 | As above |
| UAN32, 40 lb N | 29.60 | 9.45* | 39.05 | DTN retail, $0.74/lb N, Sep 21–25 |
Sources: The Daily Scoop, Sep 2026; Renewable Farming, Aug 27, 2021; Midwest Bio-Tech, accessed Oct 1, 2026; USDA AMS Pennsylvania Production Cost Report, Sep 18, 2026; DTN/Progressive Farmer, Sep 30, 2026. *Iowa State 2026 custom-rate averages: ground broadcast spraying $8.50, liquid fertilizer $9.45, dry bulk spreading $8.15 (ISU Ag Decision Maker A3-10, Mar 2026). These are a Crop Root Zone assumption where the seller gives no figure. †The 2021 Meltdown price has not been re-verified; the current distributor page posts no price. The ammonium sulfate row is a conservative estimate for a Midwest buyer.
The enzyme is the cheapest product on the list, and the only one with a 2026 price attached to a launch. The nitrogen programs cost two to four times as much as a tank-mixed biological. That is because nitrogen costs real money per pound, while the biologicals are sold by the ounce.
Ground Truth: The bushel hurdle for a fall residue pass is really two numbers, and the second one decides it. Tank-mixed, Enzara needs under 2 bushels of corn. On its own pass it needs 3.6. A grower with no fall herbicide or fertilizer trip to piggyback on is buying the expensive version, and on that version the product's own claims, below, do not reach the hurdle.
2. What Mosaic has disclosed, in bushels
What's new: The Enzara pitch is not built on decay rates, the claim that sank earlier digesters in replicated trials. Mosaic claims better emergence, stand count and uniformity from spring applications (High Plains Journal, Sep 1, 2026), along with $15 to $20 an acre of "potential operational savings" in fuel, wear and labor. It also says it prevents a residue-related yield drag that it puts at 5 to 10 bushels (Mosaic, accessed Oct 1, 2026). Interviewed at launch, a Mosaic agronomist cited about a 5% reduction in residue organic material in company testing (AgNavigator, Aug 20, 2026). All of these are manufacturer claims. None of the launch materials we found names a university or third-party cooperator.
Evidence: A stand percentage can be converted into yield. Iowa State's replant table puts early-planted corn at 100% of yield potential at 35,000 plants an acre, 98% at 30,000 and 95% at 25,000 (Vittetoe and Anderson, ISU, May 9, 2019). Taking Mosaic's best figure at face value gives the most the stand claim could be worth.
| Mosaic's best stand claim, applied to | Plants/acre, untreated → treated | Yield gain on ISU table | Bushels on 200-bu corn | Enzara break-even, tank-mixed | |
|---|---|---|---|---|---|
| Corn near optimum stand | 33,140 → 35,000 | ~0.7% | ~1.5* | 1.9 | ████████░░ |
| Corn on a thin stand | 28,410 → 30,000 | ~1.0% | ~1.9* | 1.9 | ██████████ |
| Soybeans at or above 100,000 plants | +6.4% | ~0 | ~0* | 0.8 bu soy | ░░░░░░░░░░ |
Sources: Mosaic, Renuvis Enzara page (accessed Oct 1, 2026), "up to" 5.6% corn-on-corn and 6.4% soybean-after-corn stand improvement; Vittetoe and Anderson, ISU Integrated Crop Management, May 9, 2019; Pedersen and De Bruin, ISU, Apr 9, 2007. *Crop Root Zone estimates, interpolated linearly between the ISU table's population points for early planting. Bars scale the corn bushels against the 1.9-bushel tank-mixed break-even; the soybean row is a qualitative zero. They are ceilings, because 5.6% is Mosaic's maximum, not its average.
Iowa State soybean research found that 100,000 plants an acre at harvest reached full yield potential and economic return (Pedersen and De Bruin, ISU, Apr 9, 2007). Above that stand, extra soybean plants add little or nothing. A 6.4% gain in soybean stand pays only on fields where residue pushed the stand well below that level.
~1.5 bu
The most Mosaic's best published corn stand gain is worth on a near-optimum stand, against a 1.9-bushel tank-mixed break-even at December 2027 corn. (Crop Root Zone estimate from Mosaic and Iowa State data, Oct 1, 2026)
The $15 to $20 operational-savings figure is a different kind of claim. It can pay only if the product lets a grower drop something, such as a tillage pass, a row-cleaner adjustment, or a replant. For scale, Iowa's 2026 average custom rate for vertical tillage is $22.15 an acre (ISU Ag Decision Maker A3-10, Mar 2026). Dropping one pass would cover the enzyme even on its own trip. That is a field-by-field outcome a grower can verify. No trial can settle it in advance.
Ground Truth: Mosaic has moved the pitch from decay, which nobody could show, to stand, which is easier to show and worth much less. At the top of its own range, the stand gain roughly covers a tank-mixed application and does not cover a separate pass. The case for Enzara therefore rests on the operational claim: one less tillage trip or a cleaner planter pass. A grower should test that claim directly, not infer it from a stand count.
3. Seven studies that weighed the stalks
What's new: One peer-reviewed decay study that TRZ-0193 did not include repeats the pattern. USDA-ARS scientists at Kimberly, Idaho buried barley, corn and two wheat residues in mesh bags in 2018–19, on the surface and incorporated, at 0, 56 and 112 kg N/ha. Crop type and incorporation changed decay. Fertilizer N did not. The authors concluded that adding N to speed residue decomposition "was not supported" (Rogers et al., USDA-ARS, Dec 7, 2025). Incorporated corn lost the most mass from harvest to spring, 37.2%.
Evidence: Counting every independent study we found that measured residue mass after a spray or fall-N treatment gives the following scorecard.
| Study | Treatment on residue | Scope | Significant decay effect? | Yield or next-crop N effect |
|---|---|---|---|---|
| Iowa State (Al-Kaisi) | UAN32, 0/30/60 lb N | 3 years, field + lab | No | — |
| Univ. of Wisconsin (via Illinois Extension) | Fall N on stover | Field | No | No extra N for next crop |
| USDA-ARS / Colorado (Vigil & Sparks) | UAN32 on wheat residue | Field | No (small, non-significant trend) | — |
| USDA-ARS Kimberly, ID (Rogers et al.) | 0/56/112 kg N/ha, 4 residues | 2018–19 | No | — |
| Missouri, Bradford Research Center | 40 lb/acre liquid N | 4 years | Stover −9%; significance not reported in summary | No yield gain |
| Univ. of Illinois (Vogel & Below) | Extract PBA + UAN; ammonium sulfate | 1 site × 2 years | No (p = 0.19) | No (p = 0.60) |
| Iowa Soybean Association | Meltdown, 32 oz | 5 farms × 1 year | Yes at 1 of 5 farms | None significant; −1.0 bu avg |
Sources: Al-Kaisi, ISU ICM, Apr 4, 2014 and Nov 5, 2019; Farm and Dairy, Sep 18, 2011; Bayer Crop Science summary of Vigil and Sparks (USDA-ARS/NRCS, 1995), accessed Oct 1, 2026; Rogers et al., Agrosystems, Geosciences & Environment 8(4):e70229, Dec 7, 2025; No-Till Farmer (Pioneer summary), Mar 28, 2012; Vogel and Below, Agronomy 9(10):567, Sep 20, 2019; Iowa Soybean Association, Mar 30, 2026.
That is seven studies and one significant decay result from a product, at one farm. The four nitrogen-only studies with stated statistics found no decay effect. The one Missouri result, a 9% stover reduction, comes from a company-relayed summary without published significance and brought no yield gain. Mosaic's Enzara has no entry in this table. It is not yet in any public, independent, replicated trial we could find.
The best-documented exception points somewhere else. In Illinois long-term continuous corn, the yield penalty averaged 2,570 kg/ha with no residue management. Chopping plus broadcast ammonium sulfate cut it by 28.3%, and chopping plus ammonium sulfate plus a microbial blend cut it by 50.7% (Sible et al., SSSAJ, Apr 25, 2024; USDA NIFA and ARS funding). The 2019 Vogel and Below study in the same program acknowledged support from Agricen, which sells Extract PBA, and from Calmer Corn Heads, which sells chopping stalk rolls. In every winning combination the residue was chopped first.
Ground Truth: A grower comparing these products is really comparing evidence of different strength. For fall nitrogen on stalks, the record is consistent and long: no measurable effect on decay. For microbial digesters it is short and mostly negative. For the new enzyme there is no independent record yet. The honest ranking is not which product works best. It is which product has failed in the fewest trials, and the answer is the one that has not been tested.
4. The nitrogen on the stalks is the costliest line and the weakest case
What's new: Fall UAN or ammonium sulfate on stalks costs 5.8 to 7.6 bushels of 2027 corn, the largest bill in the table. The University of Illinois is split on it. The Illinois Agronomy Handbook says research has shown no benefit from fall N on residue, either to speed microbial decomposition or "to improve N availability for the next crop." It names low temperature and dry residue as the limits (Illinois Agronomy Handbook, ch. 9). Extension coverage this spring of the Below lab's continuous-corn work reported that 75 to 100 lb of fall ammonium sulfate has consistently returned break-even or better in that program's trials (farmdoc, Mar 16, 2026).
Evidence: The handbook's general rules on fall N apply to nitrogen on stalks as much as to any other fall N. Fall N should go on only after daily maximum 4-inch bare-soil temperature drops below 50°F. Anhydrous ammonia is the preferred fall source, and urea-containing fertilizers are less effective than fall anhydrous or spring urea, even when incorporated (Illinois Agronomy Handbook, ch. 9). UAN is roughly half urea and half ammonium nitrate (Sawyer, ISU, Apr 14, 2003), so about a quarter of its N is nitrate on the day it is sprayed. Two jurisdictions turn the agronomy into law.
| Jurisdiction | Rule touching fall N on stalks | Basis |
|---|---|---|
| Minnesota | Fall and frozen-soil N restricted from Sep 1 in vulnerable groundwater areas and high-nitrate DWSMAs | Groundwater Protection Rule, Part 1 |
| Manitoba | No N- or P-bearing synthetic fertilizer applied Nov 10 – Apr 10 | Nutrient Management Regulation, M.R. 62/2008 |
| Illinois | No fall N for corn south of roughly Route 16; nitrate-free forms only where fall N is acceptable | Agronomy Handbook guidance (not law) |
| Ontario | Major portion of corn N advised in spring; fall application not advised due to loss potential | OMAFRA Agronomy Guide (not law) |
Sources: Minnesota Department of Agriculture, Groundwater Protection Rule, accessed Oct 1, 2026; Manitoba Environment and Climate Change, Nutrient Management Regulation, accessed Oct 1, 2026; Illinois Agronomy Handbook, ch. 9 (excerpt via Illinois Fertilizer & Chemical Association); OMAFRA Agronomy Guide for Field Crops via Field Crop News, Apr 2021.
The disagreement inside Illinois is narrower than it first looks. The Below lab's favorable results come from long-term continuous corn with chopped residue, which is the system with the largest penalty to recover. The handbook's verdict covers the general case: N sprayed on standing or rolled stalks in a corn-soybean rotation. A 100-lb ammonium sulfate pass supplies 21 lb of N and 24 lb of sulfur. A grower who already budgets sulfur for corn may count part of the cost against that need, which narrows the hurdle. A grower spraying UAN on stalks has no such offset.
Ground Truth: Fall N on stalks is two decisions sold as one. If the grower counts it toward next year's corn rate, it is the riskiest N on the farm: it goes on warm, a quarter of it is nitrate, and it is illegal in parts of Minnesota and after November 10 in Manitoba. If the grower does not count it, it is a 7.6-bushel add-on that four sets of decay measurements say does not speed decay. Either way, the same $39 buys 40 lb of N as spring-applied product that the crop will actually use.
5. What to do with this fall's residue
What's new: Harvest is pushing into the weeks when this decision is made, and the soil calendar has not changed. TRZ-0193 found that 4-inch soils at four Iowa State stations averaged 45.1°F over November 1–15 in 2015–2025, below the 50°F threshold Iowa State cites for active residue decomposition. Mosaic's 32°F claim for Enzara is the first product pitch built around that cold window rather than ignoring it. It remains a manufacturer claim.
Evidence: The figure below sets out each program's corn break-even at December 2027 futures. Keep one number beside it: the only yield average this review could attach to a fall-applied residue product is the Iowa Soybean Association's −1.0 bushel after Meltdown, measured in the following soybean crop.
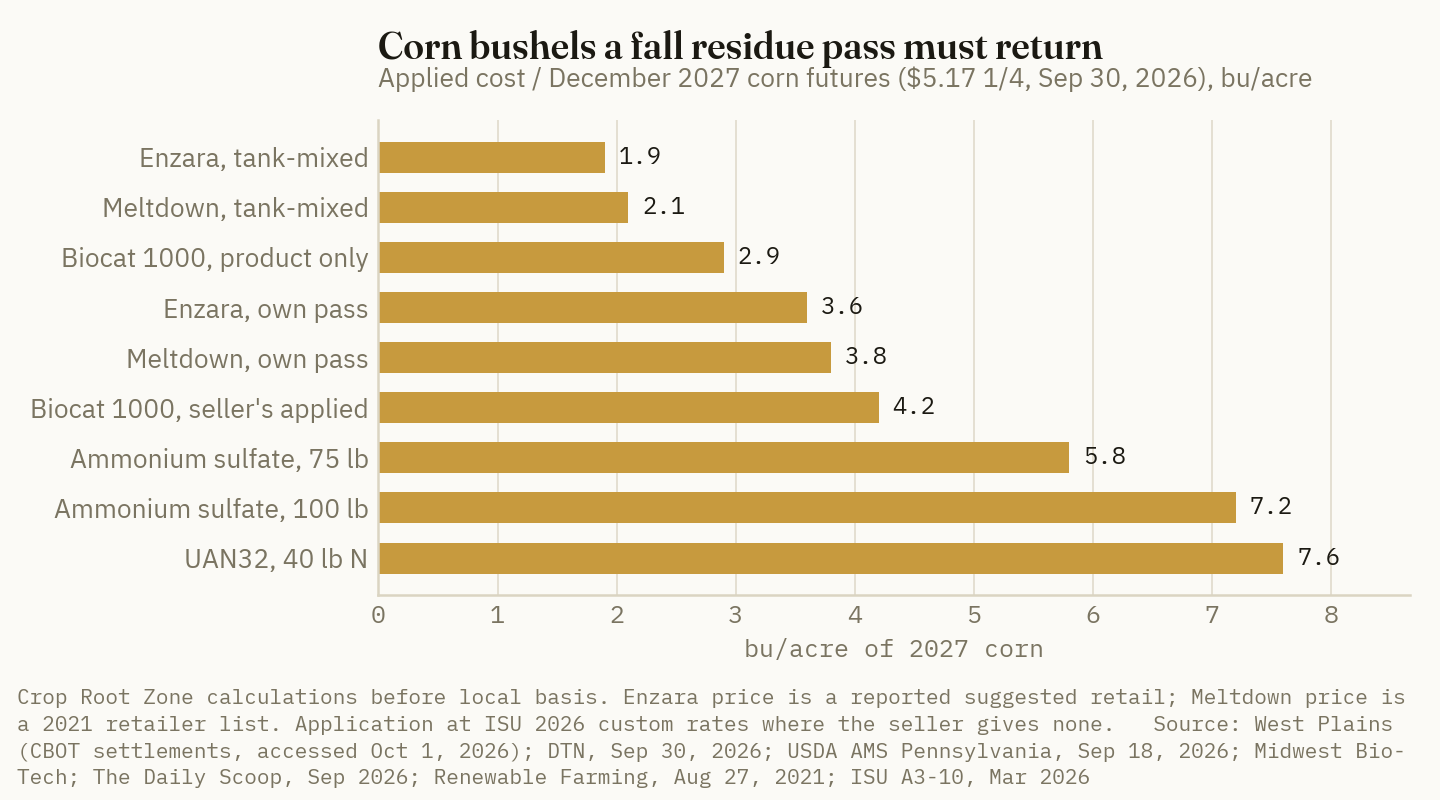
| Program | Applied $/acre | Corn bu, Dec '27 $5.17¼ | Soybean bu, Nov '27 $12.60 | |
|---|---|---|---|---|
| Enzara, tank-mixed | ~10.00 | 1.9 | 0.8 | ███░░░░░░░ |
| Meltdown, tank-mixed | 11.00† | 2.1 | 0.9 | ███░░░░░░░ |
| Biocat 1000, product only | 14.75 | 2.9 | 1.2 | ████░░░░░░ |
| Enzara, own pass | ~18.50 | 3.6 | 1.5 | █████░░░░░ |
| Meltdown, own pass | 19.50† | 3.8 | 1.5 | █████░░░░░ |
| Biocat 1000, seller's applied | 21.75 | 4.2 | 1.7 | ██████░░░░ |
| Ammonium sulfate, 75 lb | 30.05 | 5.8 | 2.4 | ████████░░ |
| Ammonium sulfate, 100 lb | 37.35 | 7.2 | 3.0 | ██████████ |
| UAN32, 40 lb N | 39.05 | 7.6 | 3.1 | ██████████ |
Sources: futures settlements Sep 30, 2026 (West Plains; Yahoo Finance, accessed Oct 1, 2026); costs as in the Section 1 table. Bushels are Crop Root Zone calculations at futures, before local new-crop basis, which in most of the Corn Belt would raise them. †2021 retailer price, not re-verified. Bars scale corn bushels; 7.6 bu = 10 blocks, rounded.
Three rules follow from the arithmetic and the evidence. First, size the residue at the combine. Chopping is the one practice in this review with replicated, significant decay effects, and on Iowa custom rates a chopping head costs less than a bushel of corn more than standard combining (TRZ-0193). Second, keep fall nitrogen off the stalks. It is the most expensive pass on the list and has the most consistent null record. In parts of Minnesota and Manitoba it is restricted outright. Third, if Enzara or any digester goes on this fall, run it as a trial, not a program. Ride it with a pass the field is getting anyway. Leave at least four untreated strips the width of the planter. Count residue cover and stand at planting, weigh yield in the fall, and record which spring trips were actually skipped.
Ground Truth: A grower should set the stop rule before the product goes on. On tank-mixed Enzara, the treated strips need about 2 bushels of corn, or a tillage pass that was demonstrably not needed, to justify 2027 acres. If the 2026 Iowa Soybean Association strips, which are already in the ground, or the first independent Enzara results show the same thing the 2025 strips did, the test ends there.
References
- Mosaic Biosciences, "Mosaic Biosciences Launches New Product to Accelerate Crop Residue Breakdown and Improve Spring Field Readiness," press release Aug 17, 2026, via Stock Titan — https://www.stocktitan.net/news/MOS/mosaic-biosciences-launches-new-product-to-accelerate-crop-residue-oso4j4bnt3bd.html
- Mosaic, Renuvis Enzara retail product page (91 locations, 21 states; "up to" 5.6% and 6.4% stand improvement; $15–20/acre potential operational savings; 5–10 bu/acre yield drag; manufacturer claims), accessed Oct 1, 2026 — https://www.cropnutrition.com/retail/enzara-ready/
- The Daily Scoop, "Residue Digester ROI: When $10 an Acre Pencils Out," Sep 2026 (suggested retail about $10/acre, sold through Mosaic dealers; full article blocked to automated access, figure taken from the publication's headline and search summary) — https://www.thedailyscoop.com/news/new-products/residue-digester-roi-when-10-acre-pencils-out
- Daily, R., "Managing short-stature corn residue: Mosaic Biosciences launches Renuvis Enzara," AgNavigator, Aug 20, 2026 (16 fl oz/acre; company testing ~5% residue organic-matter reduction) — https://www.agnavigator.com/Article/2026/08/20/managing-short-stature-corn-residue-mosaic-biosciences-launches-renuvis-enzara/
- High Plains Journal staff, "Mosaic launches residue management tool," Sep 1, 2026 — https://hpj.com/2026/09/01/mosaic-launches-residue-management-tool/
- West Plains LLC, market quotes for CBOT December 2027 corn (ZCZ27, prior settle $5.1725) and November 2027 soybeans (ZSX27, prior settle $12.60), accessed Oct 1, 2026 — https://www.westplainsllc.com/markets.aspx?c=ZCZ27&cn=Corn ; https://www.westplainsllc.com/markets.aspx?c=ZSX27&cn=Soybeans
- Yahoo Finance, Soybean Futures Nov-2027 (ZSX27.CBT) historical prices (Sep 30, 2026 close 1,260.00), accessed Oct 1, 2026 — https://finance.yahoo.com/quote/ZSX27.CBT/history/
- DTN/Progressive Farmer, "Anhydrous Leads Fertilizer Prices Higher, Up 25% From a Year Ago," Sep 30, 2026 (retail survey Sep 21–25, 2026; UAN32 $479/ton, $0.74/lb N) — https://www.dtnpf.com/agriculture/web/ag/crops/article/2026/09/30/anhydrous-leads-fertilizer-prices-25
- USDA AMS, Pennsylvania Production Cost Report (Bi-Weekly), Sep 18, 2026 (ammonium sulfate distributor ask $550–$610, average $584/ton FOB) — https://www.ams.usda.gov/mnreports/ams_3726.pdf
- Midwest Bio-Tech, Biocat 1000 product page ($14.75/acre product, $7 application, $21.75 total; manufacturer claims), accessed Oct 1, 2026 — https://midwestbio-tech.com/crop-products/biocat-1000/
- Renewable Farming, "Our favorite way to melt down cornstalks for your 'second harvest' of valuable crop nutrients," Aug 27, 2021 — https://renewablefarming.com/our-favorite-way-to-melt-down-cornstalks-for-your-second-harvest-of-valuable-crop-nutrients/
- Iowa State University Extension and Outreach, Ag Decision Maker File A3-10, "2026 Iowa Farm Custom Rate Survey," Mar 2026 — https://www.extension.iastate.edu/agdm/crops/pdf/a3-10.pdf
- Vittetoe, R. and Anderson, M., "Evaluating Corn Stands," Iowa State University Integrated Crop Management, May 9, 2019 — https://crops.extension.iastate.edu/cropnews/2019/05/evaluating-corn-stands
- Pedersen, P. and De Bruin, J., "How many seeds does it really take to get 100,000 plants per acre at harvest?," Iowa State University Extension, Apr 9, 2007 — https://crops.extension.iastate.edu/encyclopedia/how-many-seeds-does-it-really-take-get-100000-plants-acre-harvest
- Rogers, C.W.; Thurgood, G.; Dari, B.; Sihi, D.; Marshall, J.M., "Barley, corn, and wheat residue decomposition as affected by tillage and nitrogen rate in semi-arid conditions," Agrosystems, Geosciences & Environment 8(4):e70229, Dec 7, 2025 (USDA-ARS publication record read; publisher page blocked automated access) — https://www.ars.usda.gov/research/publications/publication/?seqNo115=423852
- Al-Kaisi, M., "Myths and Facts about Residue Breakdown," Iowa State University ICM, Apr 4, 2014 — https://crops.extension.iastate.edu/cropnews/2014/04/myths-and-facts-about-residue-breakdown ; "Corn Residue Breakdown as Affected by Tillage and N Application," Nov 5, 2019 — https://crops.extension.iastate.edu/cropnews/2019/11/corn-residue-breakdown-affected-tillage-and-n-application
- Farm and Dairy, "Do fall nitrogen applications break down corn stover, or just waste money?" (University of Illinois Extension, reporting University of Wisconsin research), Sep 18, 2011 — https://www.farmanddairy.com/news/do-fall-nitrogen-applications-break-down-corn-stover-or-just-waste-money/29616.html
- Bayer Crop Science, "Should I Apply Nitrogen to Break Down Corn Residue?" (literature summary citing Vigil and Sparks, USDA-ARS/NRCS, 1995; no Bayer trial data), accessed Oct 1, 2026 — https://www.cropscience.bayer.us/articles/bayer/should-i-apply-nitrogen-to-break-down-corn-residue
- No-Till Farmer, "Residue Management: Partial Stover Harvest Increases No-Till Yield" (source: Pioneer Hi-Bred; Bradford Research and Extension Center, Columbia, MO), Mar 28, 2012 — https://www.no-tillfarmer.com/articles/1768-residue-management-partial-stover-harvest-increases-no-till-yield
- Vogel, A.; Below, F.E., "Residue and Agronomic Management to Reduce the Continuous Corn Yield Penalty," Agronomy 9(10):567, Sep 20, 2019 — https://www.mdpi.com/2073-4395/9/10/567
- Iowa Soybean Association, 2025 BW Fusion Meltdown cross-site on-farm trial report, Mar 30, 2026 — https://www.iasoybeans.com/PDFLibraryUploads/2025_BW_Fusion_CrossSite_3_30_26.pdf
- Sible, C.N.; Kent, A.D.; Margenot, A.J.; Below, F.E., "Long-term continuous maize: Impacts on the soil microbiome and implications for residue management," Soil Science Society of America Journal 88(4):1109–1126, Apr 25, 2024 (funding: USDA NIFA NC1200; USDA ARS ILLU-802-904; abstract via Crossref) — https://doi.org/10.1002/saj2.20681
- University of Illinois, Illinois Agronomy Handbook, Chapter 9, "Managing Nitrogen" — fall application excerpt, via Illinois Fertilizer & Chemical Association — https://www.ifca.com/files/Fall%20N%20Timing%20Illinois%20Agronomy%20Handbook.pdf
- Gleason, T., "Cost-Effective Strategies for Tackling Crop Residue," farmdoc, University of Illinois, Mar 16, 2026 (page unavailable on Oct 1, 2026; content from search summary and TRZ-0193 review) — https://farmdoc.illinois.edu/field-crop-production/cost-effective-strategies-for-tackling-crop-residue.html
- Sawyer, J., "Pay attention to management needs of fertilizer products," Iowa State University Extension (IC-490), Apr 14, 2003 — https://crops.extension.iastate.edu/encyclopedia/pay-attention-management-needs-fertilizer-products
- Minnesota Department of Agriculture, "Groundwater Protection Rule" (Part 1 fall nitrogen restrictions, beginning Sep 1 each year), accessed Oct 1, 2026 — https://www.mda.state.mn.us/nfr
- Manitoba Environment and Climate Change, "Nutrient Management Regulation" (winter application prohibition Nov 10 – Apr 10), accessed Oct 1, 2026 — https://www.manitoba.ca/sd/water/lakes-beaches-rivers/nutrient_management/
- Field Crop News / OMAFRA, "Agronomy Guide for Field Crops: Corn Fertility — Nitrogen," Apr 2021 — https://fieldcropnews.com/2021/04/agronomy-guide-for-field-crops-corn-fertility-nitrogen/
- Crop Root Zone, TRZ-0193, "Replicated Trials Weighed Corn Stalks After a Residue Digester at Six Sites. One Showed Significantly Less Residue.," Sep 15, 2026 (Iowa Environmental Mesonet soil-temperature analysis; chopping-head custom rates).
Disclosures
Crop Root Zone is an independent publication. Nothing here is investment advice. Market calls, where included, reflect the editors' own read and are not a recommendation to buy or sell any security.
A $15.50 Wheat Nitrogen Biological Must Return 2.3 Bushels or 21.5 Pounds of Urea N. Independent Trials Found a Significant Yield Gain in 1 of 10 Site-Years.
At $6.70 Kansas wheat, a $15.50/acre N biological must return 2.3 bushels or 21.5 lb urea N. Independent trials: a significant yield gain in 1 of 10 site-years, none on protein. No independent, replicated North American winter wheat trial exists.
Pivot Bio said on September 28 that it has "significantly expanded" production of RETURN, its seed-applied nitrogen-fixing microbe for wheat, for this fall's winter wheat seeding (Pivot Bio via Business Wire, Sep 28, 2026). A retailer that sells it repeats the company's claim that RETURN replaces "up to 25 lbs/acre" of synthetic nitrogen (AgWorx, accessed Sep 30, 2026). Foliar products such as Corteva's Utrisha N and Azotic's Envita are sold for spring application to the same wheat. The arithmetic is simple. Kansas country elevators bid $6.63 to $6.83 for ordinary-protein hard red winter wheat on September 29 (USDA AMS Kansas Daily Grain Bids, Sep 29, 2026). Retail urea averaged $0.72 per pound of N in mid-September and anhydrous $0.58 (DTN, Sep 23, 2026). A product that costs $15.50 an acre has to return 2.3 bushels or about 21.5 pounds of urea-equivalent N. The question this piece answers is whether any independent trial shows a wheat biological doing either. For corn, this publication has already covered the evidence (TRZ-0041, TRZ-0117) and the N-price arithmetic (TRZ-0187). Wheat is different in one important way: its break-even is large enough for a field trial to measure.
1. What is on offer, and what it costs
What's new: Three product types are marketed to wheat growers. The first is a foliar Methylobacterium symbioticum, sold as Utrisha N (Corteva) and BlueN elsewhere. Corteva's U.S. label timing for wheat is "4 leaf to jointing after winter dormancy" at 5 oz an acre (Corteva, accessed Sep 30, 2026). For winter wheat, that is a spring pass. The second is Envita, a Gluconacetobacter diazotrophicus sold by Azotic North America and tested in wheat as a foliar spray. The third is RETURN, a gene-edited microbe coated on seed and applied at planting. Pivot Bio says it "colonize[s] the roots" and supplies N "throughout the crop's early growth" (Pivot Bio, Sep 28, 2026). The company does not name the species on its wheat page or in the release. Neither the release nor the product page gives a wheat yield figure, a trial count or a price (Pivot Bio, accessed Sep 30, 2026). Pivot's pricing page directs buyers to a sales representative. Its figures are posted as images, which this publication could not load because the site's security service blocked the request.
Evidence: Public U.S. list prices for 2026 are not published for any of these products. The best public figures come from the Canadian farm press in 2023. Alberta's Plot2Farm trials priced Envita at $12.50 an acre and Utrisha N at $12.95 (GrainsWest, Jan 4, 2023). Corteva representatives quoted Utrisha N at a sticker price of $15.50 an acre, plus $7 to $12 an acre if it needs its own application pass (Manitoba Co-operator, Feb 22, 2023). The table below treats those figures as estimates and converts them to Kansas wheat terms. For a separate pass, it uses the 2026 Kansas average custom rate for ground-rig spraying, $8.57 an acre (Kansas Department of Agriculture and K-State, Kansas Custom Rates 2026).
| Program (estimate) | $/acre | Bu to pay at $6.70 | lb N to pay, anhydrous $0.58 | lb N to pay, urea $0.72 | lb N to pay, UAN28 $0.76 |
|---|---|---|---|---|---|
| Envita, 2023 Alberta trial cost* | 12.50 | 1.9 | 21.6 | 17.4 | 16.4 |
| Utrisha N, 2023 Alberta trial cost* | 12.95 | 1.9 | 22.3 | 18.0 | 17.0 |
| Utrisha N, 2023 sticker price* | 15.50 | 2.3 | 26.7 | 21.5 | 20.4 |
| Sticker price + own ground pass | 24.07 | 3.6 | 41.5 | 33.4 | 31.7 |
| RETURN (seed-applied) | Not published | — | — | — | — |
Sources: GrainsWest (Jan 4, 2023); Manitoba Co-operator (Feb 22, 2023); Kansas Custom Rates 2026, ground-rig herbicide application, state average; USDA AMS Kansas Daily Grain Bids, country elevator US #1 HRW ordinary protein, $6.63–$6.83 (Sep 29, 2026), $6.70 used; DTN retail fertilizer survey, $/lb N, week of Sep 14–18 (Sep 23, 2026). *2023 Canadian press prices, not converted for currency or inflation. They are used as an order-of-magnitude estimate because no 2026 U.S. list price is public. Break-evens calculated by Crop Root Zone.
Kansas harvested 51.0 bushels an acre of winter wheat in 2025. USDA's August forecast puts the drought-hit 2026 crop at 33.0 (USDA NASS, Crop Production, Aug 12, 2026). A 2.3-bushel break-even is therefore 4.5% of a normal Kansas crop and 7.0% of this year's. Oklahoma's 2026 forecast of 28.0 bushels puts the same bar at 8.3%. For comparison, a similar product on 200-bushel corn needs about 1% to 1.5%.
Ground Truth: In corn, a biological's break-even is usually smaller than a field trial can detect, so a null result proves little. Wheat is the opposite case. On 35- to 50-bushel dryland wheat, a $15 product needs a 4.5% to 8% response, and well-run small-plot wheat trials can see that. The Alberta Claresholm trial reported a 5% coefficient of variation. So when replicated wheat trials report no significant gain, that is real evidence against paying for the product, not just a failure to measure.
2. Paying in bushels or paying in pounds of N
What's new: These products are sold on two claims: extra yield, or N that lets the grower cut the fertilizer rate. At September prices, a bushel of $6.70 wheat buys 9.3 pounds of urea N or 11.6 pounds of anhydrous N. K-State's wheat recommendation budgets 2.4 pounds of N per bushel of yield goal before credits (K-State, Wheat Fertility, D. Mengel). A grower with a 50-bushel goal is therefore budgeting about 120 pounds of N before soil and organic-matter credits. A 25-pound displacement would be about a fifth of that.
Evidence: The table below prices RETURN's claimed maximum at each retail N source. It is set against the reported $15.50 foliar sticker price because RETURN's own price is not public.
| What 25 lb N is worth at retail | $/acre | |
|---|---|---|
| UAN28 at $0.76/lb N | 19.00 | ██████████ |
| Urea at $0.72/lb N | 18.00 | █████████░ |
| UAN32 at $0.72/lb N | 18.00 | █████████░ |
| Utrisha N reported sticker price (for scale) | 15.50 | ████████░░ |
| Anhydrous at $0.58/lb N | 14.50 | ████████░░ |
Sources: DTN retail fertilizer survey, week of Sep 14–18, 2026 (Sep 23, 2026); "up to 25 lbs/acre" is a manufacturer claim relayed by AgWorx (accessed Sep 30, 2026); sticker price from Manitoba Co-operator (Feb 22, 2023). Bars scaled to $19.00 = 10 blocks.
The claim is phrased as "up to" 25 pounds. At the most generous reading, the N is worth $14.50 to $19.00 an acre. That only covers a mid-teens product if the grower actually applies 25 fewer pounds and loses no yield. A grower who keeps the full N rate and treats the microbe as a yield add-on is paying in bushels, and must find 2 or more of them. The N-price dependence was the subject of TRZ-0187. In wheat the spread is the same: the grower whose base program is anhydrous, the cheapest N on the sheet, gets the lowest displacement value.
Ground Truth: A wheat biological can only pay through displaced N if the grower cuts N. That makes the fall seeding decision the real commitment. A grower who plants RETURN-coated seed this month and then applies the full spring topdress has turned an N-replacement product into a yield bet. That bet needs 2 or more bushels on a crop that may not reach 40.
3. What the independent wheat trials show
What's new: The independent, replicated wheat record for these products in North America comes from North Dakota State University and Alberta's farmer-funded Plot2Farm program. All of it is spring wheat. NDSU's latest summary covers Utrisha and Envita, foliar-applied at the end of tillering (Feekes 5), over five site-years at Carrington and Minot from 2023 to 2025, across N rates from 0 to 150 pounds. Only the 2024 Carrington site showed a significant gain, at the 60-pound N rate: 5.4 bushels for Utrisha and 11 for Envita. The other site-years showed no meaningful response, and "no protein response" was found anywhere (NDSU, Yuja, Apr 9, 2026). Earlier NDSU work at Minot in 2022 tested MicroAZ-ST (a seed-applied inoculant, dry and liquid) and Envita at three foliar timings. It found "no spring wheat yield benefit to the use of any additive" and no protein change (NDSU SF2080, Franzen, Apr 2023). Alberta Plot2Farm ran four farm trials of Utrisha N and Envita in 2022 and found no significant yield or quality differences (GrainsWest, Jan 4, 2023). At the Claresholm site, the check yielded 46.3 bushels, Utrisha N 47.1 and Envita 46.8 (p = 0.80). Protein was 14.6%, 14.6% and 14.7% (Alberta Wheat & Alberta Barley, Plot2Farm 2022).
1 of 10
Independent, replicated North American wheat site-years (2022–2025) in which an N-fixing biological raised yield significantly. That one was at 60 lb N, not at zero N, and none raised protein. (NDSU, Apr 2023 and Apr 9, 2026; Alberta Wheat & Alberta Barley Plot2Farm, 2022)
Evidence: The chart shows every treatment-versus-check difference that these reports publish in bushels.
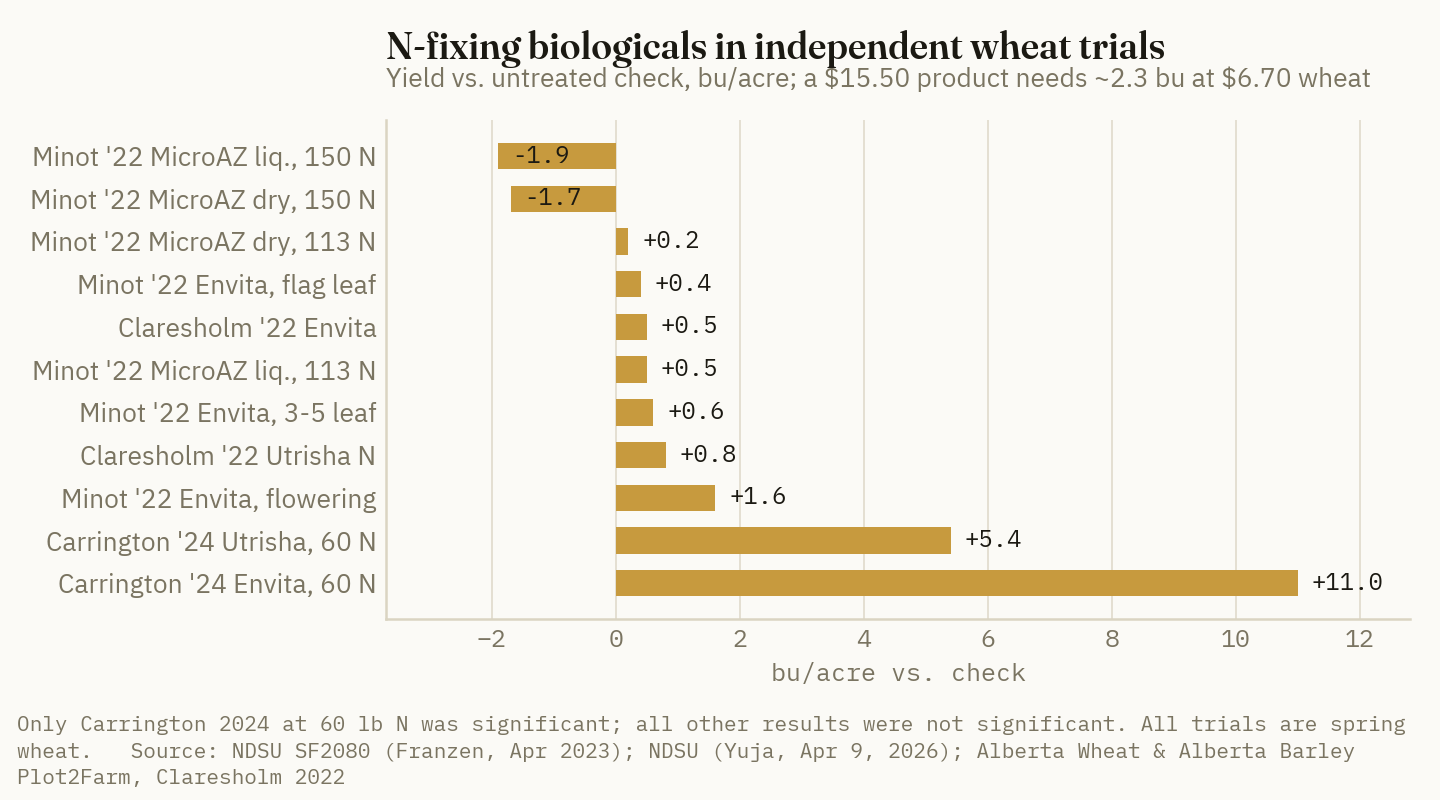
The most useful result is the zero-N test. If a microbe supplied 20 or more pounds of N, the place to see it is a plot that received no fertilizer N, at a site that responds to N. At Carrington in 2023, the N response was weak and leveled off at 30 pounds an acre. Yet "the biological products failed to increase yield even without nitrogen application" (NDSU, Yuja and Bortolon, Dec 2023). A product that supplied 20 to 25 pounds would have captured most of that site's entire N response. It captured none of it.
The wider North Central picture is the same. A ten-state university network ran 61 site-years of N-rate trials with and without Envita, Utrisha, ProveN, ProveN 40, MicroAZ-ST and Bio Red + Bio Mate in corn, spring wheat, sugar beet and canola. Two site-years, both corn, showed a benefit (NDSU SF2080, Apr 2023). Kansas State was one of the participating universities, but the network's wheat trials were in North Dakota.
| Trial | Crop, years | Product(s) | Yield result | Protein | Funding |
|---|---|---|---|---|---|
| NDSU Carrington & Minot | Spring wheat, 5 site-years, 2023–25 | Utrisha, Envita (foliar) | Significant only at Carrington 2024, 60 lb N (+5.4, +11 bu); none at 0 N | No response | ND Wheat Commission; NDSU |
| NDSU Minot | Spring wheat, 2022 | MicroAZ-ST (seed), Envita (foliar) | No effect | No effect | Not stated in summary |
| Alberta Plot2Farm, 4 farms | Spring wheat & durum, 2022 | Utrisha N, Envita (foliar) | No significant difference | No difference | Alberta Wheat & Alberta Barley (grower check-off) |
| Univ. of Padua, Italy | Common wheat, 2022–23, one site | M. symbioticum (foliar), 180 vs 130 kg N/ha | Yield and test weight unaffected | Gluten ratios up | University grants |
| Charles Sturt Univ., NSW, Australia | Winter wheat, one site, one season | M. symbioticum SB23 (foliar) | +14% at 75% N vs 75% N alone | Higher N uptake | Gulbali Institute; one co-author from a private agronomy firm |
Sources: NDSU (Yuja, Apr 9, 2026; Yuja and Bortolon, Dec 2023); NDSU SF2080 (Franzen et al., Apr 2023); GrainsWest (Jan 4, 2023); Alberta Wheat & Alberta Barley Plot2Farm Trial Results 2022; Valente et al., Agriculture 14:1670 (Sep 24, 2024); Fakir et al., Agronomy 16(8):808 (Apr 14, 2026), abstract via Crossref.
Ground Truth: The one positive North Dakota site-year is exactly where a yield gain would be expected: moderately N-limited wheat at 60 pounds, in a year that responded. But the zero-N plots, which test whether the microbe is actually supplying nitrogen, showed nothing at any site. For a buyer, that points to a sometimes-growth effect, not an N supply. A growth effect cannot justify cutting the N rate, and cutting the N rate is the only route by which these products pay reliably.
4. Meta-analyses, manufacturers and the missing winter wheat trial
What's new: No single meta-analysis covers these commercial wheat products. The broadest field-only analysis pooled 171 peer-reviewed studies of microbial inoculants of all types, including N fixers, P solubilizers and mycorrhizae. It found an average yield gain of 16.2%. By climate, the gain was 20.0% in dry climates, 14.9% in tropical, 10.0% in oceanic and 8.5% (±2.4%) in continental climates, the category that includes the northern Plains and the Canadian Prairies (Schütz et al., Frontiers in Plant Science, Jan 12, 2018). The authors report "modest bias" in some groupings, and the study was funded by foundations and an EU research program, not by industry. Cereals, including winter wheat, supplied 86 of the studies. The 8.5% figure is an all-inoculant average, not a result for foliar N fixers.
Evidence: The positive wheat-specific results come from outside North America or from sellers. The strongest peer-reviewed one is the New South Wales winter wheat trial. On 2.3-hectare replicated plots, foliar M. symbioticum SB23 raised grain yield 14% at 75% of standard N, compared with 75% N alone (Fakir et al., Apr 14, 2026). It was one site in one season. The comparison is against a deliberately N-short control, not against full N, and the funder was the university's own institute. The Italian trial of the same organism found yield and test weight "unaffected" at both 180 and 130 kg N/ha (Valente et al., Sep 24, 2024). Corteva's own 2021 Canadian trials, a manufacturer claim, put the wheat gain at 1.1 bushels an acre on average (Manitoba Co-operator, Feb 22, 2023). That is half of the 2.3-bushel break-even in the first table. In 2025 Corteva Australia reported "statistically significant" gains in three large wheat strip trials analyzed by a university-GRDC analytics group, but the release gives no yield figures (Corteva Australia, 2025). Pivot Bio's winter wheat release reports more tillers with heads and more early biomass, with no yield number (Pivot Bio, Sep 28, 2026). These are manufacturer claims.
Crop Root Zone searched Kansas State, Oklahoma State, Nebraska and South Dakota State extension output, the Ontario and Alberta commission trial programs, and the open-access literature. We found no public, independent, replicated North American winter wheat trial of Utrisha N, Envita or RETURN with yield reported. SDSU's September 2026 winter wheat N guide for the 2027 crop discusses rates and prices of $0.70 to $0.80 per pound of N, and does not mention biologicals (SDSU Extension, Sep 14, 2026). Two limits on that search: Oklahoma State's wheat research pages blocked automated access, and one UK on-farm Utrisha N winter wheat report could not be opened. Neither is included here.
Ground Truth: Winter wheat buyers this fall are being asked to act on the thinnest record of any crop these products are sold for. The only winter wheat yield gain in the peer-reviewed literature is one Australian season compared with an N-short check. The largest North American independent record is spring wheat, and it is negative. Until a Plains land-grant university publishes replicated winter wheat data, the fair price for a wheat N biological is the value of the N it has been shown to replace. On current evidence, that is zero.
5. Protein, timing, and how to test it this season
What's new: Protein is the other claim made for these products in wheat, and the one the data show least. None of the NDSU, Alberta or Italian trials raised grain protein. The market also pays little for it. On September 29, Kansas City mill bids for hard red winter wheat were $8.28 for ordinary and 11.0% protein, $8.40 at 12.0%, $8.43 at 13.0% and $8.53 at 14.0%. Kansas country elevators quoted only ordinary protein (USDA AMS Kansas City Board of Trade Daily Wheat Bids; Kansas Daily Grain Bids, Sep 29, 2026).
| KC mill bid, US #1 HRW, Sep 29, 2026 | $/bu | Premium over 11.0% | Value on 50 bu/acre |
|---|---|---|---|
| Ordinary / 11.0% | 8.28 | — | — |
| 12.0% | 8.40 | +0.12 | +$6.00 |
| 13.0% | 8.43 | +0.15 | +$7.50 |
| 14.0% | 8.53 | +0.25 | +$12.50 |
Source: USDA AMS, Kansas City Board of Trade Daily Wheat Bids (report 3223), Sep 29, 2026, midpoints of FOB rail ranges. Per-acre value calculated by Crop Root Zone on an illustrative 50-bushel yield. It assumes the grain reaches a mill that pays the scale.
Even a full one-point protein gain from 11% to 12% is worth about $6 an acre on 50 bushels, less than half the product cost. No independent wheat trial has shown a significant protein gain of any size.
Evidence: Timing is a second concern for fall-applied products. K-State's guidance is that "in almost all situations, N has to be in the root zone of wheat by the jointing stage to have a significant effect on yields" (K-State, Wheat Fertility, D. Mengel). Pivot Bio describes RETURN's supply as running through "early growth." For winter wheat, early growth is fall tillering, followed by a dormant winter, and the company has published no data on how much N the microbe supplies from green-up to jointing. Foliar Utrisha N goes on after dormancy, but its NDSU record at Feekes 5 is the null result in Section 3.
Ground Truth: A grower who wants to try one of these products on winter wheat should design the test to answer the N question, not just the yield question. Leave three strips side by side: full N, full N less 25 pounds, and full N less 25 pounds plus the product. Replicate them at least four times, and add a zero-N strip on one field to show whether the ground responds to N at all. If the reduced-N-plus-product strips do not match full N, the product has not replaced the N. Do not cut this fall's or next spring's N on any field that is not part of that test.
References
- Pivot Bio, "Pivot Bio Expands RETURN® Production for Winter Wheat," Business Wire, Sep 28, 2026 — https://www.financialcontent.com/article/bizwire-2026-9-28-pivot-bio-expands-return-production-for-winter-wheat
- Pivot Bio, RETURN wheat product page (redirects to /wheat), accessed Sep 30, 2026; pricing page (price figures posted as images; blocked by site security, not read) — https://www.pivotbio.com/wheat ; https://www.pivotbio.com/price
- AgWorx, "Pivot Bio" retailer product page (relays manufacturer claim that RETURN "replaces up to 25 lbs/acre of synthetic fertilizer"), accessed Sep 30, 2026 — https://agworxonline.com/pivot-bio/
- USDA AMS Livestock, Poultry and Grain Market News / Kansas Dept. of Agriculture, Kansas Daily Grain Bids (report 2886), Sep 29, 2026 (country elevator US #1 HRW ordinary protein $6.63–$6.83; KCBT Dec 2026 wheat 743.00¢) — https://www.ams.usda.gov/mnreports/ams_2886.pdf
- USDA AMS, Kansas City Board of Trade Daily Wheat Bids (report 3223), Sep 29, 2026 (mill and processor HRW bids by protein) — https://www.ams.usda.gov/mnreports/ams_3223.pdf
- DTN/Progressive Farmer (R. Quinn), "Fertilizer Prices Rise for Six of Eight Major Fertilizers," Sep 23, 2026 (retail survey week of Sep 14–18, 2026: anhydrous $945/ton, $0.58/lb N; urea $659/ton, $0.72; UAN28 $421/ton, $0.76; UAN32 $458/ton, $0.72) — https://www.dtnpf.com/agriculture/web/ag/crops/article/2026/09/23/fertilizer-prices-rise-six-eight
- Corteva Agriscience, Utrisha® N product page (U.S.; 5 oz/acre; wheat timing "4 leaf to jointing after winter dormancy"), accessed Sep 30, 2026 — https://www.corteva.com/us/products-and-solutions/crop-protection/utrisha-n.html
- Epp, M., "Living Proof," GrainsWest, Jan 4, 2023 (Alberta Plot2Farm trial costs: Envita $12.50/ac, Utrisha N $12.95/ac; four 2022 farm trials) — https://grainswest.com/2023/01/living-proof/
- Wichers, G. and Melchior, J., "Search for the holy grail of N fertilizer continues," Manitoba Co-operator, Feb 22, 2023 (Utrisha N sticker price $15.50/ac; application $7–$12/ac; Corteva 2021 wheat trials +1.1 bu/ac) — https://www.manitobacooperator.ca/news-opinion/news/search-for-the-holy-grail-of-n-fertilizer-continues/
- Kansas Department of Agriculture and Kansas State University Land Use Survey Office, Kansas Custom Rates 2026 (ground-rig herbicide application, state average $8.57/ac) — https://www.agmanager.info/sites/default/files/pdf/CustomRates_2026.pdf
- USDA NASS, Crop Production, Aug 12, 2026 (winter wheat yield: Kansas 51.0 bu/ac 2025, 33.0 forecast 2026; Oklahoma 28.0 forecast 2026) — https://esmis.nal.usda.gov/sites/default/release-files/796015/crop0826.txt
- Mengel, D., "Wheat Fertility," Kansas State University Agronomy (2.4 lb N per bushel of yield goal; N in the root zone by jointing) — https://www.sunflower.k-state.edu/agronomy/wheat/wheat_fertility.html
- Yuja, S., "Five site-years of nitrogen fixing biologicals in spring wheat," NDSU Agriculture, Apr 9, 2026 (funded by the North Dakota Wheat Commission and the NDSU Agronomy Program) — https://www.ndsu.edu/agriculture/ag-hub/impact-stories/five-site-years-nitrogen-fixing-biologicals-spring-wheat
- Yuja, S. and Bortolon, L., "Testing Nitrogen Fixing Biologicals in Spring Wheat," NDSU Agriculture, Dec 2023 — https://www.ndsu.edu/agriculture/ag-hub/publications/testing-nitrogen-fixing-biologicals-spring-wheat
- Franzen, D. et al., Performance of Selected Commercially Available Asymbiotic N-fixing Products in the North Central Region, NDSU Extension SF2080, Apr 2023 (61 site-years, 10 states; Minot 2022 wheat tables) — https://www.ndsu.edu/agriculture/extension/publications/performance-selected-commercially-available-asymbiotic-n-fixing-products
- Alberta Wheat & Alberta Barley, "Nitrogen fixing foliar bacteria Utrisha-N™ + Envita® in spring wheat (Willow Creek)," Plot2Farm Trial Results, 2022 trial, Claresholm, Alta. — https://www.albertagrains.com/download/363
- Schütz, L.; Gattinger, A.; Meier, M.; Müller, A.; Boller, T.; Mäder, P.; Mathimaran, N., "Improving Crop Yield and Nutrient Use Efficiency via Biofertilization—A Global Meta-analysis," Frontiers in Plant Science 8:2204, Jan 12, 2018 (open access; funded by Mercator Foundation Switzerland, FiBL and EU FP7 BIOFECTOR) — https://pmc.ncbi.nlm.nih.gov/articles/PMC5770357/
- Fakir, O.A.; Haque, K.M.S.; Wilson, A.; Barrow, R.A.; Ashnest, J.R.; Schmidtke, L.M.; Weston, L.A., "Australian Dryland Wheat Growth and Yield Are Positively Impacted by a Methylobacterium symbioticum Biostimulant Under Reduced Nitrogen Supply," Agronomy 16(8):808, Apr 14, 2026 (funder: Gulbali Institute; co-author A. Wilson affiliated with Viridis Ag; abstract read via Crossref, publisher page not reachable) — https://doi.org/10.3390/agronomy16080808
- Valente, F.; Panozzo, A.; Bozzolin, F.; et al., "Growth, Photosynthesis and Yield Responses of Common Wheat to Foliar Application of Methylobacterium symbioticum under Decreasing Chemical Nitrogen Fertilization," Agriculture 14(10):1670, Sep 24, 2024 (abstract read via Crossref) — https://doi.org/10.3390/agriculture14101670
- Corteva Agriscience Australia, "New trial data confirms Utrisha® N's role in boosting wheat yields in Australian conditions," 2025 (manufacturer release) — https://www.corteva.com/au/media-center/New-trial-data-confirms-Utrisha-Ns-role-in-boosting-wheat-yields-in-Australian-conditions.html
- Winter, C.; Graham, C.; Karki, D., "Winter Wheat and Nitrogen: Decisions for the 2027 Growing Season," SDSU Extension, updated Sep 14, 2026 — https://extension.sdstate.edu/winter-wheat-and-nitrogen-decisions-2027-growing-season
Disclosures
Crop Root Zone is an independent publication. Nothing here is investment advice. Market calls, where included, reflect the editors' own read and are not a recommendation to buy or sell any security.
Discussion
This issue's lead feature prices a $675 urea prepay at 7% money: $25.50 a ton of interest by mid-April and a break-even of $700.50. So: what are you being quoted for spring urea, UAN or anhydrous, is it a full prepay, a deposit or a lock with no money down, what does that money cost you, and have you locked any of it? Tell us also whether your retailer would keep the quote open past Wednesday's India tender, and what barge value the spring price is built on if they would say.
Corrections are as welcome as answers. If you check our arithmetic against a primary source and find we have it wrong, tell us. The sharpest replies get answered in next week's Letters & Responses.