Issue 04 · 2026-08-10
Two producers opened their books this week, and between them they answered a question growers have been asking all summer: if retail nitrogen keeps falling, why does the fertilizer bill still feel like it is going up?
The answer is that the two things are measured at different places in the chain. CF Industries raised its own long-run price assumption for NOLA urea from $355 to $385 a short ton in the same week DTN's retail survey printed anhydrous down 7% on the month. Nutrien went further in the other direction: it booked a negative $31 per tonne gross margin making phosphate while growers paid $914 a ton for DAP, and its chief executive called the market unsustainable. Neither company is describing a demand problem. Both are describing a cost floor set by their own economics — sulfur, ammonia, and the price of building anything new on the Gulf Coast.
That is the thread running through this issue. On the revenue side, corn export commitments have already passed USDA's full-year record forecast. On the input side, the producers who set the price are telling you where it will not go. We think that combination, not any single week's print, is what should shape a 2027 budget.
— Crop Root Zone, Editorial Desk.
Our third issue drew its first substantive piece of reader correspondence, and it arrived with a question sharp enough to set an editorial direction. We are publishing it without the writer's name at our own discretion — the correspondence was private, and the point stands on its merits.
From a reader who has spent a career on the nitrogen side of the trade:
"This is exactly what buyers need — a comprehensive series of comments, charts and comparisons. If I'm a distributor, retail buyer or a farmer, this information is valuable.
For many years I wished I had spent more time trying to link nitrogen values to the crop commodity markets. Farmers can hedge their future crops of corn, soybeans and wheat, but don't have a reliable, consistent way to lock in the cost of their ammonia, urea, UAN and AMS — in other words their nitrogen — at the same time, therefore locking in a portion of their input costs and profits. Also phosphate and potash."
Our reply. This is the most useful thing anyone has said to us so far, and it identifies a real asymmetry rather than a gap in coverage. A grower can price the output side of the 2027 budget on a screen, in a contract month, with a clearing house behind it. There is no equivalent instrument for the input side. What exists instead is prepay — which is a physical commitment to a single retailer at a single price, with no secondary market and no way out. We wrote about that in Issue 02 as a short put, and the description holds: prepay transfers price risk, but it does so by taking on counterparty and delivery risk in exchange.
Why the asymmetry persists is worth stating plainly, because it is not an oversight. Corn is one fungible commodity delivered to one of a few defined points. "Nitrogen" is four chemically different products with different analyses, different handling requirements, different application windows, and a delivered price that varies by more than $200 a ton across regions for the same nutrient — a spread we measured in Issue 03. A contract needs a single deliverable, and nitrogen at the farmgate is not one.
That is an explanation, not a defence. The practical response available now is to price the ratio rather than the input: hedge the crop, then measure the fertilizer bill in bushels rather than dollars, so a fall in corn and a fall in urea are visible as the same event. Two features in this issue do exactly that. It is a workaround, not an instrument — but it is the one a grower can use this season.
We would like to hear from readers who have tried to construct something better, formally or informally. If you have used basis contracts, a supplier-side collar, or anything that behaved like an input hedge, tell us what it cost you and whether it paid.
In This Issue
This week's features, by department.
- Your Anhydrous Fell 7% in a Month. The Producer Just Raised Its Long-Run Price by 8.5%.CF lifted its mid-cycle NOLA urea assumption from $355 to $385 a short ton — and said two-thirds of the raise is the cost of building the next plant, not the cost of running this one.
- You Paid $914 a Ton for DAP. The Company That Made It Lost $31 a Tonne.Nutrien's phosphate segment ran a negative manufactured gross margin in the second quarter while shipping 9% more product — and its chief executive says the market cannot continue as it is.
- UAN32 Fell Twice as Fast as Anhydrous. On a Nitrogen Basis, Anhydrous Still Won.The month's biggest price cut went to the most expensive nitrogen in the country — and the anhydrous discount to urea got wider, not narrower, while everyone watched UAN.
- India Wants 1.7 Million Tonnes on August 11. Your Fall Fill Quote Was Written Before the Tender.The international urea benchmark has turned up 6.8% in a month while US retail printed a seventh straight weekly decline — and RCF's bids open inside the prepay window.
- International Urea Turned Up 16% in a Month. Retail Urea Printed Lower.The export benchmark bottomed in early July and has climbed since while US retail was still working off April's inventory. India's 1.7-million-tonne tender opens August 11 and settles which of the two is telling the truth.
- Corn Export Commitments Have Already Passed USDA's Record Full-Year ForecastTotal commitments stand at 3.429 billion bushels against a 3.325 billion forecast, with weeks left in the marketing year — which makes the August 12 WASDE a revision problem, not a surprise problem.
- The 2027 Acreage Argument Is Being Held in the Fertilizer Column. The Forward Curve Moved Nine Times as Much.A month of falling nitrogen is worth about $8 an acre to corn. The 2027 board has already handed corn roughly $75 — and dropped the new-crop price ratio from 2.55 to 2.35 while the debate stayed on inputs.
- You Have 26 Days on Base Acres and No Date at All on the ElectionThe Aug. 31 base allocation review is the only firm deadline in the 2026 farm program — and ARC's $5.03 corn benchmark is currently worth more than PLC's capped $4.42 reference price.
- The Board Is Paying 12.5 Cents to Carry Corn to March. Commercial Storage Costs About 30 to Reach January.December-to-March carry covers interest and roughly a quarter of a commercial storage bill — which makes 2026 a basis year, not a carry year, and puts the whole return on the bin you already own.
- Cotton Crossed Break-Even on the Screen. USDA Still Says the Farm Price Is 73 Cents.Futures at 82 cents sit inside the 78-83 cent break-even band for the first time in four years, but the July WASDE season-average forecast is nine cents lower and stocks-to-use just went to 29.5% — making this a selling opportunity rather than a margin.
- The Machinery Market Split by Horsepower Class, and Only One Half Is DiscountingAGCO cut its 2026 outlook on weakness in Western Europe, Brazil and North American small ag — while North American sales rose about 20% and it took share in high-horsepower tractors. That divergence tells you where the fall equipment deals are, and where they aren't.
- A 1,000-Gallon Nurse Tank Covers 20 Acres. That Is the Real Price of Cheap Nitrogen.Anhydrous is $0.16 a pound cheaper than urea, but it is only purchasable inside a soil-temperature window and only at the rate a retailer can turn tanks — and the binding constraint is tank turns, not toolbar hours.
- The $5 Diesel Column Was the Stress Test. On August 4 It Became the Base Case.EIA put on-highway diesel at $5.348 — up $1.55 in a year — which turns a well-irrigated rice acre into a $177 pumping bill and makes one conversion ratio, 12.5 kWh per gallon, the most valuable number in the pump house.
- Urea Fell $148 a Ton Since May. DAP Rose a Dollar. Only One of Those Pays for a Building.The seasonal spread that justifies on-farm dry fertilizer storage sits almost entirely in nitrogen — and the shed's real competitor is not the spring price, it is a prepay contract that costs no capital at all.
- America's Biggest New Ammonia Plant Broke Ground This Month. Its Customer Burns Ammonia, Not Spreads It.Blue Point is 1.4 million tonnes a year with better than 95% carbon capture, and the offtake went to a Japanese power company and a trading house — which is why a 2029 startup is not the fertilizer supply relief a 2029 budget wants it to be.
- A Nitrogen Stabilizer Costs 8 Cents a Pound. Anhydrous Nitrogen Costs 59. Do That Division.On conserved fertilizer alone, a fall nitrification inhibitor needs nitrogen above $0.667/lb.N to pay — and anhydrous has never been there in the past year. The whole case rests on 3.1 bushels.
- The Zinc Costs $6 an Acre and Lasts Three Years. The Argument Is Entirely About Which Critical Level You Use.Published critical soil-test zinc levels for corn run from 0.5 ppm to 7 ppm depending on the state and the pH — a fourteenfold spread that decides a 10-to-1 return, while the zinc price decides almost nothing.
- A 22% Potash Product Now Sells at a $93 Premium to a 60% OneIntrepid realized $387/ton on langbeinite against $353 on muriate in the first quarter, and told investors why: buyers are paying for the sulfate, not the potassium. At $705 sulfur, the multi-nutrient minerals stopped being a specialty product.
The week's defining event was not a price print. It was two producers publishing their own economics, and both of them pointing the same direction.
Start with the benchmark table, because the retail series alone tells a misleading story.
| Nutrient | $/ton | MoM | YoY | Basis |
|---|---|---|---|---|
| Anhydrous | 960 | −7% | +26% | Delivered, retail |
| Urea | 686 | −4% | +6% | Delivered, retail |
| UAN32 | 459 | −14% | −8% | Delivered, retail |
| UAN28 | 464 | −8% | +11% | Delivered, retail |
| DAP | 914 | +1% | +12% | Delivered, retail |
| MAP | 958 | — | +8% | Delivered, retail |
| Potash | 494 | — | +2% | Delivered, retail |
| 10-34-0 | 718 | −1% | +7% | Delivered, retail |
Source: DTN/Progressive Farmer retail survey, week ending Jul 31, 2026, published Aug 5, 2026.
Read across, the month says nitrogen is easing and phosphate is not. Read down the year-over-year column and the picture changes: anhydrous is still 26% dearer than a year ago, DAP 12%, and only UAN32 is genuinely below where it started.
Then the producers spoke. CF Industries reported first-half net earnings of $1.34 billion on adjusted EBITDA of $2.18 billion, ran its ammonia plants at roughly 98% of capacity, and raised its baseline mid-cycle EBITDA to about $2.9 billion (CF Industries, Aug 5, 2026). Underneath that sits the number that matters to a fertilizer buyer: the company's long-run NOLA urea assumption moved from $355 to $385 a short ton, with management attributing roughly $20 of the $30 to the cost of building new Gulf Coast capacity and roughly $10 to freight, insurance and logistics that will not snap back (CF Industries Q2 2026 earnings call, Aug 6, 2026). Management expects nitrogen conditions to stay constrained into 2027.
Nutrien said something harder. Its phosphate segment booked a manufactured product gross margin of negative $31 per tonne in the second quarter — while shipping 590,000 tonnes, up from 543,000 a year earlier — and chief executive Ken Seitz stated flatly that "the phosphate market today is completely unsustainable" (Nutrien, Aug 5, 2026). The same company raised full-year potash volume guidance to 14.2–14.8 million tonnes and earned more gross margin on 25% fewer nitrogen tonnes than a year ago.
Put those together and the three nutrients separate cleanly. Potash is comfortable and its producer is selling more of it. Nitrogen is expensive but profitably supplied, by producers running flat out who have just raised their own long-run price deck. Phosphate is the outlier: near-record retail, loss-making at the plant gate, with non-binding bids reportedly on the table for the asset.
The crop side is doing its part. Corn sales commitments including accumulated exports stand at 3.429 billion bushels, up almost 23% year over year and already above USDA's full-year forecast of a record 3.325 billion — with weeks left in the marketing year. Against that, corn conditions fell for a second straight week to 61% good-to-excellent as of August 2, down six points from July 19 (USDA NASS, Aug 3, 2026). Both of those push the balance sheet the same way into Wednesday's WASDE.
The verdict: demand is not the problem this week — the input floor is, and it is being set by producer economics rather than by anything a grower can wait out.
Fertilizer
CF raises its long-run urea assumption to $385/st — CF Industries lifted the NOLA urea price baseline underneath its mid-cycle framework from $355 to $385 a short ton, with management splitting the $30 into roughly $20 of Gulf Coast construction cost and roughly $10 of structural freight, insurance and logistics. Baseline mid-cycle EBITDA moved to about $2.9 billion. (CF Industries Holdings, Q2 2026 earnings call, Aug 6, 2026)
Nutrien's phosphate margin goes negative — The company reported a manufactured product gross margin of negative $31 per tonne in phosphate for the second quarter, on volumes that rose from 543,000 to 590,000 tonnes. Chief executive Ken Seitz: "The phosphate market today is completely unsustainable." (Nutrien Ltd., Aug 5, 2026)
Potash guidance goes up, not down — Nutrien raised full-year potash sales volume guidance to 14.2–14.8 million tonnes on a record first half and better second-half order-book visibility, and trimmed 2026 capital spending to $1.95–2.05 billion. Potash is the only one of the three nutrients whose producer is guiding to more volume. (Nutrien Ltd., Aug 5, 2026)
UAN32 leads retail lower — Five of eight nutrients DTN tracks were cheaper month over month in the week ending July 31, with UAN32 down 14% to $459/ton — the only nitrogen product now below its year-ago level, at −8%. (DTN/Progressive Farmer, Aug 5, 2026)
Crops
Corn commitments pass USDA's own record forecast — Total corn sales commitments including accumulated exports reached 3.429 billion bushels, up almost 23% year over year and above USDA's full-year forecast of a record 3.325 billion, with weeks left in the marketing year. (USDA Foreign Agricultural Service, early Aug 2026)
But the weekly flow went quiet — New 2025-26 corn sales totalled 12.4 million bushels for the week, down 44%. A near-record cumulative book and a very slow week are not contradictory: the old-crop book is largely full, and the next real demand signal will be a new-crop one after the August 12 WASDE. (USDA FAS, early Aug 2026)
Corn conditions fall a second week — Corn was rated 61% good-to-excellent as of August 2, down two points on the week and six points from July 19. Soybeans held at 63%, with 88% blooming and 62% setting pods. The deterioration lands inside the window the August production estimate measures. (USDA NASS Crop Progress, Aug 3, 2026)
China is 12% of the way through its soybean target — Outstanding US soybean sales to China stood at 3.11 million tonnes as of July 30 — roughly 114 million bushels, or just over 12% of a reported 25-million-tonne annual purchase commitment. Buying has come in bursts, including up to 15 cargoes inside a single week. (USDA FAS, Jul 30, 2026)
Home & Garden
August is fall-garden planting month, and the enemy is heat, not cold — Extension guidance for August is to start the fall vegetable garden now, using shade cloth or tarps to stop germinating seed and small seedlings drying out, with irrigation planned rather than improvised. (Clemson Home & Garden Information Center, "This Month in Your Garden — August 2026")
The $15 soil test is the best-value input you will buy this year — A home soil test reports phosphorus, potassium, calcium, magnesium, copper, manganese, zinc and pH, and usually returns a fertilizer and lime recommendation. Post-harvest autumn is the ideal sampling window — which makes the next eight weeks the right time. (Rutgers NJAES FS797; University of Wisconsin Horticulture Extension)
Cool-season lawns want nitrogen now, not in spring — Early-autumn feeding of cool-season grass calls for a high-nitrogen analysis such as 20-8-8 or 24-0-12; bed preparation guidance runs to two inches of compost plus roughly 10 cups of 19-05-09 per 100 square feet, chosen because half its nitrogen is slow-release. (Extension and trade horticultural guidance, 2026)
Micronutrients
Zinc is a three-year decision, not an annual one — At roughly $6 an acre with a residual effect measured in years rather than months, zinc's economics turn almost entirely on whether the soil test justifies it at all, not on the price of the product. This issue's New Inputs department carries the full arithmetic.
Sulfur's rate question is now a cost question — With the Tampa molten sulfur contract at a record and sulfur-bearing products repricing accordingly, the agronomic response range — commonly cited near 15 lb S/acre on fine-textured soils and 25 lb on coarse or sandy ground — matters more than it did when the input was cheap enough to over-apply without noticing. (Extension agronomic guidance; contract pricing per trade reporting, 2026)
A 22% potash product at a premium to a 60% one — The specialty potassium market continues to price analysis and form separately, and the gap is now wide enough to be a budget line rather than a curiosity. Covered in full in this issue.
Organics
Biological nitrogen products keep moving beyond cereals — Developers of nitrogen-fixing microbial products continue to extend labels from row crops into vegetables and other markets, on field-trial evidence of displacing a meaningful share of applied nitrogen. Treat displacement claims as product-specific and trial-specific: the published results are real, and they are not interchangeable between crops or geographies. (BioConsortia product announcements and field-trial reporting)
Compost-based biostimulants get a literature review — A peer-reviewed review of compost-based biostimulants covers production routes, functional mechanisms and the field's current validation problems — a useful corrective for a category where marketing has consistently run ahead of replicated data. (Review published in Nitrogen, doi:10.3390/nitrogen7010030)
Europe's biostimulant definition is doing regulatory work — EU Regulation 2019/1009 established a legal definition covering both microbial formulations, including nitrogen-fixing rhizobacteria, and non-microbial ones. It is the closest thing the category has to a standard, and it is worth watching as a template for how US labelling eventually settles.
Up and Coming
Low-carbon ammonia leaves the announcement stage — Construction begins this month on a Louisiana low-carbon ammonia complex of roughly 1.4 million tonnes a year with better than 95% carbon capture, at a reported $3.7 billion, targeting production in 2029. Note for fertilizer buyers: the offtake is contracted to a Japanese power generator and a trading house, so these tonnes are not committed to the domestic fertilizer channel. (CF Industries Blue Point disclosures; Fuel Cells Works, Aug 6, 2026)
The 45Q credit steps from $60 to $85 a tonne — Carbon capture at Donaldsonville contributed $45 million of revenue in the first half of 2026, with the credit rate stepping up once a Class VI injection well permit is secured. Blue Point is expected to qualify on roughly 2.3 million tonnes of CO₂ a year. (CF Industries, Q2 2026 earnings call, Aug 6, 2026)
Nutrien confirms bids for its phosphate business — The company disclosed multiple non-binding bids while noting that prospective buyers recognise current market volatility. Early-stage and non-binding — a sale is one of several possible outcomes, and curtailment is another. (Nutrien Ltd., Aug 5, 2026)
Interesting
A seller and a buyer landed within $5 of each other — CF, selling ammonia, and Mosaic, buying it, reported realised prices in the same neighbourhood this quarter from opposite sides of the trade. Independent confirmation of a wholesale level is rare in a market this opaque, and it is worth more than either number alone. (Company disclosures, Aug 2026)
The machinery market split by horsepower — One manufacturer cut its full-year outlook on weakness in Western Europe, Brazil and North American small ag, while reporting North American sales up about 20% and share gains in high-horsepower tractors — in the same release. (AGCO Corporation, Q2 2026, late July 2026)
The cheapest nitrogen is the hardest to apply — Anhydrous is 21% cheaper per pound of N than UAN32 and 29% cheaper than UAN28, and it is the only nitrogen source that needs a toolbar, a high-horsepower tractor and nurse tanks to place. The cost advantage and the equipment burden are the same fact seen twice. (DTN/Progressive Farmer, Jul 31, 2026; Crop Root Zone analysis)
Off the Wall Discovery
A fertilizer plant whose main product may be a tax credit — Run the public numbers on the Louisiana low-carbon ammonia project and the sequestration credit — roughly 2.3 million tonnes of CO₂ at $85 a tonne, about $196 million a year — is comparable in scale to the entire earnings contribution the operator has guided that project to deliver. Flagged as an order-of-magnitude comparison, not a like-for-like ratio: the credit figure is joint-venture-level and the earnings figure is one partner's stated contribution. (Crop Root Zone arithmetic from CF Industries disclosures, Aug 2026)
Growers can hedge what they sell but not what they spread — A reader raised it this week and it holds up: corn, beans and wheat all have a contract month and a clearing house. Ammonia, urea, UAN and AMS at the farmgate have prepay. See Letters & Responses for why the asymmetry is structural rather than an oversight.
Two-thirds of a phosphate tonne's problem is not phosphate — DAP's cost stack is dominated by sulfur and ammonia, both of which repriced sharply upward, which is how a producer ends up losing $31 a tonne on a product selling near record retail. The rock was never the expensive part. (Nutrien Q2 2026; World Bank commodity analysis)
Your Anhydrous Fell 7% in a Month. The Producer Just Raised Its Long-Run Price by 8.5%.
CF lifted its mid-cycle NOLA urea assumption from $355 to $385 a short ton — and said two-thirds of the raise is the cost of building the next plant, not the cost of running this one.
North America's largest nitrogen producer spent the first week of August telling investors that the price of nitrogen is going up over the long run. In the same week, the retail price series most Corn Belt growers actually watch printed its fourth consecutive monthly decline. CF Industries Holdings reported first-half 2026 net earnings of $1.34 billion and adjusted EBITDA of $2.18 billion on August 5, then used its August 6 earnings call to raise its baseline mid-cycle EBITDA to roughly $2.9 billion — and disclosed that the NOLA urea price assumption underneath that number had moved from $355 to $385 per short ton (CF Industries Holdings, Aug 5–6, 2026). DTN's retail survey for the week ending July 31, meanwhile, had anhydrous ammonia at $960/ton, down 7% month over month, and UAN32 at $459/ton, down 14% (DTN/Progressive Farmer, Aug 5, 2026). Both things are true. They are measurements of different quantities, and the gap between them is where the fall buying decision lives.
1. What CF actually raised, and what it did not
What's new: The headline is the mid-cycle EBITDA number — about $2.9 billion baseline, rising to roughly $3.3 billion by 2030 once the Blue Point complex contributes about $300 million and expanded carbon capture about $100 million. But the operative disclosure for a fertilizer buyer is one layer down: the price deck. CF's mid-cycle framework now assumes NOLA urea at $385 per short ton, up from $355 — an 8.5% increase in the company's own long-run assumption.
Evidence: Chief executive Chris Bohn broke the $30 into two unequal parts on the call. Roughly $10 is structural: higher freight, insurance and logistics costs that management described as not snapping back. Roughly $20 is capital-cost driven — a function of what it now costs to build new ammonia capacity on the US Gulf Coast, and of the narrowing gap between US and international construction costs.
| CF Industries mid-cycle assumption | Prior | Current | Δ |
|---|---|---|---|
| NOLA urea baseline | $355/st | $385/st | +$30 (+8.5%) |
| — of which structural (freight, insurance, logistics) | — | ~$10 | 33% of the raise |
| — of which capital-cost driven (Gulf Coast construction) | — | ~$20 | 67% of the raise |
| Baseline mid-cycle adjusted EBITDA | — | ~$2.9bn | — |
| Mid-cycle adjusted EBITDA by 2030 | — | ~$3.3bn | +$400m from projects |
| Mid-cycle free cash flow | — | ~$1.7bn | — |
Source: CF Industries Holdings, Q2 2026 earnings call, Aug 6, 2026; H1 2026 results release, Aug 5, 2026.
This is not a forecast of the fall 2026 price. A mid-cycle deck is a normalized, through-the-cycle number a producer uses to size capital allocation — the level it thinks the market returns to after the highs and lows average out. Raising it says the company believes the center of the distribution moved, not that next quarter's print will be $385.
$385/st
CF's new mid-cycle NOLA urea assumption, up from $355. About $20 of the $30 increase is attributed to the cost of building new Gulf Coast capacity, not to the cost of operating existing plants. (CF Industries Holdings, Q2 2026 earnings call, Aug 6, 2026)
Ground Truth: Read the composition of the raise, not its size. A price-deck increase driven by construction cost is a statement that the marginal new ton is expensive — which supports the floor only for as long as nobody builds. A price-deck increase driven by freight and insurance is a statement that the delivered cost of every existing ton went up, which supports the floor regardless. Two-thirds of CF's raise is the first kind. That is the more fragile two-thirds, and it is the part that unwinds if the current construction cycle actually delivers.
2. The retail series went the other way, and that is not a contradiction
What's new: Five of the eight nutrients DTN tracks were lower month over month in the week ending July 31, with the nitrogen complex leading the decline (DTN/Progressive Farmer, Aug 5, 2026).
Evidence:
| Product | $/ton | MoM | YoY | Basis |
|---|---|---|---|---|
| Anhydrous | 960 | −7% | +26% | Delivered, retail |
| Urea | 686 | −4% | +6% | Delivered, retail |
| UAN28 | 464 | −8% | +11% | Delivered, retail |
| UAN32 | 459 | −14% | −8% | Delivered, retail |
| DAP | 914 | +1% | +12% | Delivered, retail |
| MAP | 958 | — | +8% | Delivered, retail |
| Potash | 494 | — | +2% | Delivered, retail |
| 10-34-0 | 718 | −1% | +7% | Delivered, retail |
Source: DTN/Progressive Farmer retail fertilizer survey, week ending Jul 31, 2026, published Aug 5, 2026.
Note what the year-over-year column does to the monthly story. Anhydrous is down 7% in a month and still up 26% on the year. UAN32 is the only nitrogen product actually below its year-ago level, and it got there by falling 14% in a single month — a move large enough that it deserves to be read as a product-specific repricing rather than a read on nitrogen generally.
The reconciliation between CF's raise and DTN's decline is mostly a question of what is being measured. CF's $385 is a NOLA barge price for urea — wholesale, waterborne, one product, no application, no delivery, no retail margin. DTN's $960 anhydrous is a delivered retail price to a farmgate, carrying freight from the river, terminal handling, storage, dealer margin and the local competitive situation. The wholesale number can rise while the retail number falls, for months, because the retail number is still working off inventory bought at an earlier wholesale level.
3. On a pound-of-nitrogen basis, the ranking barely moved
What's new: The monthly declines were uneven enough to change what the cheapest nitrogen in the shed is — but not by as much as the headline percentages suggest.
Evidence: Converting each product to a cost per pound of actual nitrogen strips out the analysis-grade differences that make ton prices incomparable.
| Product | $/lb N | Relative cost | |
|---|---|---|---|
| UAN28 | 0.83 | ██████████ |
most expensive N in the shed |
| Urea | 0.75 | █████████ |
|
| UAN32 | 0.72 | █████████ |
after a 14% monthly fall |
| Anhydrous | 0.59 | ███████ |
still the cheapest by a wide margin |
Source: DTN/Progressive Farmer, week ending Jul 31, 2026, published Aug 5, 2026.
Anhydrous remains 21% cheaper per pound of nitrogen than UAN32 even after UAN32's outsized decline, and 29% cheaper than UAN28. The 14% monthly drop in UAN32 closed roughly four cents per pound of the gap to anhydrous — real, but not enough to reorder the list. A grower switching products on the strength of one month's retail move is trading a 4-cent convenience for a 13-cent structural spread.
Ground Truth: The retail decline is real and it is worth having, but it has not changed the product decision — it has changed the timing decision. Nothing in the July prints moves anhydrous off the bottom of the per-pound table, so the question in front of a fall applicator is not which nitrogen to buy. It is whether to cover fall needs now against a producer that has just told the market it expects supply to stay constrained into 2027, or to keep waiting on a retail lag that has already delivered four months of declines and is, by construction, finite.
4. What the producer said about supply is the part with a date on it
What's new: CF's forward commentary is more specific than the usual constructive boilerplate, and it carries an explicit horizon: management expects global nitrogen conditions to remain constrained through 2027, citing capacity closures, limited new supply, geopolitical disruption, higher logistics costs and elevated construction expense. The tightness thesis was extended in the call commentary out toward 2030.
Evidence: The operational figures give that commentary weight rather than the other way round. CF ran at nearly 98% of ammonia capacity in the first half and guides to roughly 9.5 million tons of gross ammonia production for 2026 — a figure that already absorbs a planned outage at Yazoo City. A producer running effectively flat out, with pricing gains of $588 million in the quarter against volume declines of $158 million, is describing a market where it cannot make more and does not need to discount.
| CF Industries | Q2 2026 | Q2 2025 |
|---|---|---|
| Net sales | $2.22bn | $1.89bn |
| Net earnings | $727m | — |
| Diluted EPS | $4.73 | — |
| Adjusted EBITDA | ~$1.19bn | — |
| Gross margin | 51.5% | 39.9% |
| H1 ammonia utilization | ~98% | — |
Source: CF Industries Holdings, H1 2026 results release, Aug 5, 2026.
The volume line matters more than it looks. Ammonia segment net sales rose $95 million to $586 million on roughly a 50% increase in average selling price against a 20% decrease in sales volume. A 50-for-20 trade is the signature of a market where the producer is price-taker on the way up and has no incentive to chase volume — and it is the clearest single piece of evidence that the wholesale nitrogen market and the retail nitrogen series are not currently pointing the same direction.
5. What to do with the two numbers
The practical synthesis is narrower than either headline.
- Do not use CF's $385 as a fall price forecast. It is a normalized capital-planning assumption. Using it to time a fill purchase is a category error.
- Do not use the retail decline as evidence that the wholesale floor is falling. It is not. The producer with 98% utilization just raised its own long-run assumption.
- Do treat the composition of the raise as the forward-looking datum. Two-thirds capital cost means the tightness case depends on the construction pipeline staying expensive and slow. That is a checkable claim, and the thing to check between now and spring.
- Do read the year-over-year column before the month-over-month one. Anhydrous at −7% MoM and +26% YoY is not a cheap input. It is a slightly less expensive one.
A grower waiting for the 2024 lows should note that the largest producer in North America has now formally removed that level from its own planning model. That does not make the producer right. It does mean the wait is a bet against the entity that sets the wholesale price, taken with a retail lag that is already four months old.
References
- CF Industries Holdings, Inc., "Reports First Half 2026 Net Earnings of $1.34 Billion, Adjusted EBITDA of $2.18 Billion," Aug 5, 2026 — https://www.businesswire.com/news/home/20260805096702/en/
- CF Industries Holdings, Inc., Q2 2026 earnings call, Aug 6, 2026 (management commentary on mid-cycle EBITDA, NOLA urea price assumption, and nitrogen supply outlook).
- CF Industries Holdings, Inc., Form 10-Q for the quarterly period ended Jun 30, 2026, filed with the US Securities and Exchange Commission — https://www.sec.gov/Archives/edgar/data/0001324404/000132440426000019/cf-20260630.htm
- DTN/Progressive Farmer, "Fertilizer Prices Fall as UAN32 Leads Significant Drops Heading Into August," retail survey week ending Jul 31, 2026, published Aug 5, 2026 — https://www.dtnpf.com/agriculture/web/ag/crops/article/2026/08/05/fertilizer-prices-fall-uan32-leads
- Investing.com, "CF Industries Q2 2026 slides: operational strength amid earnings miss," Aug 5, 2026.
Disclosures
Crop Root Zone is an independent publication. Nothing here is investment advice. Market calls, where included, reflect the editors' own read and are not a recommendation to buy or sell any security.
You Paid $914 a Ton for DAP. The Company That Made It Lost $31 a Tonne.
Nutrien's phosphate segment ran a negative manufactured gross margin in the second quarter while shipping 9% more product — and its chief executive says the market cannot continue as it is.
The most useful number in the second-quarter fertilizer results is negative. Nutrien Ltd. reported on August 5 that its phosphate segment earned a manufactured product gross margin of negative $31 per tonne in the second quarter of 2026 — while shipping 590,000 tonnes, up from 543,000 tonnes a year earlier (Nutrien Ltd., Q2 2026 results, Aug 5, 2026). Chief executive Ken Seitz put the conclusion on the record in plain language: "The phosphate market today is completely unsustainable. Something has to change." In the same week, DTN's retail survey had DAP at $914 a ton, up 1% month over month and up 12% year over year, and MAP at $958, up 8% on the year (DTN/Progressive Farmer, Aug 5, 2026). A grower paying near-record retail phosphate and a producer losing money making it are not contradictory observations. They are the same observation, seen from the two ends of a cost stack that has stopped clearing.
1. The segment scoreboard, and why phosphate is the outlier
What's new: Nutrien delivered net earnings of $1.22 billion and adjusted EBITDA of $2.43 billion for the quarter, raised its full-year potash sales volume guidance, and trimmed capital spending. Underneath a good quarter, the three manufactured nutrient segments are pointing in three different directions.
Evidence:
| Segment | Q2 2025 volume | Q2 2026 volume | Q2 2026 gross margin | FY2026 guidance |
|---|---|---|---|---|
| Potash | 3.989 Mt | 3.943 Mt | $607m | raised to 14.2–14.8 Mt |
| Nitrogen | 3.017 Mt | 2.253 Mt | $543m (from $513m) | unchanged, 9.2–9.7 Mt |
| Phosphate | 0.543 Mt | 0.590 Mt | −$31 / tonne | 2.4–2.6 Mt |
Source: Nutrien Ltd., Q2 2026 results, Aug 5, 2026. Potash and nitrogen margins are segment gross margin in dollars; the phosphate figure is manufactured product gross margin per tonne, as reported.
Two of these segments behaved the way a tight market is supposed to make them behave. Nitrogen sold 25% fewer tonnes and made more gross margin — $543 million against $513 million — which is the arithmetic signature of pricing power. Potash held volume roughly flat, earned $607 million, and prompted management to raise full-year volume guidance to 14.2–14.8 million tonnes on the strength of a record first half and better visibility into the second-half order book.
Phosphate did the opposite of both. It sold 9% more tonnes and booked a negative per-tonne margin. In a normally functioning market, a producer facing a negative margin cuts run rates. Nutrien shipped more.
−$31/tonne
Nutrien's manufactured product gross margin in phosphate, Q2 2026 — earned while shipping 9% more volume than the prior-year quarter. (Nutrien Ltd., Q2 2026 results, Aug 5, 2026)
2. Where the money went: the cost stack, not the price
What's new: DAP's problem is not weak demand and it is not a soft price. It is that the two largest purchased inputs into a diammonium phosphate tonne — sulfur and ammonia — both repriced upward, and the finished product did not fully follow.
Evidence: A DAP tonne is roughly 18% nitrogen and 46% phosphorus pentoxide, and getting there requires sulfuric acid to digest phosphate rock and ammonia to complete the ammoniation. The World Bank's commodity work documents that liquid sulfur prices nearly tripled from the end of 2024, and that ammonia prices were roughly 15% higher by late 2025 — a combination it identifies as substantially elevating DAP production costs globally (World Bank, commodity markets analysis, 2025–2026). The same work records the DAP fertilizer affordability index reaching levels above the early-2022 peak.
That is the setup for a squeeze that shows up on the producer's income statement before it shows up on the retail invoice:
| Link in the chain | Direction | Reference point |
|---|---|---|
| Sulfur (feedstock) | Up sharply | Liquid sulfur nearly tripled since end-2024 |
| Ammonia (feedstock) | Up | ~15% higher by late 2025 |
| DAP producer margin | Negative | −$31/tonne, Q2 2026 |
| DAP retail, delivered | Up modestly | $914/ton, +1% MoM, +12% YoY |
| Affordability | Worse | DAP index above its early-2022 peak |
Sources: World Bank commodity markets analysis, 2025–2026; Nutrien Ltd. Q2 2026 results, Aug 5, 2026; DTN/Progressive Farmer retail survey week ending Jul 31, 2026.
The retail price rose 12% year over year. The input costs rose considerably more than that. The producer absorbed the difference, and the difference is the negative sign.
Ground Truth: The common read on $914 DAP — that phosphate is expensive because producers are holding the line on price — is refuted by the producers' own accounts. They are not holding a line; they are eating the gap. Which means the ordinary bearish reflex is backwards here. A negative-margin producer is not a source of future price relief. It is a source of future supply withdrawal, and supply withdrawal is how a phosphate price that is already 12% higher year over year gets higher still.
3. "Something has to change" is a supply statement
What's new: Nutrien disclosed that it has received multiple non-binding bids for its phosphate business, while noting that prospective buyers recognize the current volatility. Management is guiding 2.4–2.6 million tonnes for the full year and expects stronger nitrogen and potash application in the fall of 2026, with improved per-tonne gross margins even on potentially lower volumes.
Evidence: Put the chief executive's sentence next to the balance of the disclosure. A company that (a) books a negative per-tonne margin, (b) says the market is unsustainable, and (c) confirms it is fielding bids for the asset is describing a fairly narrow set of possible next moves:
| Path | What it does to supply | What it does to the 2027 P price |
|---|---|---|
| Sale to a new owner | Neutral near term | Neutral; the tonnes still run |
| Curtailment / run-rate cut | Reduces supply | Upward |
| Idle or close capacity | Reduces supply structurally | Upward, durably |
| Input costs fall (sulfur, ammonia) | Neutral | Downward — the only bearish path |
Source: Nutrien Ltd., Q2 2026 results and management commentary, Aug 5, 2026. Path outcomes are Crop Root Zone's assessment, not company guidance.
Only one of those four paths is friendly to a grower's phosphorus budget, and it is the one that depends on the sulfur and ammonia complexes easing. On the ammonia side, the largest North American nitrogen producer spent the same week telling investors it expects supply to remain constrained into 2027 (CF Industries Holdings, Q2 2026 earnings call, Aug 6, 2026). That is not the profile of a cost stack about to relax.
4. What this does to a 2027 fertility budget
What's new: The practical consequence is a change in which nutrient carries the budget risk. For two seasons the answer was nitrogen. On the current evidence it is phosphorus.
Evidence: Compare the three nutrients on the two things that matter to a program — where the retail price is now, and what the producer economics say about where it goes.
| Nutrient | Retail, $/ton | YoY | Producer economics say |
|---|---|---|---|
| Potash | 494 | +2% | Comfortable — volume guidance raised |
| Nitrogen (anhydrous) | 960 | +26% | Tight, but profitably supplied |
| Phosphate (DAP) | 914 | +12% | Loss-making at the plant gate |
Sources: DTN/Progressive Farmer retail survey week ending Jul 31, 2026, published Aug 5, 2026; Nutrien Ltd. Q2 2026 results, Aug 5, 2026; CF Industries Holdings, Aug 5–6, 2026.
Rendered as relative producer comfort, the ranking is stark:
| Segment | Q2 gross margin | ||
|---|---|---|---|
| Potash | $607m | ██████████ |
volume guide raised |
| Nitrogen | $543m | █████████ |
on 25% lower volume |
| Phosphate | negative | |
on 9% higher volume |
Source: Nutrien Ltd., Q2 2026 results, Aug 5, 2026.
The planning implication is not "buy phosphate now" — a negative producer margin is a statement about the past quarter, not a purchase signal, and the retail price is already near a high. It is narrower than that: the phosphorus line is the one in a 2027 budget that has an identified mechanism for getting worse and no identified mechanism for getting better. Potash has the opposite profile. Nitrogen sits between them, expensive but supplied by producers who are making money and have every incentive to keep running.
Ground Truth: Budget phosphorus at or above today's price for 2027 and treat any softening as upside, rather than penciling in a decline you have no source for. If the phosphate line has to give somewhere, give it on rate against soil test — a documented agronomic decision on fields testing high — rather than on a bet that the price falls. Producers losing $31 a tonne are not the party that blinks first.
5. What to watch between now and the fall application window
Three checkable things, in order of how much they would move the phosphorus line:
- Any Nutrien announcement on the phosphate business — a sale, a curtailment, or a decision to keep and invest. Each has a different sign for 2027 supply.
- The Q4 sulfur settlement. Sulfur is the input that did the most damage. A fourth-quarter contract that steps down is the first genuine bearish datum available to a phosphate buyer; one that steps up extends the squeeze into next year's production costs.
- Whether retail DAP keeps rising while nitrogen falls. It did in the week ending July 31 — DAP +1% month over month against anhydrous −7%. If that divergence persists through the fall fill season, it is the retail market confirming what the producer income statement already said.
References
- Nutrien Ltd., "Nutrien Reports Second Quarter 2026 Results," Aug 5, 2026 — https://www.nutrien.com/news/press-releases/nutrien-reports-second-quarter-2026-results-1753
- AgNavigator, "'The phosphate market today is completely unsustainable,' Nutrien shares Q2 2026 fertilizer performance," Aug 6, 2026 — https://www.agnavigator.com/Article/2026/08/06/fertilizer-market-nutrien-reports-phosphate-nitrogen-declines-in-q2-2026/
- Nutrien Ltd., Form 6-K furnished to the US Securities and Exchange Commission, Q2 2026 current report.
- DTN/Progressive Farmer, "Fertilizer Prices Fall as UAN32 Leads Significant Drops Heading Into August," retail survey week ending Jul 31, 2026, published Aug 5, 2026 — https://www.dtnpf.com/agriculture/web/ag/crops/article/2026/08/05/fertilizer-prices-fall-uan32-leads
- World Bank, commodity markets analysis on fertilizer affordability and DAP production costs, 2025–2026.
- CF Industries Holdings, Inc., Q2 2026 earnings call, Aug 6, 2026.
Disclosures
Crop Root Zone is an independent publication. Nothing here is investment advice. Market calls, where included, reflect the editors' own read and are not a recommendation to buy or sell any security.
UAN32 Fell Twice as Fast as Anhydrous. On a Nitrogen Basis, Anhydrous Still Won.
The month's biggest price cut went to the most expensive nitrogen in the country — and the anhydrous discount to urea got wider, not narrower, while everyone watched UAN.
DTN posted its first retail fertilizer print in a week on August 5, covering the week of July 27-31, and the headline wrote itself: prices fell across the board, with UAN32 down 14% month over month to $459/ton. Every nitrogen product in the survey is cheaper than it was a month ago — anhydrous −7% to $960/ton, UAN28 −8% to $464, urea −4% to $686 — while phosphate and potash held flat or rose. But a fertilizer price in dollars per ton is a shipping statistic, not an agronomic one. Converted to the only unit that matters when a grower is buying a nutrient rather than a product, the month's rankings barely shuffled, and the one spread that moved against the consensus story is the one that decides how most of the fall nitrogen bill gets written.
1. What the survey actually says
What's new: The August 5 DTN/Progressive Farmer retail survey covers the week of July 27-31 and shows six of eight tracked products lower month over month. Nitrogen took all of the damage. Phosphate and potash did not participate.
Evidence: The full print, with the nitrogen products converted to a cost per pound of contained N at their standard analyses (anhydrous 82% N, urea 46%, UAN28 28%, UAN32 32%):
| Product | $/ton | $/lb.N | MoM | YoY | Basis |
|---|---|---|---|---|---|
| Anhydrous | 960 | 0.59 | −7% | +26% | Delivered, retail |
| UAN32 | 459 | 0.72 | −14% | −8% | Delivered, retail |
| Urea | 686 | 0.75 | −4% | +6% | Delivered, retail |
| UAN28 | 464 | 0.83 | −8% | +11% | Delivered, retail |
| DAP | 914 | — | +1% | +12% | Delivered, retail |
| MAP | 958 | — | — | +8% | Delivered, retail |
| Potash | 494 | — | — | +2% | Delivered, retail |
| 10-34-0 | 718 | — | −1% | +7% | Delivered, retail |
Source: DTN/Progressive Farmer retail fertilizer trends, published Aug 5, 2026 (week of Jul 27-31). Per-pound-N figures as published by DTN.
Two things jump out of that table before any analysis. First, seven of the eight products are still more expensive than a year ago; only UAN32 is cheaper. A 14% monthly decline that leaves you 8% below last year is a real move. A 7% monthly decline that leaves you 26% above last year is a retracement inside an uptrend, and those are different animals. Second, the nutrient that fell hardest — UAN32 — is not the nutrient a grower buys most of by tonnage in the fall.
The same numbers as a bar column, so the spread is visible rather than arithmetic:
| Nitrogen source | $/lb.N | |
|---|---|---|
| Anhydrous | 0.59 | ███████ |
| UAN32 | 0.72 | █████████ |
| Urea | 0.75 | █████████ |
| UAN28 | 0.83 | ██████████ |
Source: DTN/Progressive Farmer, Aug 5, 2026.
Ground Truth: The gap from the cheapest nitrogen to the most expensive is $0.24/lb.N. On a 180 lb.N/acre corn program that is $43/acre — larger than the entire per-acre budget most growers give to potash, and roughly the difference between a corn acre that pencils and one that doesn't at $4.62 December futures. The nitrogen form decision is now worth more than most of the nitrogen rate decisions being argued about.
2. The spread that widened
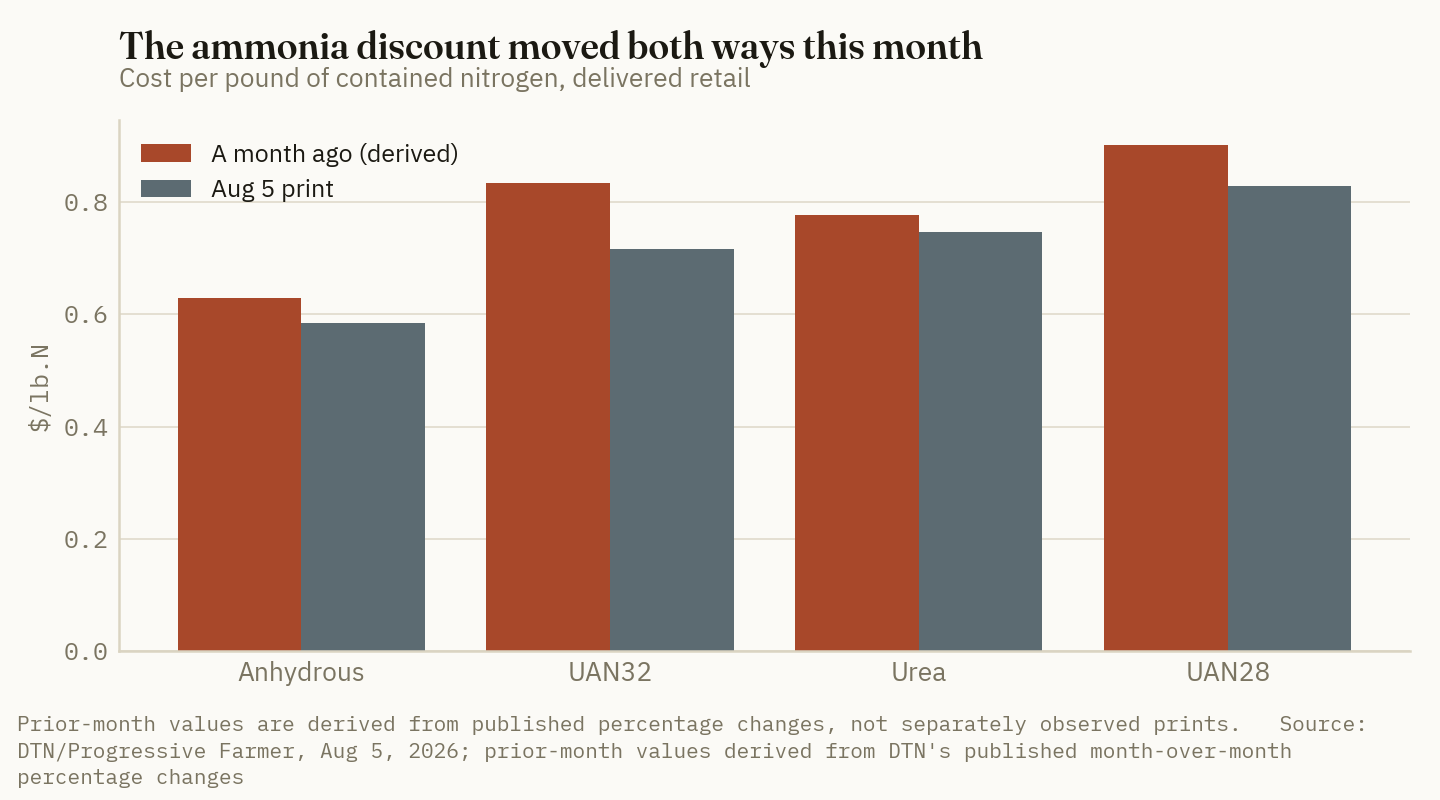
What's new: Because DTN publishes month-over-month percentage changes alongside current prices, the previous month's price can be recovered arithmetically. Doing that for all four nitrogen products shows that the anhydrous discount did not simply "improve" across the board. It widened against urea and narrowed sharply against UAN32.
Evidence: Prior-month prices below are derived from DTN's published current price and its published monthly percentage change, not separately observed prints — they inherit DTN's rounding and are marked with an asterisk accordingly.
| Spread vs. anhydrous | A year ago* | A month ago* | Now | Direction |
|---|---|---|---|---|
| Urea premium ($/lb.N) | 0.239* | 0.147* | 0.160 | Widened over the month |
| UAN32 premium ($/lb.N) | 0.315* | 0.205* | 0.132 | Nearly halved |
| UAN28 premium ($/lb.N) | 0.278* | 0.271* | 0.243 | Narrowed modestly |
*Derived from DTN's published month-over-month and year-over-year percentage changes applied to the Aug 5, 2026 print; not independently observed prints. Source: DTN/Progressive Farmer, Aug 5, 2026.
Read that middle column against the right one. A month ago, a grower choosing between anhydrous and urea saved about $0.147/lb.N by going with ammonia. Today that saving is $0.160 — the ammonia case against urea got stronger during a month in which ammonia's own headline price fell 7%. It got stronger precisely because urea fell less: −4% against −7%.
Meanwhile the UAN32 comparison went the other way, and hard. A month ago UAN32 cost $0.205/lb.N more than anhydrous. Today it costs $0.132 more. Two-thirds of a cent per pound per week of erosion in the ammonia advantage, entirely because UAN32 was cut 14% while ammonia was cut half that.
$0.13/lb.N
What UAN32 now costs above anhydrous — down from $0.21 a month ago. On 180 lb.N that is a $24/acre gap, not the $37/acre gap it was in early July. (Derived from DTN/Progressive Farmer, Aug 5, 2026)
Ground Truth: These two spreads point at two different buyers, and the month moved them in opposite directions. A grower who was going to sidedress UAN32 in the spring just got a materially better deal relative to fall ammonia — the convenience premium for liquid is now $24/acre, not $37. A grower choosing between fall ammonia and fall or spring urea got a worse deal on urea than a month ago. "Nitrogen got cheaper" is true and useless. Which nitrogen got cheaper relative to which is the whole decision.
3. Why the ammonia discount exists at all, and what would close it
What's new: The $0.59 figure is not a bargain in the ordinary sense. It is the price of nitrogen with none of the handling built in.
Evidence: Anhydrous ammonia is 82% nitrogen — the most concentrated nitrogen source sold at retail. Urea is 46%, UAN32 is 32%, UAN28 is 28%. Every ton of UAN28 that moves down a road is 72% water and inert carrier by weight. The concentration difference is the freight difference, the storage difference, and most of the price difference. What the buyer of urea or UAN is paying for on top of the nitrogen is the granulation or solution step, a product that can be handled at ambient pressure by an ordinary spreader or sprayer, and a product that does not require pressurized vessels, trained handling, and a regulatory footprint.
That premium is structurally stable, which is why the year-ago column is instructive. A year ago urea cost $0.239/lb.N more than anhydrous. Today it costs $0.160 more. The handling premium has compressed by a third over twelve months — not because handling got cheaper, but because ammonia's own price rose 26% while urea's rose 6%.
| Nitrogen source | Analysis (% N) | lb N per ton | Weight that is not N |
|---|---|---|---|
| Anhydrous | 82 | 1,640 | 18% |
| Urea | 46 | 920 | 54% |
| UAN32 | 32 | 640 | 68% |
| UAN28 | 28 | 560 | 72% |
Source: Standard product analyses; tonnage arithmetic by Crop Root Zone.
What would close the anhydrous discount is not a price move at all — it is a delivery constraint. Ammonia is the cheapest nitrogen only for a grower who can actually take delivery of it inside the window when soil temperature allows fall application, using equipment that exists in finite quantity. That is a logistics question rather than a market one, and it is the subject of a separate piece in this issue.
Ground Truth: The 26% year-over-year rise in anhydrous against 6% in urea is the market slowly repricing away the reason ammonia was ever the default. If that continues for another twelve months at the same rate, the handling premium disappears entirely and the cheapest nitrogen in the country becomes the one you can put on with a sprayer. Nobody should plan a fall on that — but anyone signing a multi-year commitment to ammonia-specific equipment should notice which direction the spread has been travelling.
4. What to watch between now and fall fill
What's new: Three dated events will settle whether the July retracement was the start of a trend or the bottom of one.
Evidence:
-
The next DTN weekly prints. DTN publishes Wednesdays. The August 5 print covered July 27-31, so the survey is running about a week behind the trade. Anhydrous slipped only $2 week over week inside a 7% monthly decline — the weekly series has already flattened even though the monthly series still looks steep. Two more flat weeks would confirm the monthly number as a lagging artifact rather than a live trend.
-
International urea. Retail urea fell 4% on the month while international urea markets have been firm. A retail series moving opposite to the international one closes eventually, and it closes at the retail end.
-
Fall fill offers. Retail fill programs for fall ammonia typically post from mid-August. Those are the first prices that reflect current replacement cost rather than the summer's inventory.
| What to watch | When | Why it matters |
|---|---|---|
| DTN weekly retail print | Wednesdays | Weekly series has flattened; monthly series has not |
| Fall fill offers, ammonia | From mid-August | First prices at current replacement cost |
| International urea prints | Continuous | Retail urea is diverging from it and will converge |
Source: Publication schedules as noted; Crop Root Zone analysis.
Ground Truth: A grower deciding whether to prepay fall ammonia is not really deciding about the price of ammonia. They are deciding whether the $0.16/lb.N discount to urea holds. It has widened for a month, it has compressed by a third over a year, and those two facts are not contradictory — they say the trend is down and the noise is up. Prepay for the tons you can physically apply in the window; do not prepay for the spread.
References
- DTN/Progressive Farmer, "Fertilizer Prices Fall as UAN32 Leads Significant Drops Heading Into August," Aug 5, 2026 (survey week of Jul 27-31) — https://www.dtnpf.com/agriculture/web/ag/crops/article/2026/08/05/fertilizer-prices-fall-uan32-leads
- DTN/Progressive Farmer, "Fertilizer Prices Keep Sliding as UAN32 Leads 4 Nutrients in Significant Drops," Jul 29, 2026 — https://www.dtnpf.com/agriculture/web/ag/crops/article/2026/07/29/fertilizer-prices-keep-sliding-uan32
- DTN/Progressive Farmer, "Six Fertilizers Lead Retail Fertilizer Prices Lower for Third Consecutive Week," Jul 8, 2026 — https://www.dtnpf.com/agriculture/web/ag/crops/article/2026/07/08/six-fertilizers-lead-retail-prices
- CME Group December 2026 corn futures settlement, Aug 6, 2026.
Disclosures
Crop Root Zone is an independent publication. Nothing here is investment advice. Market calls, where included, reflect the editors' own read and are not a recommendation to buy or sell any security.
India Wants 1.7 Million Tonnes on August 11. Your Fall Fill Quote Was Written Before the Tender.
The international urea benchmark has turned up 6.8% in a month while US retail printed a seventh straight weekly decline — and RCF's bids open inside the prepay window.
India's Rashtriya Chemicals and Fertilizers issued an international tender on July 29 for 1.7 million tonnes of bulk urea — one million tonnes for the West Coast, 700,000 for the East Coast — with technical and commercial bids to be opened on August 11 (Agrolatam, Jul 2026). It is the largest single scheduled demand event on the third-quarter calendar, and it lands eleven days from now, in the same fortnight most Corn Belt retailers are quoting fall fill. The international urea benchmark has already moved: $402.50 per tonne on August 4, up 6.76% over the trailing month even after a 3.59% single-session drop (Trading Economics, Aug 4, 2026). US retail urea, meanwhile, printed $683/ton in DTN's July 20–24 collection — a seventh consecutive week of declines (DTN/Progressive Farmer, Jul 29, 2026). Two markets, one product, opposite directions. Only one of them has repriced the tender.
1. What RCF actually asked for
The tender's headline is the volume, but its terms matter more than its size.
RCF split the requirement 1.0 Mt West Coast / 0.7 Mt East Coast, and attached sanctions language that materially narrows the supplier set: it will reject suppliers, vessels or logistics chains subject to US, EU or UK sanctions, and will not accept cargo originating in or transiting Ukraine, the Sea of Azov, Russian Black Sea ports, or Russian territory within 200 kilometres of the Ukrainian border (Agrolatam, Jul 2026).
That restriction is the part a US buyer should read twice. Russian granular urea has repeatedly been the marginal tonne clearing large Indian tenders — Profercy noted Russia as the anticipated largest supplier, at an estimated 800,000+ tonnes, on an earlier 2026 Indian inquiry (Profercy, accessed Aug 5, 2026). A tender that structurally excludes a large share of the cheapest available supply does not get filled at the cheapest available price. It reaches further up the cost curve, and the clearing price is set by whoever is last in.
| Tender parameter | Detail |
|---|---|
| Buyer | RCF (Rashtriya Chemicals and Fertilizers) |
| Issued | Jul 29, 2026 |
| Bids opened | Aug 11, 2026 |
| Volume, West Coast | 1,000,000 t |
| Volume, East Coast | 700,000 t |
| Total | 1,700,000 t |
| Origin restrictions | No US/EU/UK-sanctioned suppliers, vessels or logistics chains; no cargo from or transiting Ukraine, Sea of Azov, Russian Black Sea ports, or Russian territory within 200 km of the Ukrainian border |
Source: Agrolatam, "India Returns to the Urea Market With a 1.7 Million-Ton Tender," Jul 2026.
2. The benchmark already turned; the calendar says why
The international price bottomed before the tender was announced, not after — which is the normal sequence, and the reason a US buyer waiting for confirmation is structurally late.
$402.50/MT
The urea benchmark on Aug 4, 2026 — down 3.59% on the day, but up 6.76% over the trailing month and roughly 9% above where 2026 began. (Trading Economics, Aug 4, 2026)
The context for that number is a round trip most of the market has already forgotten the top of. Urea reached a three-and-a-half-year peak above $700/MT in April 2026 on Middle East supply disruption, then unwound through the second quarter as Strait of Hormuz shipping concerns eased and China relaxed export restrictions (Trading Economics, accessed Aug 5, 2026). At the April peak, Indian tender business cleared at $935/t cfr West Coast and $959/t cfr East Coast, with US fob NOLA trading near $690/t and US cfr values lagging India's by $180–204/t (Profercy, accessed Aug 5, 2026). The current $402.50 is what the other side of that unwind looks like.
StoneX argued in late June that urea had another $30–50/t of downside before recovering, but that second-half demand would "pay for the lost tonnes" (Fertilizer Daily, Jun 24, 2026). Both halves of that call now look right in sequence: the market took the downside in June and early July, and the recovery leg has started. The trailing-month gain of 6.76% is that leg, and it is running into the largest scheduled buy of the quarter.
Trading Economics' own forward model has the benchmark at $410.12 for Q3 and $363.76 on a twelve-month horizon (accessed Aug 5, 2026) — that is, up near-term and down later. A curve shaped like that is not describing a bull market. It is describing a demand event.
3. US retail is still trading the June bottom
Here is the divergence, in DTN's own weekly collection. The seventh consecutive week of retail declines closed on July 24.
| Product | $/ton | MoM | YoY | $/lb N | Basis |
|---|---|---|---|---|---|
| Urea (46-0-0) | 683 | −5% | +6% | 0.74 | Delivered, retail |
| Anhydrous (82-0-0) | 962 | −11% | +26% | 0.59 | Delivered, retail |
| UAN28 | 473 | −6% | +13% | 0.85 | Delivered, retail |
| UAN32 | 461 | −14% | −7% | 0.72 | Delivered, retail |
| DAP | 913 | +1% | +13% | — | Delivered, retail |
| MAP | 958 | +1% | +9% | — | Delivered, retail |
| Potash | 494 | +0% | +2% | — | Delivered, retail |
| 10-34-0 | 718 | −1% | +7% | — | Delivered, retail |
Source: DTN/Progressive Farmer, Jul 29, 2026 (data collected week of Jul 20–24, 2026).
Two things in that table are worth separating. The nitrogen column is falling hard — UAN32 down 14% month-over-month, anhydrous down 11%. The phosphate column is not: DAP and MAP each rose 1% on the month and sit +13% and +9% year-over-year. Whatever is pushing nitrogen retail lower is a nitrogen story, not a fertilizer story, and it is a lagging one.
On a nutrient basis the ranking has not changed all summer, and it is the number that actually drives the fall application decision:
| Nitrogen source | $/lb N | |
|---|---|---|
| UAN28 | 0.85 | ██████████ |
| Urea | 0.74 | █████████ |
| UAN32 | 0.72 | ████████ |
| Anhydrous | 0.59 | ███████ |
Source: DTN/Progressive Farmer, Jul 29, 2026.
Anhydrous remains the cheapest nitrogen in the barn by a wide margin — 15 cents per pound of N under urea, which at a 180 lb N/acre corn program is $27/acre before a single pass is costed. That gap has held all season even as the absolute levels fell.
Ground Truth: The seventh straight weekly decline is not evidence that nitrogen is still cheapening. It is evidence that retail resets on a lag measured in weeks while the international benchmark resets in a session. The benchmark bottomed in early July and is up 6.76% since; retail's most recent print is a July 20–24 collection that has not seen it. A buyer reading the DTN series as a live signal is reading a four-to-six-week-old international market with a US retail margin wrapped around it. The tender on August 11 is the event most likely to close that gap — and it closes it upward.
4. What waiting was worth, and what it stops being worth
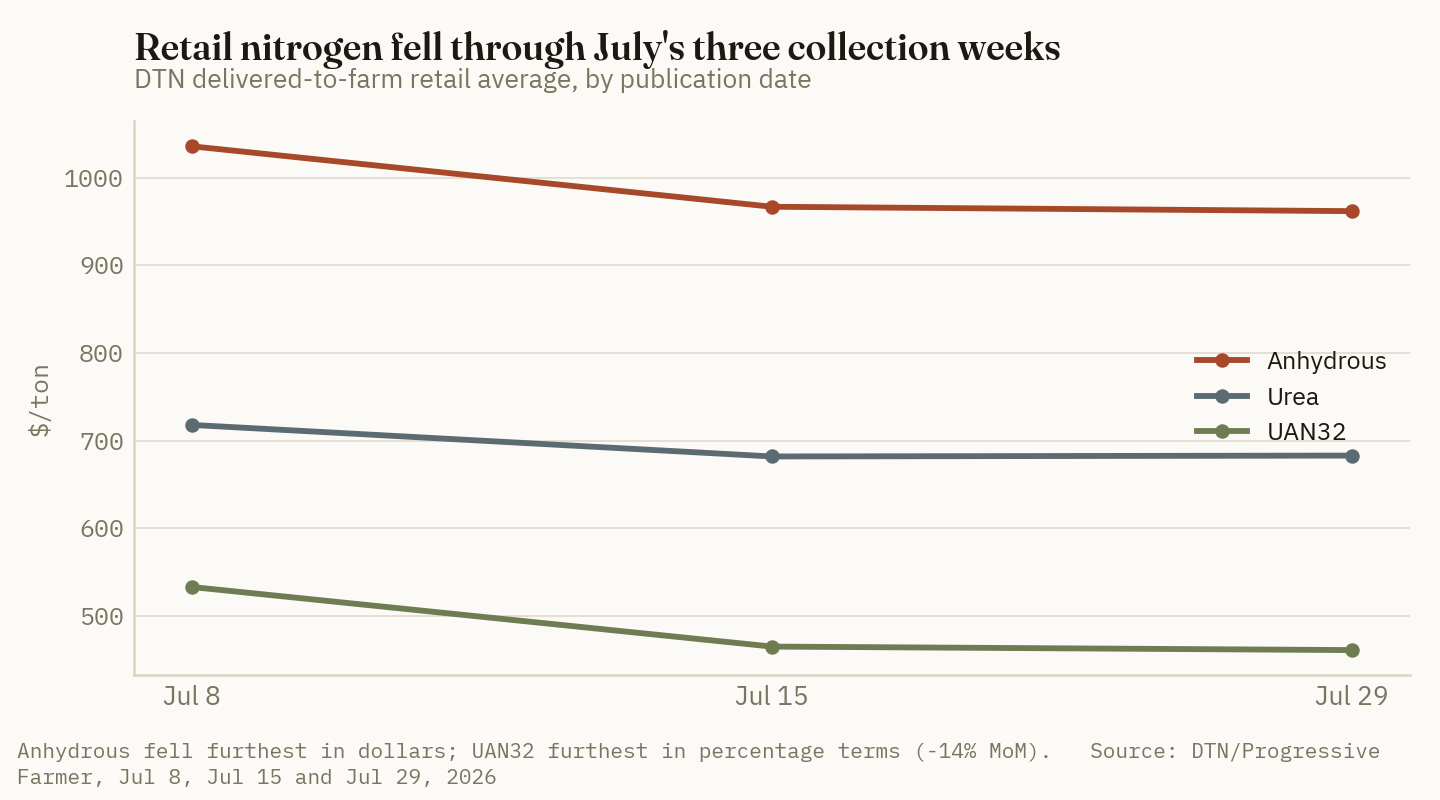
The case for waiting has been correct all summer, and it is worth being precise about how correct, because that is the honest baseline against which the next decision gets made. Taking DTN's three July collection weeks and converting each print to a per-acre nitrogen bill at a 180 lb N/acre corn program:
| Product | Jul 8 print | Jul 15 print | Jul 29 print | $/acre, Jul 8 | $/acre, Jul 29 | Saved by waiting |
|---|---|---|---|---|---|---|
| Urea | 718 | 682 | 683 | 140.48 | 133.63 | 6.85 |
| Anhydrous | 1,036 | 967 | 962 | 113.71 | 105.59 | 8.12 |
| UAN32 | 533 | 465 | 461 | 149.90 | 129.66 | 20.24 |
Prices: DTN/Progressive Farmer, Jul 8, Jul 15 and Jul 29, 2026. Per-acre figures are Crop Root Zone calculations at 180 lb N/acre using each product's nutrient analysis (46%, 82%, 32% N); they exclude application, and assume no prepay discount.
Three weeks of patience was worth $7 to $20 an acre depending on the product. That is a real return on doing nothing, and it explains why so little fall fill has been booked.
It also sets the size of the bet now on the table. The same arithmetic runs in reverse. If the August 11 tender clears at levels that pull the international benchmark back toward its April-to-June midpoint — not the $700 peak, just the middle of the range it has already traded this year — the retail pass-through at a 180 lb rate is a larger number than the $7–20 that patience earned. The asymmetry has flipped: through June and July the downside of waiting was zero and the upside was $20/acre; today the upside of waiting further is whatever is left of a decline that the benchmark has already stopped making.
There is a second, quieter reason the calendar matters. The seasonal shape is well established — urea firms from roughly November through March as spring prepay programs fill and distributors build inventory, then softens after application in June and July. The fall fill window is the last point in that cycle where a buyer transacts before the seasonal firming, and it is the window RCF's bid opening now sits inside.
Ground Truth: Do not read this as "buy now." Read it as "the free option expired." From April through July, waiting cost nothing and paid $7–20/acre; the correct position was no position. The August 11 bid opening is the first date this season where the cost of being wrong is symmetric. For operations with fall anhydrous plans and no coverage, the defensible move is to price a partial — enough that a firm tender print is not a full-book event — and leave the balance open for the twelve-month curve, which still points to $363.76. That is not a forecast that prices rise. It is a recognition that you are no longer being paid to wait.
5. What to watch between now and August 11
The tender itself will not be the only print that matters, and two of the three most useful confirmations are free.
The bid opening, August 11. The number that matters is the clearing cfr level and, more importantly, how much of the 1.7 Mt actually gets awarded. India has repeatedly issued for one volume and awarded another; a partial award against a restricted origin list is a firmer signal than a full award at a soft price.
NOLA barge response in the following week. The US market's reaction to an Indian tender is the fastest available read on whether Gulf tonnes get pulled into the export program. If NOLA firms while retail keeps sliding, the retail lag is confirmed and the fall fill quote in hand is a stale one.
The next two DTN collection weeks. Retail nitrogen has fallen for seven straight weeks. The eighth and ninth prints will show whether the lag is closing on its own or whether the divergence widens further before it resolves — and a widening divergence is a larger snap-back, not a smaller one.
References
- Agrolatam, "India Returns to the Urea Market With a 1.7 Million-Ton Tender as Global Prices Watch Closely," Jul 2026 — https://www.agrolatam.com/news/india-new-urea-tender-global-fertilizer-prices-2026/
- Trading Economics, Urea commodity price and forecast series, accessed Aug 4–5, 2026 — https://tradingeconomics.com/commodity/urea
- DTN/Progressive Farmer, "Fertilizer Prices Keep Sliding as UAN32 Leads 4 Nutrients in Significant Drops," Jul 29, 2026 — https://www.dtnpf.com/agriculture/web/ag/crops/article/2026/07/29/fertilizer-prices-keep-sliding-uan32
- DTN/Progressive Farmer, "UAN Fertilizers Lead Nutrient Prices Downward," Jul 15, 2026 — https://www.dtnpf.com/agriculture/web/ag/crops/article/2026/07/15/uan-fertilizers-lead-nutrient-prices
- DTN/Progressive Farmer, "Six Fertilizers Lead Retail Fertilizer Prices Lower for Third Consecutive Week," Jul 8, 2026 — https://www.dtnpf.com/agriculture/web/ag/crops/article/2026/07/08/six-fertilizers-lead-retail-prices
- Fertilizer Daily, "StoneX anticipates further declines in urea prices before fall demand drives a recovery," Jun 24, 2026 — https://www.fertilizerdaily.com/20260624-stonex-urea-could-drop-another-30-50t-before-recovering-but-h2-demand-will-pay-for-the-lost-tonnes/
- Profercy, "India eyes major urea award as tender lifts global fob values," accessed Aug 5, 2026 — https://www.profercy.com/insights/india-eyes-major-urea-award-as-tender-lifts-global-fob-values
Disclosures
Crop Root Zone is an independent publication. Nothing here is investment advice. Market calls, where included, reflect the editors' own read and are not a recommendation to buy or sell any security.
International Urea Turned Up 16% in a Month. Retail Urea Printed Lower.
The export benchmark bottomed in early July and has climbed since while US retail was still working off April's inventory. India's 1.7-million-tonne tender opens August 11 and settles which of the two is telling the truth.
The international urea market stopped falling in early July and has spent the last four weeks going the other way. The benchmark closed July 31 at $420 per tonne, up 15.9% on the month and still down 8.7% against a year ago (Trading Economics urea series, accessed Jul 31, 2026). Over the same four weeks the US retail price of the same molecule went the opposite direction: DTN's survey has urea at $683 per ton, up $1 on the week but down 5% on the month and up 6% on the year (DTN/Progressive Farmer, Jul 29, 2026). One of those two series is describing the market a fall-fill buyer will actually transact in, and it is not the one printing lower. India's National Fertilizers Limited has a 1.7-million-tonne tender with bids opening August 11, and it will settle the argument inside of two weeks.
1. The divergence, stated plainly
What's new: The international benchmark and the US retail print have moved in opposite directions for four consecutive weeks. Retail always lags — that is not the news. The news is the size of the gap, because most fall-fill conversations are being anchored to the wrong one of the two numbers.
Evidence:
| Series | Level | Basis | 1-month | 1-year |
|---|---|---|---|---|
| International urea benchmark | $420/MT | Export, FOB | +15.9% | −8.7% |
| US retail urea | $683/st | Delivered to farm | −5% | +6% |
| Egypt granular, last known sale | $425/MT | FOB Egypt | — | — |
| India NFL tender, Jun 8 | ~$445/MT | CFR India | — | — |
Source: Trading Economics urea series, accessed Jul 31, 2026; DTN/Progressive Farmer Retail Fertilizer Trends, Jul 29, 2026 (week of Jul 20-24); Egypt FOB and June NFL tender levels as relayed in trade coverage, Jun 30 and Jul 29, 2026. The unit mismatch is real and deliberate — the export series is per metric tonne FOB, the retail series per short ton delivered, and they are not directly comparable without a freight, handling and margin stack between them.
The two series are not measuring the same thing and never will. Between $420 FOB and $683 delivered sit ocean freight, NOLA barge, river or rail movement to a terminal, terminal handling, retailer margin, and about 10% of unit conversion. What matters is not the level. It is the derivative. Retail is a lagging, inventory-weighted average of what a dealer already paid; the export benchmark is what the next ton costs. When the second turns and the first hasn't, the first is describing history.
+15.9% vs −5%
The international urea benchmark and US retail urea moved in opposite directions by a combined 21 percentage points over the same four weeks. (Trading Economics, Jul 31, 2026; DTN/Progressive Farmer, Jul 29, 2026)
2. Why it fell 40%, and why that story is now dated
What's new: The urea collapse from April to June was not a demand event. It was two supply events landing on top of each other, and both carry expiry dates.
Evidence: The benchmark peaked above $700/tonne on April 15 — a three-and-a-half-year high — and fell more than 40% from there (Trading Economics, accessed Jul 31, 2026). The drivers, in order of contribution:
| Driver | What happened | Status now |
|---|---|---|
| Middle East risk premium | Strait of Hormuz shipping fears bid the market above $700 | Unwound — shipping prospects normalized |
| China's export window | 8-month near-total suspension reopened; quotas issued for June-August | Expires with August |
| Seasonal demand | Northern Hemisphere application largely complete | Turning — India tender, then NH fall fill |
| Brazil | Bought less urea than the prior year | Ongoing drag |
Source: Trading Economics urea market commentary, accessed Jul 31, 2026; export-quota detail from Profercy, May 26, 2026, and trade coverage, Jun 30, 2026.
The single most-quoted number in the collapse was India's June 8 NFL tender, which cleared at roughly $445/tonne CFR against about $890/tonne CFR at the April peak — a halving in eight weeks (trade coverage, Jun 30, 2026). It was read as proof that China's return had broken the market.
It is worth being precise about what that tender proved. It proved that at the moment China's quota was announced, sellers competed hard for a large Indian volume. It did not prove that Chinese tonnes actually cleared at those levels — and there is a specific reason to doubt that they did.
3. The floor almost nobody is pricing
What's new: When Beijing reopened the export window in late May, it did not simply issue quota. It issued quota with a minimum export price attached — and that minimum is nowhere near the market.
Evidence: The reopening set minimum export prices of $660/tonne FOB for prilled urea and $670/tonne FOB for granular, with India-bound shipments carrying an additional $20/tonne, against total quota allocations of 1.5-1.6 million tonnes plus a possible 400,000 tonnes for government-to-government business (Profercy, May 26, 2026).
Set that against where the market actually is:
| Reference | $/MT | Note | |
|---|---|---|---|
| China floor, granular, India-bound | 690 | ██████████ |
announced May 26, 2026 |
| China floor, granular | 670 | ██████████ |
announced May 26, 2026 |
| China floor, prilled | 660 | ██████████ |
announced May 26, 2026 |
| India NFL tender, Jun 8 | ~445 | ██████ |
CFR, not FOB |
| Egypt, last known sale | 425 | ██████ |
FOB Egypt |
| Benchmark, Jul 31 | 420 | ██████ |
FOB |
Source: floor levels from Profercy, May 26, 2026; tender and Egypt levels from trade coverage, Jun 30 and Jul 29, 2026; benchmark from Trading Economics, accessed Jul 31, 2026. Bars scaled to the highest figure. The China floors are FOB China and the June tender price is CFR India, so the true gap is wider than the table's vertical distance suggests — a CFR number includes freight the FOB numbers do not.
We have found no public report of that floor being formally revised downward, and we flag that as an absence of evidence rather than evidence of absence: minimum-price guidance of this kind is frequently adjusted through customs channels rather than announced. But if the May floor is anywhere near intact, the arithmetic is uncomfortable for the bear case. A floor at $660-690 FOB against a market at $420-445 is not a floor. It is a closed door with a price tag on it.
Ground Truth: The market took 40% off urea on the news that China was back. If the floor still binds, China was never actually back at any price a buyer would pay — the quota was permission to sell into a market that had already fallen below the price the permission was granted at. That reframes the entire collapse: it was a risk-premium unwind wearing a supply story's clothes. And it means the thing to watch on August 11 is not the tender's headline price but its origin mix. If Chinese tonnes are materially absent from the awarded volume, the supply everyone marked prices down for does not exist.
4. What the August 11 tender actually tests
What's new: The tender's structure — not just its size — makes it an unusually clean read on where physical supply is.
Evidence: India's NFL tender covers 1.7 million tonnes, split 1.0 million to the West Coast and 700,000 to the East Coast. Technical and commercial bids open August 11, offers remain valid to August 24, and shipment must complete by September 24. Minimum bid sizes are 45,000 tonnes FOB and 25,000 tonnes CFR. Suppliers subject to US, EU or UK sanctions are excluded; cargoes may not originate from Ukraine, the Sea of Azov, Russian Black Sea ports, or Russian territory within 200 km of the Ukrainian border; floating cargoes are prohibited (trade coverage of the NFL tender announcement, Jul 29, 2026).
| Tender parameter | Value |
|---|---|
| Total volume | 1.7 million tonnes |
| West Coast / East Coast | 1.0 Mt / 0.7 Mt |
| Bids open | Aug 11, 2026 |
| Offer validity | to Aug 24, 2026 |
| Shipment completion | by Sep 24, 2026 |
| Minimum bid | 45,000 t FOB / 25,000 t CFR |
| Origin exclusions | Russia-adjacent origins; sanctioned suppliers; no floating cargo |
Source: trade coverage of India's NFL urea tender announcement, Jul 29, 2026.
Three features of that structure matter more than the tonnage.
The shipment deadline is tight. Award to loaded-and-sailed by September 24 leaves roughly four weeks. That favors sellers with product already produced and positioned, and it explicitly forbids the usual pressure valve — floating cargo. A tender that cannot be filled from inventory already afloat has to be filled from production.
The origin exclusions remove a large, cheap seller. Russian urea is a structural discount origin in the Indian market, and this tender writes it out in unusual geographic detail. That narrows the supply set to the Arab Gulf, North Africa, Southeast Asia, and — if the floor permits — China.
It lands exactly on the seam of China's window. Quota covers June through August. A cargo awarded in mid-August for September 24 shipment sits precisely on the boundary of whether Chinese material can legally participate at all.
Ground Truth: This is not a routine restocking tender. It is a 1.7-million-tonne buy with a four-week fuse, a banned-origin list, and a timing overlap with the exact policy expiry the whole market is watching. Tenders carrying that combination of constraints do not usually clear at the low end of the range — the constraints are a cost, and someone pays it. A grower deferring fall urea on the belief that international weakness will keep flowing through to retail is, in effect, short this tender.
5. What it means for a fall-fill decision
What's new: The practical question for a North American buyer is not where urea trades in Egypt. It is whether the retail price still has downside — and that depends entirely on which of the two series above is leading.
Evidence: DTN's most recent survey week shows the retail nitrogen slide has already largely stopped, whatever the trailing month-over-month figures still say:
| Nutrient | $/ton | w/w $ | MoM | YoY | $/lb N |
|---|---|---|---|---|---|
| Urea | 683 | +1 | −5% | +6% | 0.74 |
| Anhydrous | 962 | −5 | −11% | +26% | 0.59 |
| UAN28 | 473 | −7 | −6% | +13% | 0.85 |
| UAN32 | 461 | −4 | −14% | −7% | 0.72 |
| DAP | 913 | +2 | +1% | +13% | — |
| MAP | 958 | 0 | +1% | +9% | — |
| Potash | 494 | 0 | +2% | +2% | — |
Source: DTN/Progressive Farmer Retail Fertilizer Trends, Jul 29, 2026 (week of Jul 20-24), against Jul 22, 2026 (week of Jul 13-17).
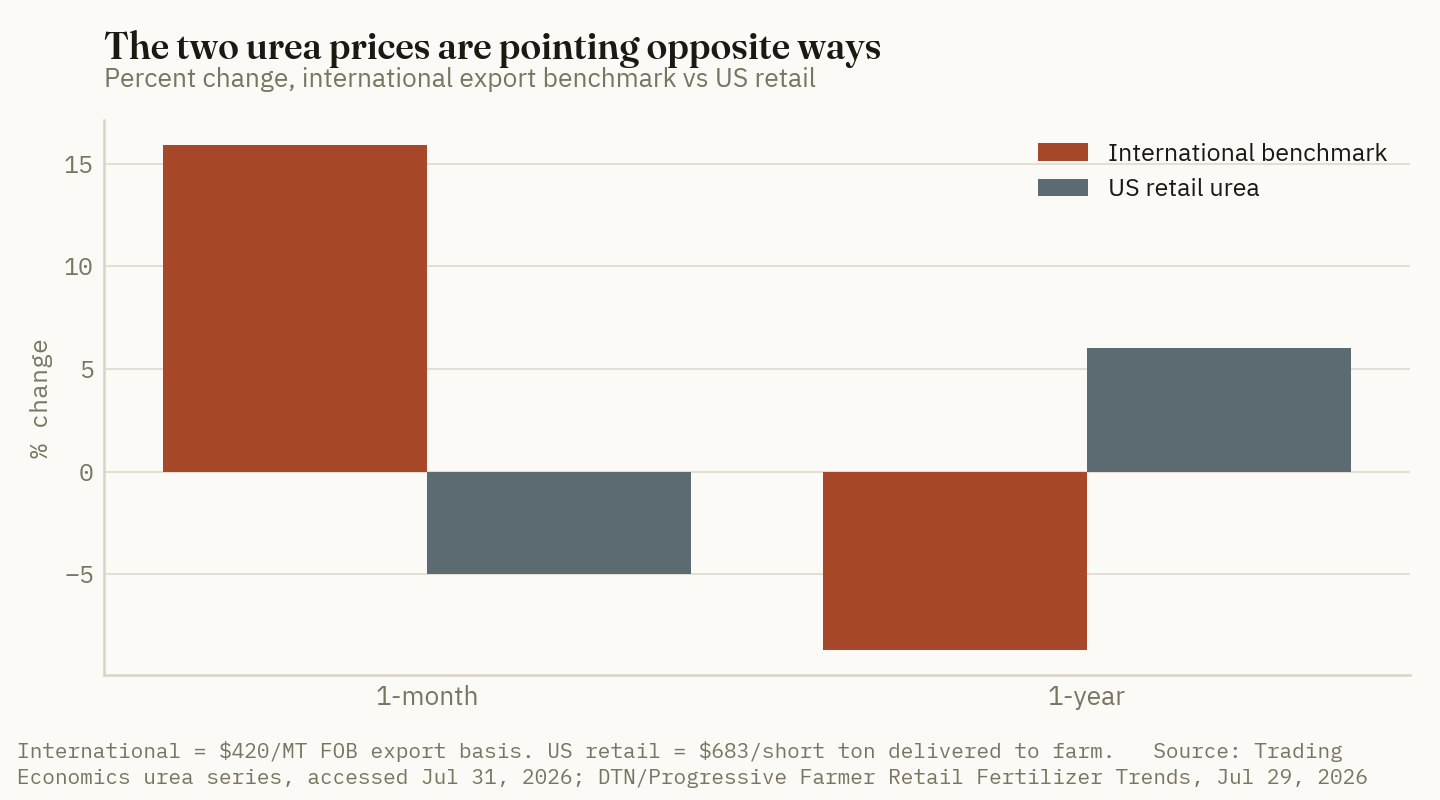
Read the week-over-week column. Urea printed up a dollar. Anhydrous fell $5 after falling $65 the prior week. The month-over-month figures are a trailing four-week average and they are still reporting a slide that has functionally ended. Phosphate and potash both printed flat-to-higher.
So the domestic picture is: the fall has stalled at retail, and the international series that leads it has been rising for a month. Those are the same signal arriving twice.
The counter-case is real and should be stated. Retail urea at $683/ton is 6% above year-ago and reflects inventory bought during the April spike; a dealer sitting on high-cost tons has an incentive to clear them, and that clearing can drag the retail print lower for several more weeks regardless of what the export benchmark does. Trading Economics' own forward model puts urea at $410 by quarter-end and $364 in twelve months — a curve that says the July bounce is a retrace within a downtrend, not a reversal (Trading Economics, accessed Jul 31, 2026). That model has no view on the tender.
Ground Truth: The asymmetry, not the forecast, is the decision. If the August 11 tender clears soft and China's window extends, retail urea grinds down perhaps another 3-5% over the fall — a real saving, but a slow one, arriving after most fall application is already booked. If the tender clears firm on a thin origin list and the Chinese window shuts on August 31, the international benchmark that has already recovered 16% gaps again, and retail follows it up into exactly the weeks a fall buyer needs product. The downside of covering early is a few percent of a nitrogen bill. The downside of waiting is being on the wrong side of a 1.7-million-tonne buy with a four-week fuse. Cover the fall nitrogen you know you need before August 11; leave the speculative tons open.
References
- Trading Economics, urea price series and market commentary, accessed Jul 31, 2026. https://tradingeconomics.com/commodity/urea
- DTN/Progressive Farmer, "Fertilizer Prices Keep Sliding as UAN32 Leads 4 Nutrients in Significant Drops," Jul 29, 2026 (week of Jul 20-24). https://www.dtnpf.com/agriculture/web/ag/crops/article/2026/07/29/fertilizer-prices-keep-sliding-uan32
- DTN/Progressive Farmer, "Fertilizer Prices Continue Downward Trend," Jul 22, 2026 (week of Jul 13-17). https://www.dtnpf.com/agriculture/web/ag/crops/article/2026/07/22/fertilizer-prices-continue-downward
- Profercy, "China reopens urea exports with $660pt price floor," May 26, 2026. https://www.profercy.com/insights/china-reopens-urea-exports-with-660pt-price-floor
- Price-Watch, "Urea Market Outlook as China Resumes Exports," Jun 30, 2026 (June 8 NFL tender at ~$445/t CFR against a ~$890/t April peak; China quota June-August). https://www.price-watch.ai/blog/urea-market-outlook/
- AgroLatam, "India Returns to the Urea Market With a 1.7 Million-Ton Tender as Global Prices Watch Closely," Jul 29, 2026 (tender volumes, dates, origin exclusions, Egypt FOB level). https://www.agrolatam.com/news/india-new-urea-tender-global-fertilizer-prices-2026/
Disclosures
Crop Root Zone is an independent publication. Nothing here is investment advice. Market calls, where included, reflect the editors' own read and are not a recommendation to buy or sell any security.
Corn Export Commitments Have Already Passed USDA's Record Full-Year Forecast
Total commitments stand at 3.429 billion bushels against a 3.325 billion forecast, with weeks left in the marketing year — which makes the August 12 WASDE a revision problem, not a surprise problem.
Two things about the corn export book are true at once, and the marketing decision depends on holding both. Total sales commitments — accumulated exports plus outstanding sales — now stand at 3.429 billion bushels, up almost 23% from the same point in 2024-25 and already above USDA's full-year forecast of a record 3.325 billion bushels. In the same week, new weekly sales for 2025-26 came in at 12.4 million bushels, down 44% week over week. The demand side of the corn balance sheet has outrun the agency's own number with the marketing year nearly over, and the flow of fresh business has slowed to a trickle. The August WASDE lands Wednesday, August 12.
1. What "commitments above the forecast" actually means
What's new: A commitment total that exceeds the full-year export forecast is not an error, and it is not automatically bullish. It is an accounting condition that forces a resolution in one of three ways.
Evidence:
| Corn, 2025-26 marketing year | Bushels |
|---|---|
| Total sales commitments (accumulated exports + outstanding) | 3.429bn |
| USDA full-year export forecast | 3.325bn |
| Commitments in excess of forecast | +104m |
| Change in commitments vs. same period 2024-25 | +~23% |
| Latest weekly new sales, 2025-26 | 12.4m (−44% w/w) |
Source: USDA Foreign Agricultural Service export sales reporting and USDA WASDE, as reported early August 2026.
Commitments are promises. Exports are bushels that physically left. The difference between them — the outstanding balance — has to go somewhere by the time the marketing year closes on August 31, and there are only three destinations:
- They ship. USDA raises the export line in a coming WASDE, and the record gets bigger.
- They roll. Unshipped sales carry into the 2026-27 marketing year as new-crop business, which supports next year's balance sheet rather than this one.
- They cancel. Washouts reduce commitments without ever becoming exports.
Ground Truth: The bullish reading of a 3.429-billion commitment book is that USDA has to raise its export number. The realistic reading is that with three weeks left in the marketing year, physical loading capacity — not demand — is now the binding constraint on how much of that book converts. The bushels that do not move by August 31 are not lost, but they land in the new-crop column, which means the same demand strength that looks like an old-crop story is quietly becoming a 2026-27 story. Price the carry accordingly.
3.429 billion bushels
Total US corn sales commitments for 2025-26 — 104 million bushels above USDA's own full-year forecast for a record export program, with weeks left to ship. (USDA FAS export sales, early August 2026)
2. The weekly number is the one that changed
What's new: The 44% week-over-week drop in new corn sales is the datum that a commitments-based headline hides.
Evidence: A cumulative total near a record can only fall by cancellation; it is a stock, and it goes up almost every week by construction. New weekly sales are a flow, and a flow is what tells you about current demand. Twelve and a half million bushels in a week is a quiet market.
There is a straightforward explanation available, and it is seasonal rather than structural: buyers who need old-crop corn have largely bought it, and buyers who want new-crop corn are waiting for the August 12 WASDE and for harvest to establish a price. That does not make the slowdown meaningless. It means the next meaningful demand signal is a new-crop signal, and it will arrive after the report rather than before it.
| Read | Supports | Against |
|---|---|---|
| Demand is genuinely fading | Weekly sales −44% w/w | Commitments +23% YoY |
| Old-crop book is simply full | Commitments above forecast | — |
| Buyers waiting on WASDE / harvest | Timing of the slowdown | — |
Source: Crop Root Zone assessment of USDA FAS weekly export sales, early August 2026.
3. Soybeans are the opposite shape: a small book against a very large target
What's new: New-crop soybean sales of roughly 65 million bushels were led by nearly 39 million bushels to China. Measured against what China has reportedly committed to buy, that is an early and small start.
Evidence: Outstanding sales to China as of July 30 totalled 3.11 million tonnes — about 114.3 million bushels — which is just over 12% of a reported commitment to purchase 25 million tonnes (roughly 919 million bushels) of US soybeans annually for three years. China has been active in bursts, booking up to 15 cargoes, roughly 900,000 tonnes, in a third major purchase inside a week.
| China soybean purchase progress | Volume | % of annual target |
|---|---|---|
| Reported annual purchase target | 25.0 MMT (≈919m bu) | 100% |
| Outstanding sales to China, Jul 30 | 3.11 MMT (≈114.3m bu) | 12.4% |
| Remaining to reach target | ~21.9 MMT | 87.6% |
Source: USDA FAS export sales as of Jul 30, 2026; reported purchase commitment terms as publicly described. Bushel conversions at 36.7437 bu/tonne are Crop Root Zone's.
The corn book has outrun its forecast; the soybean book has 88% of its target still to do. These are different risks. Corn's risk is execution — can the bushels physically load. Soybeans' risk is follow-through — does the buying continue at a pace that gets from 12% to anywhere near 100%.
Ground Truth: Do not average these two into a single "exports are strong" view. For a grower with both crops in the ground, corn's demand risk is now largely behind the price and soybeans' is almost entirely ahead of it. That argues for treating corn sales as a carry and basis decision, and treating bean sales as a scale-up decision against confirmed purchases — not for moving both on the same day for the same reason.
4. The crop underneath the demand is losing condition
What's new: Corn was rated 61% good to excellent as of August 2, down two points from 63% the prior week and down from 67% on July 19 — a second consecutive weekly decline. Soybeans held at 63%, with 88% blooming and 62% setting pods (USDA NASS Crop Progress, Aug 3, 2026).
Evidence:
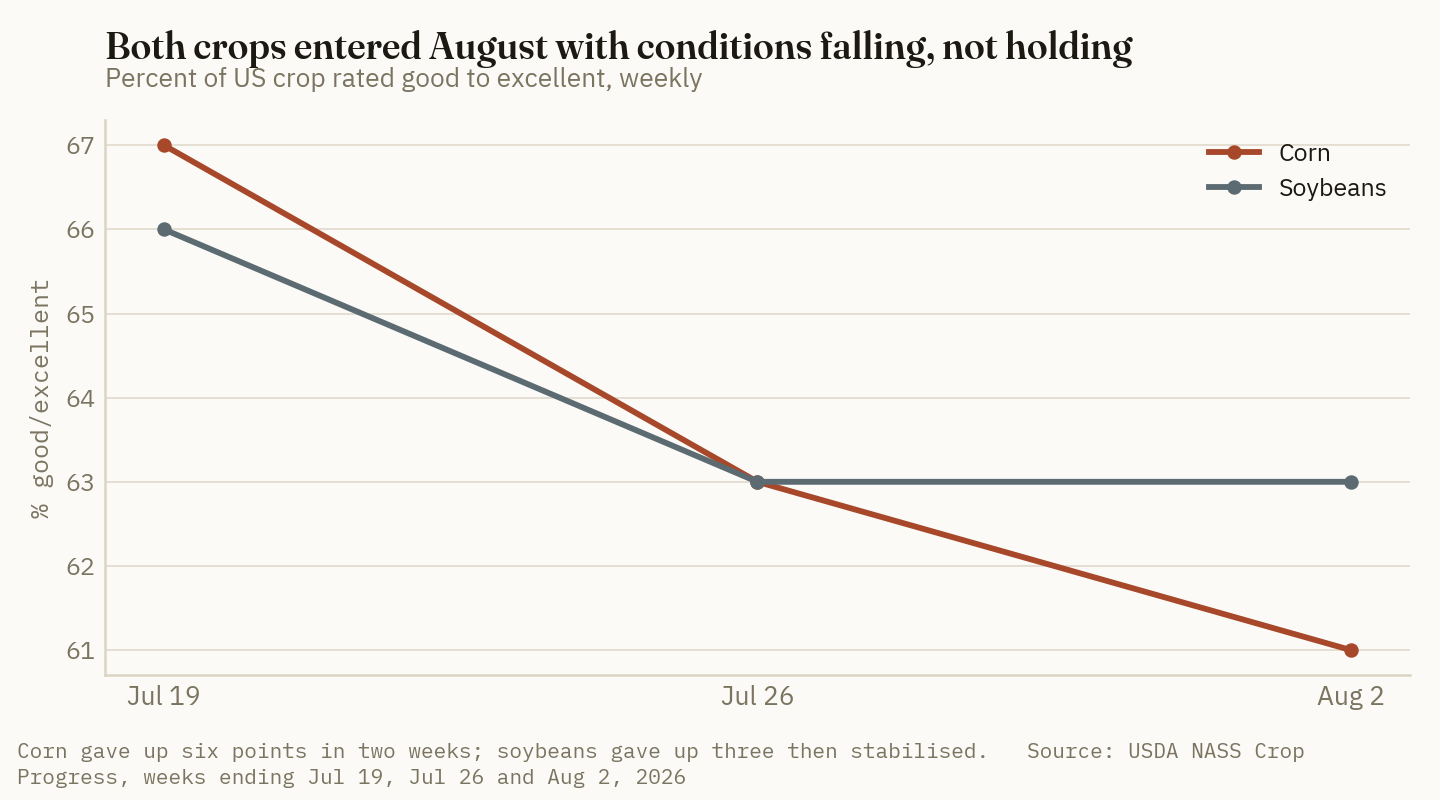
| Week ending | Corn G/E | Soybeans G/E |
|---|---|---|
| Jul 19, 2026 | 67% | 66% |
| Jul 26, 2026 | 63% | 63% |
| Aug 2, 2026 | 61% | 63% |
Source: USDA NASS Crop Progress, weeks ending Jul 19, Jul 26 and Aug 2, 2026.
Six points of corn condition in two weeks, arriving during pod set and grain fill, is a real deduction from the yield distribution — and it arrives in the window the August WASDE is built to measure. Conditions in the Plains and the Mississippi Delta have been hot and mostly dry, while a slow-moving front brought rain and cooler temperatures to parts of the Corn Belt.
The combination that matters for August 12 is this: a demand book already above forecast, and a supply side that has been deteriorating for two weeks. Those push the balance sheet the same direction. That is unusual, and it is why the report is a revision problem rather than a surprise problem — the direction is fairly well signposted; the magnitude is not.
5. Why this particular WASDE carries more weight than the last three
What's new: The August report is not just the next monthly update. It is the first production estimate of the season built on surveyed field data rather than on trend assumptions — NASS collects farmer surveys and objective yield measurements in late July and early August, and the August WASDE is where those first enter the corn and soybean yield figures.
Evidence: That timing is why a two-week slide in condition ratings during pod set and grain fill matters more now than the same slide would have in June. The deterioration happened inside the window the survey is measuring.
| Input to the Aug 12 report | Direction since the last WASDE |
|---|---|
| Corn condition (G/E) | Down 6 points since Jul 19 |
| Soybean condition (G/E) | Down 3 points since Jul 19, then steady |
| Corn export commitments | Above the full-year forecast |
| Weekly new corn sales | Sharply lower |
| First survey-based yield estimate | Enters the report for the first time |
Source: USDA NASS Crop Progress, weeks ending Jul 19–Aug 2, 2026; USDA FAS export sales, early August 2026. Table is Crop Root Zone's compilation.
Two of those five lines push the balance sheet tighter, one pushes it looser, and one — the survey yield — is simply unknown until the release. That is an unusually asymmetric setup, and it is worth being explicit about the asymmetry rather than calling a direction: the demand side of the report has already been observed, publicly, and it came in strong. Only the supply side is genuinely unknown on Wednesday morning.
Ground Truth: When the demand half of a report is already public and the supply half is not, the market's reaction function narrows to one variable. That makes the release more binary than usual, not less — and it is an argument for having orders resting rather than planning to interpret the number faster than everyone else at 11:00 a.m. Central.
6. What to do before Wednesday
The specific decisions this creates, in order of urgency:
- Old-crop corn still unpriced. The demand argument for holding it has largely already been made — commitments are above the forecast. The remaining upside depends on a WASDE yield cut, which is a coin-flip on magnitude even if the direction is likely. This is the week to have a target order working rather than a plan to react.
- Basis, not futures, is where the export book shows up. A record commitment total with loading pressure into August 31 is a basis story at river and rail terminals with export pull. Check your local bid against the terminal, not against the board.
- New-crop beans. Twelve percent of the way into a three-year purchase target is not a reason to sell aggressively ahead of confirmed business. Scale into strength on announced purchases; do not front-run a target.
- Do not re-cut the fertility budget on a WASDE. Whatever the report does to price, the input side of 2027 is being set by producer economics that have nothing to do with corn yield — and phosphate in particular is priced off a cost stack, not off a demand curve.
References
- USDA Foreign Agricultural Service, weekly US Export Sales reporting, early August 2026 — https://www.fas.usda.gov/data/commodities/soybeans
- USDA NASS, Crop Progress, week ending Aug 2, 2026, as reported Aug 3, 2026 — https://www.dtnpf.com/agriculture/web/ag/news/article/2026/08/03/usda-crop-progress-corn-rated-61-63
- USDA NASS, Crop Progress, week ending Jul 26, 2026 — https://www.dtnpf.com/agriculture/web/ag/news/article/2026/07/27/usda-crop-progress-corn-rated-63-63
- Brownfield Ag News, "61% of U.S. corn, 63% of soybeans good to excellent," Aug 3, 2026 — https://www.brownfieldagnews.com/news/61-of-u-s-corn-63-of-soybeans-good-to-excellent/
- Brownfield Ag News, "Unknown, China boost new crop U.S. soybean export sales," Jul–Aug 2026 — https://www.brownfieldagnews.com/news/unknown-china-boost-new-crop-u-s-soybean-export-sales/
- USDA, World Agricultural Supply and Demand Estimates (WASDE), current 2025-26 corn export forecast; next release Aug 12, 2026.
Disclosures
Crop Root Zone is an independent publication. Nothing here is investment advice. Market calls, where included, reflect the editors' own read and are not a recommendation to buy or sell any security.
The 2027 Acreage Argument Is Being Held in the Fertilizer Column. The Forward Curve Moved Nine Times as Much.
A month of falling nitrogen is worth about $8 an acre to corn. The 2027 board has already handed corn roughly $75 — and dropped the new-crop price ratio from 2.55 to 2.35 while the debate stayed on inputs.
Three days apart in early August, two credible sources reached opposite conclusions about what to plant in 2027. On August 4, farmdoc daily published Historic Corn and Soybean Profitability and 2027 Planting, which recommends growers "consider planting more soybeans than corn," resting the case on three legs: prices near their long-run averages, general cost inflation that falls harder on corn, and high nitrogen fertilizer costs. On August 5, DTN's retail survey printed every nitrogen product down 4-14% month over month. Meanwhile the 2027 futures board has been quietly doing something neither piece leads with: December 2027 corn now trades at a premium to December 2026, and November 2027 soybeans at a discount to November 2026. The acreage argument is being conducted in the fertilizer column. The money moved in the revenue column.
1. The disagreement, stated precisely
What's new: The two outlooks do not disagree about arithmetic. They disagree about which direction nitrogen is heading, and they were written on either side of a print that answered it.
Evidence: farmdoc's August 4 piece documents that corn-minus-soybean returns have been negative in most years since 2013, with 2020, 2021 and 2022 the exceptions, and uses 2024 on central Illinois high-productivity land as its worked example: corn returned $281/acre to operator and land, soybeans $322/acre — soybeans ahead by $41. Its 2027 case leans on prices sitting near long-run averages (roughly $4.50 corn and $11.00 soybeans since 2006) and on nitrogen costs staying elevated.
Reporting at Farm Progress on the same 2027 question takes the other side of the bottom line, putting 2027 corn at a projected loss of roughly $77/acre against roughly $93/acre for soybeans — corn ahead by about $16 — on the grounds that the red ink for corn is easing slightly while soybean losses are rising.
| Source | Date | 2027 call | Margin cited |
|---|---|---|---|
| farmdoc daily | Aug 4, 2026 | Plant more soybeans | Soybeans ahead (2024 worked example: +$41/acre) |
| Farm Progress commentary | Aug 2026 | Corn's ledger easing | Corn ahead by ~$16/acre on projected 2027 losses |
Source: farmdoc daily, Aug 4, 2026; Farm Progress commentary, "Corn vs. soybeans 2027: Input costs shift profit outlook," Aug 2026, figures as reported.
Both can be right about their own inputs. A $41/acre soybean advantage and a $16/acre corn advantage are 57 dollars apart on a corn acre that costs somewhere north of $900 to grow — well inside the error bar of any 2027 projection made in August 2026. That is exactly why the question is worth taking apart rather than picking a side of.
Ground Truth: When two careful analyses of the same decision land $57/acre apart, the useful work is not deciding which one is right. It is identifying which single assumption they differ on and pricing that assumption. Here it is nitrogen — and nitrogen is now a dated, published number rather than a forecast.
2. Pricing the nitrogen assumption
What's new: The August 5 DTN print makes the nitrogen assumption checkable. On a per-pound-of-nitrogen basis, anhydrous is $0.59/lb.N, urea $0.75, UAN32 $0.72, UAN28 $0.83.
Evidence: Working the month's decline back through DTN's own published percentage changes: anhydrous fell 7% on the month, which implies roughly $0.629/lb.N a month ago against $0.585 now — a decline of about $0.044/lb.N. On a 180 lb.N corn program, that is $7.92/acre.
| Nitrogen program | A month ago* | Now | Change per acre |
|---|---|---|---|
| 180 lb.N as anhydrous | $113.22* | $105.30 | −$7.92 |
| 180 lb.N as urea | $139.81* | $134.28 | −$5.53 |
| 180 lb.N as UAN32 | $150.10* | $129.10 | −$21.00 |
*Prior-month costs derived from DTN's published month-over-month percentage changes applied to the Aug 5, 2026 print, not separately observed. Source: DTN/Progressive Farmer, Aug 5, 2026; rate assumption 180 lb.N/acre.
Set that against the size of the gap it is supposed to close. farmdoc's own 2026 Illinois budgets put fertilizer at roughly $229/acre for corn and roughly $61/acre for soybeans — a $168/acre structural difference that exists before any price move. A month of falling nitrogen closed 4.7% of it on an anhydrous program, 12.5% on a UAN32 program.
4.7%
The share of the corn-versus-soybean fertilizer gap that the month's anhydrous price decline actually closed. The gap is roughly $168/acre; the decline was worth about $7.92. (Derived from DTN/Progressive Farmer, Aug 5, 2026 and farmdoc daily 2026 Illinois budgets)
Ground Truth: The nitrogen decline is real and it is not decisive. Anyone framing "cheap nitrogen brings corn acres back" is asking an $8/acre move to overturn a $168/acre structural cost difference. It cannot, and it will not, and the year-over-year figure is the reason: anhydrous is still 26% more expensive than a year ago. A grower who set their 2027 corn budget on last summer's nitrogen is roughly $22/acre short on a 180 lb.N program, not ahead.
3. What actually moved: the 2027 forward curve
What's new: While the input argument ran, the deferred board repriced. December 2027 corn is trading at a premium to December 2026, and November 2027 soybeans at a discount to November 2026 — a spread that moves the 2027 price ratio decisively toward corn.
Evidence: December 2026 corn settled at 462.00 cents on August 6, 2026 and November 2026 soybeans at 1177.75 cents. Reporting at Farm Progress puts December 2027 corn at a 32.5-cent premium to December 2026 and November 2027 soybeans at a 16.25-cent discount to November 2026. Carrying those relationships forward:
| Contract | Price | New-crop ratio (beans ÷ corn) |
|---|---|---|
| Dec 2026 corn | $4.62 | — |
| Nov 2026 soybeans | $11.78 | 2.55 |
| Dec 2027 corn (implied) | $4.95* | — |
| Nov 2027 soybeans (implied) | $11.62* | 2.35 |
*Implied from December 2026 and November 2026 settlements of Aug 6, 2026 plus the 2027-to-2026 spreads reported by Farm Progress; not directly observed 2027 settlements. Source: CME settlements, Aug 6, 2026; Farm Progress commentary, Aug 2026.
The soybean-to-corn ratio is the oldest acreage heuristic in the book, and the rule of thumb has not changed: above roughly 2.5 the board is paying you to plant soybeans, below roughly 2.4 it is paying you to plant corn. The 2026 crop sits at 2.55. The implied 2027 crop sits at 2.35. That is a move across the entire indifference band in one contract year.
Translated into revenue at illustrative yields — 200 bu/acre corn and 60 bu/acre soybeans, stated as assumptions, not forecasts:
| Crop | 2026 revenue/acre | 2027 revenue/acre (implied) | Change |
|---|---|---|---|
| Corn @ 200 bu | $924.00 | $989.00 | +$65.00 |
| Soybeans @ 60 bu | $706.65 | $696.90 | −$9.75 |
| Corn-minus-soybean swing | +$74.75 |
Yields are illustrative assumptions, not forecasts. Prices from CME settlements, Aug 6, 2026 and implied 2027 spreads as reported by Farm Progress, Aug 2026.
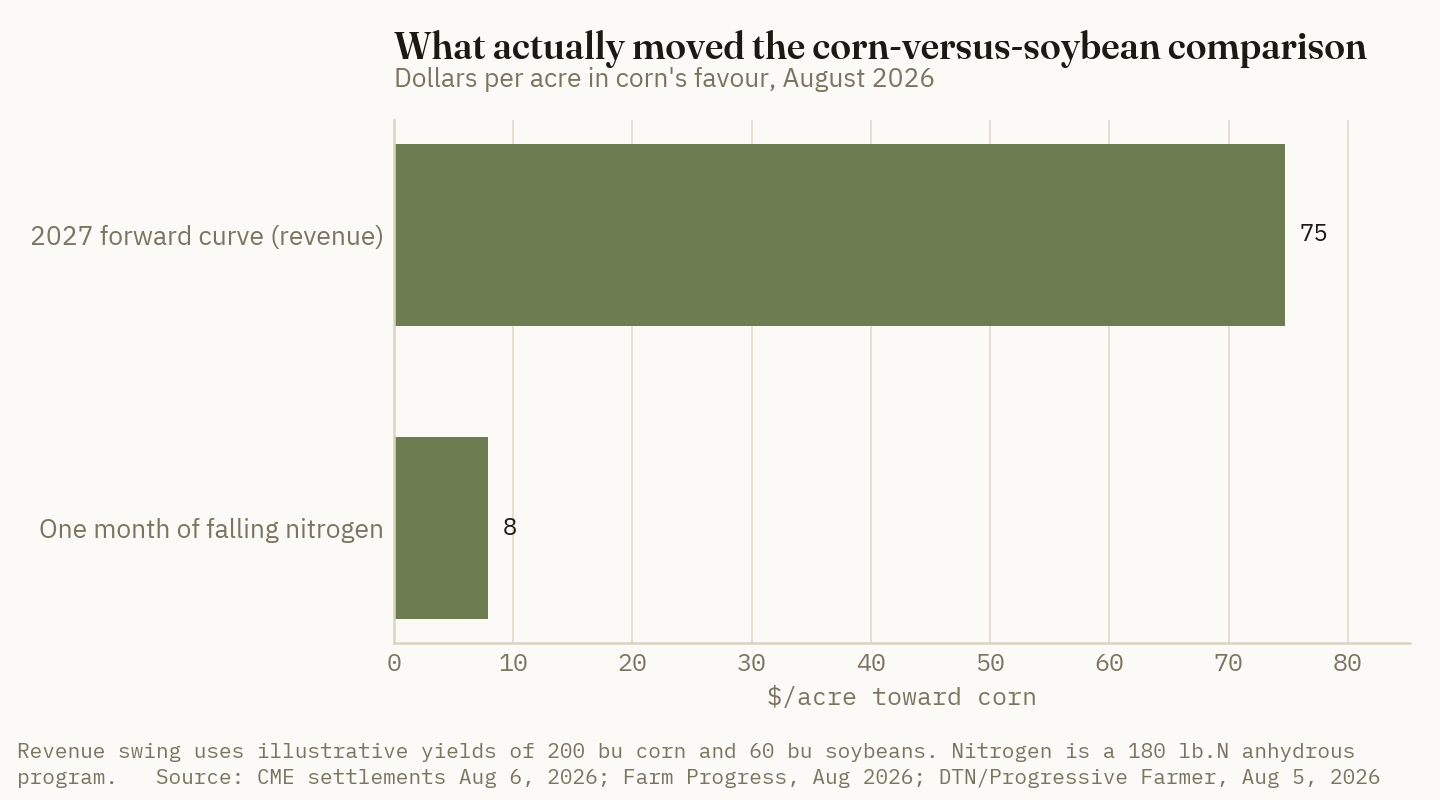
| What moved the corn-vs-soybean comparison | $/acre toward corn | |
|---|---|---|
| 2027 forward curve (revenue) | 74.75 | ██████████ |
| One month of nitrogen decline (anhydrous, 180 lb.N) | 7.92 | █ |
Source: CME settlements Aug 6, 2026; Farm Progress, Aug 2026; DTN/Progressive Farmer, Aug 5, 2026. Yields illustrative.
Ground Truth: The debate is being held in the wrong column. Nine dollars of forward revenue moved for every dollar of nitrogen. And the direction matters as much as the size: the board is not offering corn a better 2027 because inputs got cheaper — it is offering a 32-cent carry into a second consecutive year of heavy corn supply, which is a demand signal, not a cost one. A cost advantage can evaporate with one Gulf outage. A 32-cent forward premium is a contract a grower can actually sell into.
4. What this changes about the decision, and what it doesn't
What's new: The practical consequence is a sequencing point, not a crop switch.
Evidence: USDA's June 30, 2026 Acreage report put 2026 planted corn at 95.3 million acres, down 3.5 million from the prior year, with soybeans at 85.4 million, up 5%. That shift is done and in the ground. The 2027 decision is roughly eight months from being made and is currently being argued from two moving numbers: a fertilizer market that has printed weekly for a month, and a forward curve that trades every day.
Only one of those two is sellable today. A grower can price 2027 corn revenue right now by selling the December 2027 contract at its premium. A grower cannot lock 2027 nitrogen in any comparable way — fall fill offers cover this fall's application, not the following crop's, and the year-over-year figure says the ammonia market is still 26% above where it was.
| Component of the 2027 decision | Can be priced today? | Currently favors |
|---|---|---|
| New-crop revenue | Yes — Dec 2027 / Nov 2027 board | Corn |
| Nitrogen cost | No — no comparable forward for the 2027 crop | Soybeans (structurally) |
| Phosphate and potash | Partially — fall fill | Neutral; P and K flat to higher |
| Land and labour cost inflation | No | Soybeans |
Source: USDA NASS Acreage, Jun 30, 2026; CME; DTN/Progressive Farmer, Aug 5, 2026; farmdoc daily, Aug 4, 2026.
Ground Truth: If you believe the 2027 corn case, the way to act on it in August 2026 is to sell some December 2027 corn, not to order nitrogen. The revenue side is priceable now and the cost side is not, which means the honest position is to take the part of the trade the market will actually give you and leave the fertilizer decision open until fall fill posts. Locking acres in August on a cost assumption you cannot hedge is the mistake both of these outlooks are, in different directions, inviting.
Market read: No market call. This piece is about a grower's own acreage decision; forcing a ticker onto it would be reaching.
References
- farmdoc daily, University of Illinois, "Historic Corn and Soybean Profitability and 2027 Planting," Aug 4, 2026 — https://farmdocdaily.illinois.edu/2026/08/historic-corn-and-soybean-profitability-and-2027-planting.html
- Farm Progress, "Corn vs. soybeans 2027: Input costs shift profit outlook," Aug 2026 — https://www.farmprogress.com/commentary/corn-vs-soybeans-2027-input-costs-shift-profit-outlook
- DTN/Progressive Farmer, "Fertilizer Prices Fall as UAN32 Leads Significant Drops Heading Into August," Aug 5, 2026 — https://www.dtnpf.com/agriculture/web/ag/crops/article/2026/08/05/fertilizer-prices-fall-uan32-leads
- USDA NASS, Acreage, Jun 30, 2026.
- CME Group, December 2026 corn and November 2026 soybean settlements, Aug 6, 2026.
- farmdoc daily, University of Illinois, "Fertilizer Decisions for the 2026 Crop Year," Aug 19, 2025 — https://farmdocdaily.illinois.edu/2025/08/fertilizer-decisions-for-the-2026-crop-year.html
Disclosures
Crop Root Zone is an independent publication. Nothing here is investment advice. Market calls, where included, reflect the editors' own read and are not a recommendation to buy or sell any security.
You Have 26 Days on Base Acres and No Date at All on the Election
The Aug. 31 base allocation review is the only firm deadline in the 2026 farm program — and ARC's $5.03 corn benchmark is currently worth more than PLC's capped $4.42 reference price.
Two farm-program clocks are running at very different speeds. The first has 26 days on it: eligible landowners have until August 31, 2026 to review and act on FSA base allocation summaries under the 30-million-acre base acre expansion, a window that opened June 1 (USDA FSA, May 26, 2026). The second has no time on it at all — FSA has said the 2026 ARC/PLC election and enrollment period will be announced later, with county offices indicating sign-up may not open until fall (Farm Policy News, Jan 2026). One of those is a decision you can still lose by inaction. The other is a decision you cannot yet make. Most of the attention this summer has gone to the second.
1. The base acre window is the one with a deadline
The Working Families Tax Cuts Act, signed July 4, 2025, authorized up to 30 million new base acres for farms with program-crop planting history but insufficient existing base, beginning with the 2026 crop year (USDA FSA, May 26, 2026; American Farm Bureau Federation, Jul 17, 2025).
The allocation test is mechanical, and worth stating precisely because it decides whether a given FSA farm is in or out:
- The farm's average planted and prevented-planted acres across 2019–2023 must exceed its total existing base acres as of September 30, 2024, excluding unassigned base.
- A covered commodity must have been planted or prevented from being planted in at least one of the 2019–2023 crop years.
- Total base acres on the farm cannot exceed the farm's total acreage.
- No existing base has to be surrendered to take new base (American Farm Bureau Federation, Jul 17, 2025).
Source: USDA Farm Service Agency, "USDA Announces Base Acre Increase Opportunity," May 26, 2026.
Summaries are available through the FSA portal at fsa.usda.gov/arc-plc with a Login.gov account, or at the county office (USDA FSA, May 26, 2026). FSA has been pushing the same message through its bulletin channel — review the base allocation summary by Aug. 31.
The reason this is not a paperwork errand: if nationwide requests exceed 30 million acres, USDA applies an across-the-board, prorated reduction to all approved new base acres (USDA FSA, May 26, 2026). That is a pool, not an entitlement, and it is shared with everyone else who files.
Ground Truth: A prorated pool rewards filing and punishes waiting, but not in the way most producers assume. The proration is applied to approved acres, so filing early does not buy a bigger share — the math is national and settled after the window closes. What filing does buy is optionality on a decision whose downside is exactly zero: new base acres cannot reduce existing base, and taking the allocation does not obligate a program election. There is no scenario in which reviewing the summary costs an eligible landowner anything. The only way to lose here is to let August 31 pass, and the most likely reason a landowner does that is that the election headlines have been telling them all summer that the program is delayed.
The two clocks are being confused for each other. The election is delayed. The base acre review is not.
2. Every farm has to elect again — and the last two years didn't require that
For the 2025 crop year, the Act let farms automatically receive the higher of ARC-CO or PLC, with no election at all (American Farm Bureau Federation, Jul 17, 2025). That was a one-year provision. For 2026, every farm must make a new program election to be eligible for a payment. A farm that produces no election produces no payment, regardless of how prices land.
That matters more this year than it usually would, because a producer whose last two program interactions were "automatic" has no recent habit of electing. The 2025 automatic-higher-of rule was generous and it was temporary, and the muscle memory it built is the wrong one for 2026.
The program parameters themselves also moved under the Act:
| Provision | Before | 2026 onward |
|---|---|---|
| ARC-CO revenue guarantee | 86% of benchmark | 90% of benchmark |
| ARC-CO maximum payment | 10% of benchmark revenue | 12% of benchmark revenue |
| Statutory reference price, corn | $3.70/bu | $4.10/bu |
| Statutory reference price, soybeans | $8.40/bu | $10.00/bu |
| Annual commodity payment limit | $125,000 | $155,000, inflation-indexed |
| New base acres available | — | up to 30 million |
Sources: American Farm Bureau Federation, Jul 17, 2025; Farm Bureau Market Intel, Mar 3, 2026. Statutory reference price increases across covered commodities range 10–21%.
Both ARC changes cut in the same direction: a higher guarantee triggers payments sooner, and a higher cap lets them run further. That is a meaningful improvement to ARC's expected value, and it is permanent. Hold that thought.
3. The two prices that decide the 2026 election
Strip the election down and it is a comparison of two numbers per crop: PLC's effective reference price, and ARC's benchmark price. Everything else is yield mechanics.
| Crop | PLC effective ref. price, 2026/27 | ARC benchmark price, 2026 | Projected 2026 MYA | 2026 crop insurance spring price |
|---|---|---|---|---|
| Corn | 4.42 | 5.03 | 4.20 | 4.62 |
| Soybeans | 10.71 | 12.17 | 10.30 | 11.09 |
| Wheat | 6.35 | 6.98 | 5.00 | 6.19 |
All $/bu. Source: Farm Bureau Market Intel, "Risk Management Options for 2026: Corn, Soybeans and Wheat," Mar 3, 2026.
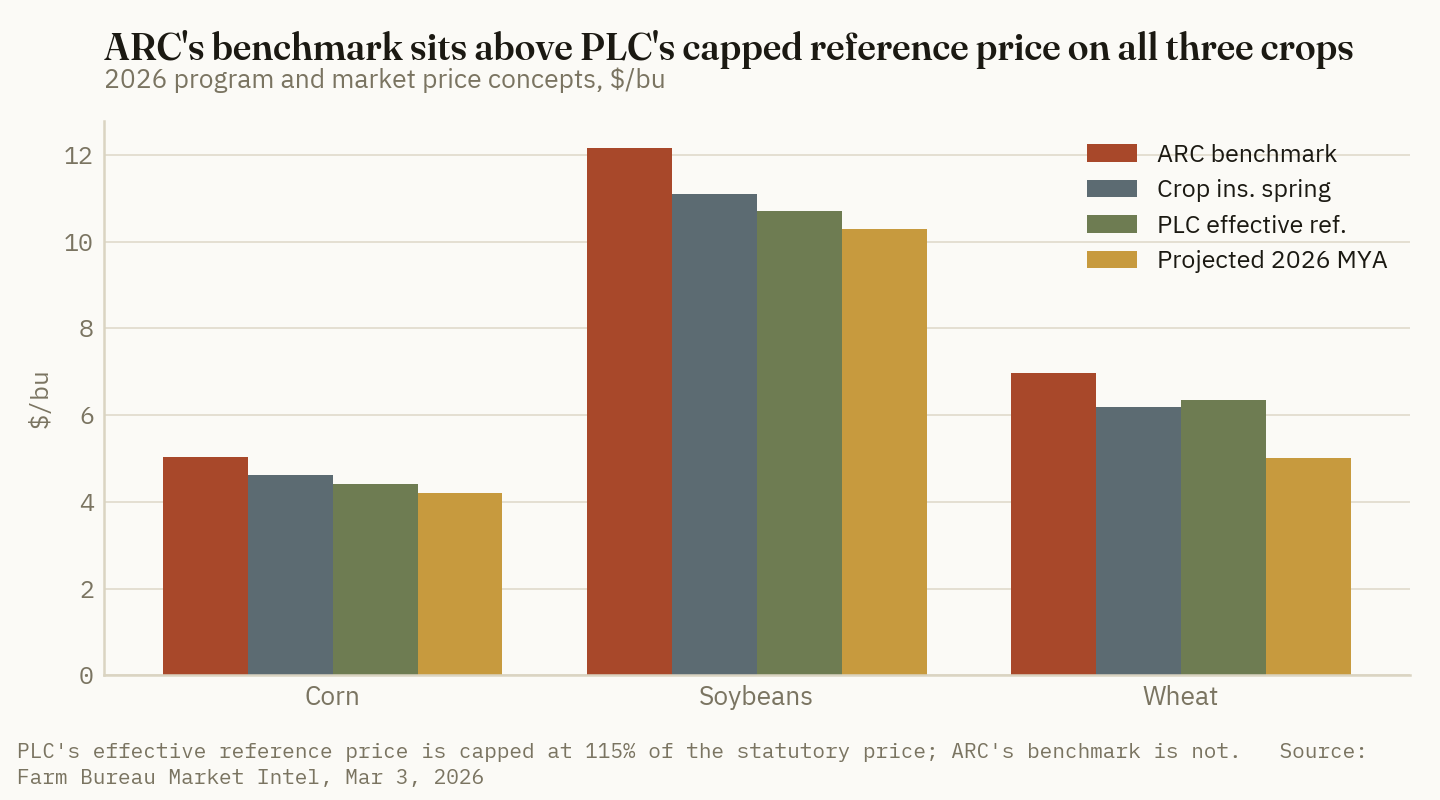
For corn, the same three numbers stacked:
| Corn price concept | $/bu | |
|---|---|---|
| ARC benchmark | 5.03 | ██████████ |
| Crop insurance spring | 4.62 | █████████ |
| PLC effective reference | 4.42 | █████████ |
| Projected 2026 MYA | 4.20 | ████████ |
Source: Farm Bureau Market Intel, Mar 3, 2026.
$0.61/bu
The 2026 gap between ARC's corn benchmark price ($5.03) and PLC's effective reference price ($4.42) — the single largest input into this year's election. (Farm Bureau Market Intel, Mar 3, 2026)
Why the gap exists. PLC's effective reference price escalates off an olympic-average formula but is capped at 115% of the statutory reference price. With corn's statutory price now $4.10, that cap is $4.715, and the 2026 effective price of $4.42 sits underneath it. ARC's benchmark price carries no such cap — it is a moving olympic average of recent marketing-year averages, and it is still carrying the high-price years of the early 2020s.
What that is worth, roughly. Take a corn farm at a 150-bushel PLC payment yield and a 190-bushel county benchmark yield, and run both programs against the projected $4.20 MYA. Both pay on 85% of base acres.
| PLC | ARC-CO | |
|---|---|---|
| Trigger price / revenue | $4.42/bu | $860.13/acre (90% of $955.70) |
| Actual price / revenue | $4.20/bu | $798.00/acre |
| Gross shortfall | $0.22/bu | $62.13/acre |
| × payment or benchmark yield | × 150 bu | — |
| Gross payment per base acre | $33.00 | $62.13 |
| × 85% payment acres | × 0.85 | × 0.85 |
| Payment per base acre | $28.05 | $52.81 |
| Cap check (12% of benchmark) | n/a | $114.68 — not binding |
Crop Root Zone calculation. Prices per Farm Bureau Market Intel, Mar 3, 2026. Payment yield (150 bu) and county benchmark yield (190 bu) are illustrative assumptions, not sourced values — both are farm- and county-specific and will move this result substantially. Actual county yields are unknown at this writing.
On those assumptions ARC pays roughly $25/base acre more than PLC. Change the county yield and that reverses: ARC is a revenue program, so a county that yields well above benchmark can collect nothing while PLC — which is indifferent to yield — still pays its $28.05. That asymmetry is the entire reason the election is not automatic.
Ground Truth: The 2026 election is being decided by a moving average, not by a forecast. ARC's $5.03 corn benchmark is not a view about 2026 prices; it is arithmetic on prior marketing years, and those years are rolling off. PLC's $4.42 is anchored to a statute that just went up and is capped at 115%. So ARC is temporarily rich and structurally fading, while PLC is permanently repriced and stable. The correct read for a producer with normal-to-poor expected county yields is that ARC is the better 2026 answer for exactly the reason it will be the worse 2028 answer — and that a single election should not be mistaken for a strategy. Elect ARC for the benchmark you can see; do not assume it survives the roll.
4. What the delay is actually costing
There is a real cost to an election deadline that hasn't been set, and it is not administrative inconvenience. Sign-up pushed toward fall means the election gets made with more of the 2026 crop in the bin — more information about county yields, which is genuinely useful for choosing between a yield-sensitive program and a yield-indifferent one.
That is the upside, and it is worth having. The downside is that both the base acre allocation and the crop insurance decisions for 2027 will be made before the 2026 election is settled, so the farm's total risk position gets assembled out of order.
Note also what the price stack in Section 3 says about the year underneath all this. The projected 2026 MYA for corn is $4.20; the crop insurance spring price was $4.62; December 2026 futures traded at 461-6 on August 5 (Barchart, Aug 5, 2026). Farm Bureau's own read is that projected market prices remain below estimated break-even levels across all three major crops (Farm Bureau Market Intel, Mar 3, 2026). This is a year in which the program payment is not a rounding error on the margin — it is a visible share of it. That is precisely when an unmade election is expensive.
Market read: none. Program election mechanics don't map to a public equity, and forcing a ticker into this piece would be reaching.
5. The next 26 days, in order
Pull the base allocation summary. Portal at fsa.usda.gov/arc-plc with Login.gov, or the county office. This is the landowner's action, not the operator's — on rented ground, the summary goes to the owner, and the tenant may never see it unless they ask.
Check the 2019–2023 history against the September 30, 2024 base. The test is whether average planted plus prevented-planted acres over those five years exceeds existing base. Prevented plant counts, and on farms with a bad 2019 that is not a small distinction.
File before August 31 even if the acreage looks marginal. The pool prorates; a small approved allocation that gets cut back is still larger than no allocation. There is no cost to being in.
Do not wait on the election to do any of the above. They are separate decisions on separate clocks, and only one of them expires this month.
References
- USDA Farm Service Agency, "USDA Announces Base Acre Increase Opportunity for Agriculture Risk and Price Loss Coverage Safety Net Programs," May 26, 2026 — https://www.fsa.usda.gov/news-events/news/05-26-2026/usda-announces-base-acre-increase-opportunity-agriculture-risk-price
- American Farm Bureau Federation, "One Big Beautiful Bill Act: Final Agricultural Provisions," Jul 17, 2025 — https://www.fb.org/market-intel/one-big-beautiful-bill-act-final-agricultural-provisions
- Farm Bureau Market Intel (Faith Parum), "Risk Management Options for 2026: Corn, Soybeans and Wheat," Mar 3, 2026 — https://www.fb.org/market-intel/risk-management-options-for-2026-corn-soybeans-and-wheat
- Farm Policy News, University of Illinois, "ARC, PLC Signup to be Significantly Delayed," Jan 2026 — https://farmpolicynews.illinois.edu/2026/01/arc-plc-signup-to-be-significantly-delayed/
- Federal Register, "Changes to Agriculture Risk Coverage, Price Loss Coverage, and Dairy Margin Coverage Programs," Jan 12, 2026 — https://www.federalregister.gov/documents/2026/01/12/2026-00313/changes-to-agriculture-risk-coverage-price-loss-coverage-and-dairy-margin-coverage-programs
- USDA Farm Service Agency, "Review Your FSA Base Allocation Summary by Aug. 31," bulletin, 2026 — https://content.govdelivery.com/accounts/USDAFARMERS/bulletins/4196431
- Barchart, corn futures quote ZCZ26, accessed Aug 5, 2026 — https://www.barchart.com/stocks/quotes/ZCZ26
Disclosures
Crop Root Zone is an independent publication. Nothing here is investment advice. Market calls, where included, reflect the editors' own read and are not a recommendation to buy or sell any security.
The Board Is Paying 12.5 Cents to Carry Corn to March. Commercial Storage Costs About 30 to Reach January.
December-to-March carry covers interest and roughly a quarter of a commercial storage bill — which makes 2026 a basis year, not a carry year, and puts the whole return on the bin you already own.
December 2026 corn settled at 461-6 and March 2027 at 474-2 in Wednesday trade — a carry of 12.5 cents a bushel across the three months between the two contracts, or 4.17 cents a month (Barchart, Aug 5, 2026; TradingView CBOT ZCH27, accessed Aug 5, 2026). Commercial storage for corn runs roughly 30 cents a bushel just to carry from harvest to January (Peoples Company, accessed Aug 5, 2026). Those two numbers do not reconcile, and the failure to reconcile is the marketing decision for this crop. The board is not offering to pay for commercial storage. It is offering to pay interest, and a bit more, to whoever already owns the bin.
1. What the board is actually paying
The front of the corn curve on August 5:
| Contract | Symbol | Price | Spread from prior | Months | Carry per month |
|---|---|---|---|---|---|
| Sep 2026 | ZCU26 | 437-6 | — | — | — |
| Dec 2026 | ZCZ26 | 461-6 | +24.00¢ | 3 | 8.00¢ |
| Mar 2027 | ZCH27 | 474-2 | +12.50¢ | 3 | 4.17¢ |
Prices: Barchart, Aug 5, 2026 (ZCU26, ZCZ26); TradingView CBOT ZCH27, accessed Aug 5, 2026. Carry-per-month is a Crop Root Zone calculation on the interval between contract months.
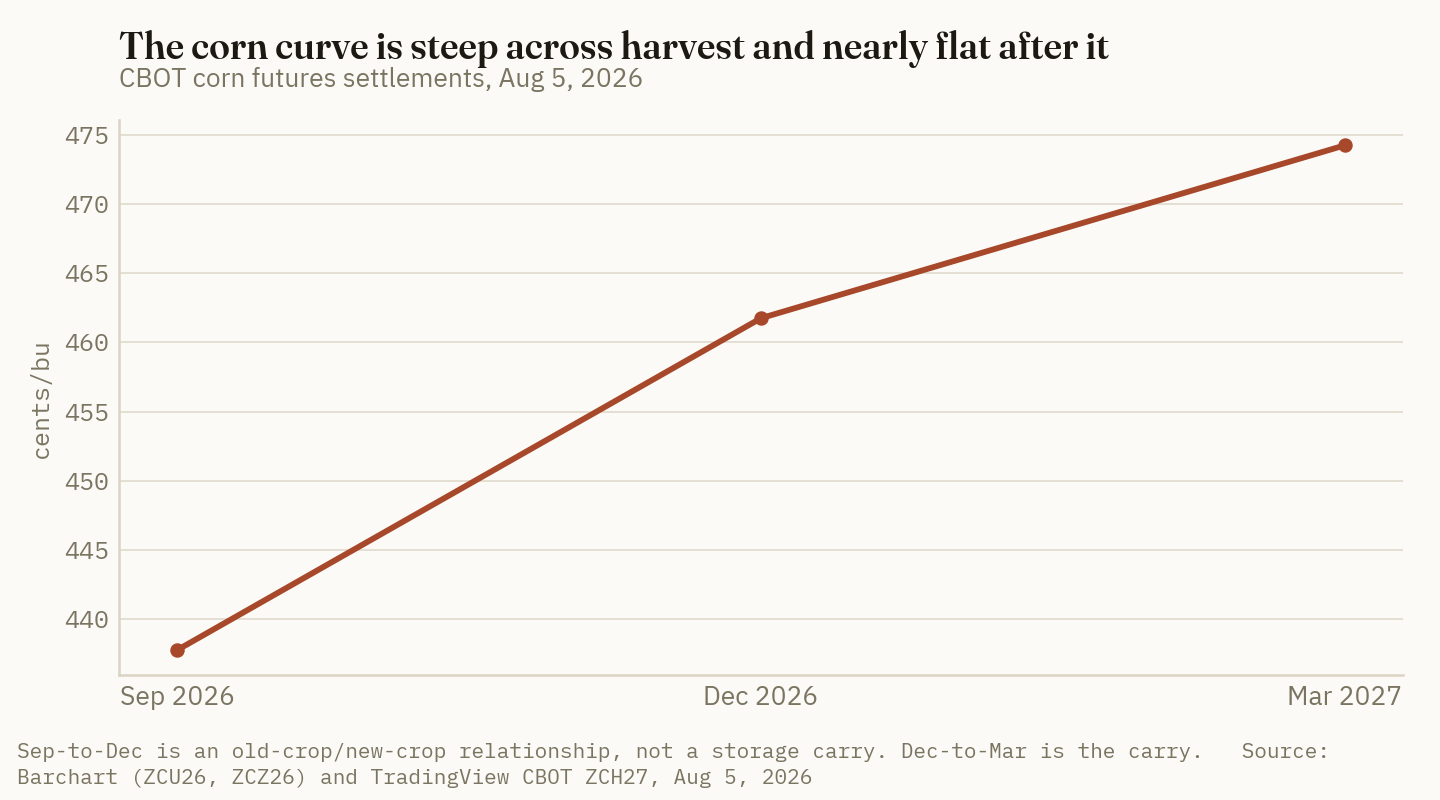
Two very different things are stacked in that table and they are routinely conflated.
The Sep-to-Dec 24 cents is not a carry. It spans the harvest, and it is an old-crop/new-crop relationship — a market pricing the disappearance of last year's tight supply against the arrival of a projected 16.16-billion-bushel harvest (Trading Economics, accessed Aug 5, 2026). Nobody stores corn from September into December to collect it. That spread is about which crop you own, not about how long you own it.
The Dec-to-Mar 12.5 cents is a carry, and it is the only number on this curve that is actually offering to pay for time. It is the market's posted price for taking corn off its hands at harvest and giving it back in March.
For context on where the level sits: front-month corn traded at 437.28 cents on August 5, down 1.12% on the day and 0.79% on the month, but up 15.15% year-over-year (Trading Economics, Aug 5, 2026). The market made a nine-week high on July 24 on European and Chinese crop concerns, then gave it back in early August as Midwest weather forecasts improved (Trading Economics, accessed Aug 5, 2026). A flat carry against a firm year-over-year price is a specific combination, and Section 4 takes it up.
2. What storage actually costs
Storage cost has two components, and only one of them is a bill anybody sends you.
Physical storage is the charge to keep the crop in usable condition — a commercial elevator's posted rate, or on a farm the drying energy, aeration power, handling, shrink, insurance and the ownership cost of the structure.
Interest opportunity cost is the return foregone by holding grain instead of cash. farmdoc calculates it as the October cash price multiplied by the average one-year US Treasury bill rate (farmdoc daily, Oct 2, 2025). It is invisible, it is real, and since 2020 it has been the component that grew fastest.
Running the current curve against both:
| Line | ¢/bu, Dec→Mar | Basis |
|---|---|---|
| Carry the board is paying | 12.50 | ZCZ26 → ZCH27, Aug 5, 2026 |
| Less: interest at 4.0% on $4.6175 for 3 months | −4.62 | Calculated; rate is an assumption |
| Left to cover physical storage | 7.88 | ≈ 2.63¢/bu/month |
| Commercial storage, harvest→January | ~30.00 | ≈ 10¢/bu/month over three months |
| Commercial shortfall | −22¢ or worse |
Crop Root Zone calculation. Futures per Barchart / TradingView, Aug 5, 2026; commercial storage cost per Peoples Company, accessed Aug 5, 2026. The 4.0% cost of capital is an assumption, not a sourced rate, and a producer's actual operating-note rate should be substituted. The commercial figure is an all-in harvest-to-January charge including handling; a per-month rate derived from it is approximate.
2.63¢/bu/month
What is left of the December-to-March corn carry after interest — the entire budget the board is offering for physical storage. (Crop Root Zone calculation on Barchart / TradingView quotes, Aug 5, 2026)
Against that budget, commercial storage does not clear and is not close. On-farm is a different question, and the answer depends entirely on whether the bin is paid for. The commonly quoted on-farm range of 25 to 50 cents a bushel is a full-cost number that amortizes the structure (Peoples Company, accessed Aug 5, 2026). The relevant comparison for a bin already standing and already paid for is variable cost only — aeration power, some handling, and shrink already taken at harvest — which lands well inside 2.63 cents a month for most operations.
And shrink is worth pricing separately rather than waving at, because it is the one storage cost producers systematically create for themselves. Shrink runs roughly 1.15% per point of moisture below 15%; drying to 13% therefore leaves about 2.3% fewer bushels to sell (Iowa State Ag Decision Maker / extension guidance, accessed Aug 5, 2026). At $4.6175 corn, 2.3% is 10.6 cents a bushel — nearly the entire Dec-to-March carry, given away at the dryer before the storage decision is ever made.
Ground Truth: Over-drying is the most expensive storage decision most operations make, and it is made in October by someone watching a moisture meter, not in a marketing meeting. Two points of unnecessary drying costs 10.6 cents a bushel in shrink at current prices — 85% of what the entire December-to-March carry pays. A producer who dries to 13% "to be safe" and then congratulates himself on capturing a 12.5-cent carry has netted about two cents, minus the propane. Set the dryer to the storage period, not to the worst case.
3. Fifty-one years say the cash return survives and the hedged one is fading
This is where the current curve stops being an anomaly and starts being a trend.
farmdoc examined October-through-May storage returns across the 1974–2024 marketing years and found no evidence that net return to cash storage of US corn and soybeans has declined — time trends were positive but negligible, on the order of 0.0–0.1% a year for corn (farmdoc daily, Dec 2025). Storing corn and selling it later in the cash market has worked about as well recently as it did fifty years ago.
Futures-hedged storage is a different story. The same work found negative time trends of −0.1% to −0.2% a year across all six corn storage periods, with statistical confidence above 95% in every period and above 99% for October-to-January and October-to-February (farmdoc daily, Dec 2025). The author stops short of calling it definitive, but the direction is consistent across every window tested.
The offered explanation is structural rather than cyclical: off-farm storage capacity has grown from 42% to 47% of total US storage capacity since the late 1990s (farmdoc daily, Dec 2025). More commercial capacity competing to hold grain bids down the carry the board has to offer to attract it. That is precisely the mechanism that produces a 4.17-cent monthly carry against a 10-cent monthly commercial cost.
| Storage approach | 51-year trend in net return | Confidence |
|---|---|---|
| Cash storage, corn | +0.0 to +0.1%/yr — no decline | — |
| Cash storage, soybeans | +0.1 to +0.2%/yr — no decline | — |
| Futures-hedged storage, corn | −0.1 to −0.2%/yr | >95% all six periods; >99% Oct–Jan, Oct–Feb |
Source: farmdoc daily, "Has US Return to Storing Corn and Soybeans Declined over Time?", Dec 2025.
Ground Truth: The carry and the basis are two different paychecks, and only one of them is shrinking. Fifty-one years of data say the return to cash storage — which is to say, the return to basis appreciation — has held up, while the return to locking a hedged carry has trended down for structural reasons that are not reversing. The 12.5-cent Dec-to-March spread is not a bad year for carry; it is what carry now looks like. The practical consequence is that storing corn in 2026 is a bet on your local basis improving, not on the board paying you. Producers who evaluate storage by looking at the spread are grading the wrong exam.
4. The share-of-price problem
One more number reframes all of this. farmdoc's long series measures total storage cost as a ratio to the October harvest price. For corn it has averaged 20% since 1973, ranging from 6% in 2012 to 37% in 2024 (farmdoc daily, Oct 2, 2025).
| Corn storage cost as % of harvest price | ||
|---|---|---|
| 2024 — the record | 37% | ██████████ |
| 1973–2024 average | 20% | █████ |
| 2012 — the low | 6% | ██ |
Source: farmdoc daily, Oct 2, 2025.
The 2024 record is not primarily about elevators raising rates. It is the two components moving together: physical storage cost rose, and interest opportunity cost rose off a near-zero base as rates normalized after the 2009–2021 period (farmdoc daily, Oct 2, 2025). A ratio near 37% means that in a bad configuration, storing a bushel of corn for a marketing year can consume more than a third of what the bushel was worth at harvest.
That ratio is the reason the current setup deserves care rather than habit. Corn is up 15.15% year-over-year (Trading Economics, Aug 5, 2026), which raises the interest cost of storage in dollar terms even at an unchanged rate — a higher-priced bushel ties up more capital. Meanwhile the carry being offered to compensate for that is 4.17 cents a month. Higher storage cost, flatter carry: the two moved the wrong way relative to each other.
5. The decision, in the order it should be made
First, set the dryer. The shrink arithmetic is worth more than the storage arithmetic. Ten and a half cents a bushel at 13% moisture versus 15% is larger than most of what follows.
Second, ask whether the bin is paid for. If it is, the 12.5-cent carry plausibly covers variable cost and the position is a basis bet — which the 51-year record supports. If storage means a commercial ticket at roughly 30 cents to January, the board is currently paying about 42% of that, and the position needs basis to do all the work plus make up the deficit.
Third, price the basis, not the spread. The number that decides this is the local harvest basis against the expected January or March basis at the same elevator. That is farm-specific, it is knowable in advance from the elevator's own history, and it is where the return has actually lived for five decades.
Fourth, do not hedge the carry and call it a storage plan. The one storage strategy the data says has been degrading is the one that locks the futures spread. If the carry is the whole thesis, the carry is 4.17 cents a month before interest — and after interest, 2.63.
References
- Barchart, corn futures quotes ZCZ26 and ZCU26, accessed Aug 5, 2026 — https://www.barchart.com/stocks/quotes/ZCZ26
- TradingView, CBOT corn futures contract ZCH27 (Mar 2027), accessed Aug 5, 2026 — https://in.tradingview.com/symbols/CBOT-ZC1%21/contracts
- Trading Economics, Corn commodity price series, accessed Aug 5, 2026 — https://tradingeconomics.com/commodity/corn
- farmdoc daily, University of Illinois, "Annual Cost of Storing US Corn and Soybeans Since 1973," Oct 2, 2025 — https://farmdocdaily.illinois.edu/2025/10/annual-cost-of-storing-us-corn-and-soybeans-since-1973.html
- farmdoc daily, University of Illinois, "Has US Return to Storing Corn and Soybeans Declined over Time?", Dec 2025 — https://farmdocdaily.illinois.edu/2025/12/has-us-return-to-storing-corn-and-soybeans-declined-over-time.html
- Peoples Company, "Successful Strategies: The True Cost of Storing Grain," accessed Aug 5, 2026 — https://peoplescompany.com/blog/successful-strategies-the-true-cost-of-storing-grain
- Iowa State University Extension, Ag Decision Maker A2-33, "Cost of Storing Grain," accessed Aug 5, 2026 — https://www.extension.iastate.edu/AgDM/crops/html/a2-33.html
Disclosures
Crop Root Zone is an independent publication. Nothing here is investment advice. Market calls, where included, reflect the editors' own read and are not a recommendation to buy or sell any security.
Cotton Crossed Break-Even on the Screen. USDA Still Says the Farm Price Is 73 Cents.
Futures at 82 cents sit inside the 78-83 cent break-even band for the first time in four years, but the July WASDE season-average forecast is nine cents lower and stocks-to-use just went to 29.5% — making this a selling opportunity rather than a margin.
Cotton futures settled at 82.16 cents per pound on August 3, up 4.9% on the month and 27.5% on the year (Trading Economics cotton series, accessed Aug 3, 2026). Published break-even estimates for the 2026 crop run 78 to 83 cents (Pro Farmer/AgWeb, 2026). For the first time in four consecutive losing seasons, the screen is inside the band. Then read USDA's July World Agricultural Supply and Demand Estimates, which raised 2026/27 US production 400,000 bales to 13.7 million, lifted ending stocks to 4.1 million bales, pushed the stocks-to-use ratio to 29.5% — and left the projected season-average farm price unchanged at 73 cents (USDA WASDE, July 2026). The board and the government are nine cents apart on the same crop. On an 872-pound-per-acre yield, nine cents is $78 an acre, which is most of a cotton fertility bill. Which number a grower ends up living with is not determined by the weather between now and October. It is determined by whether they sell into this.
1. The three numbers that disagree
What's new: Cotton is simultaneously above break-even, below break-even, and at break-even, depending on which price series you use — and all three series are legitimate.
Evidence:
| Price reference | ¢/lb | Revenue at 872 lb/acre | vs 80¢ break-even |
|---|---|---|---|
| USDA 2026/27 season-average forecast | 73.00 | $636.56 | −$61.04 |
| Break-even, low end | 78.00 | $680.16 | −$17.44 |
| Break-even, midpoint | 80.00 | $697.60 | — |
| Futures, Aug 3, 2026 | 82.16 | $716.44 | +$18.84 |
| Break-even, high end | 83.00 | $723.76 | +$26.16 |
Source: season-average price and 872 lb/harvested-acre yield from USDA WASDE, July 2026; break-even range from Pro Farmer/AgWeb cotton coverage, 2026; futures from Trading Economics cotton series, accessed Aug 3, 2026. Revenue-per-acre and variance columns are Crop Root Zone's own arithmetic at the WASDE national average yield — lint revenue only, excluding seed and any program payments.
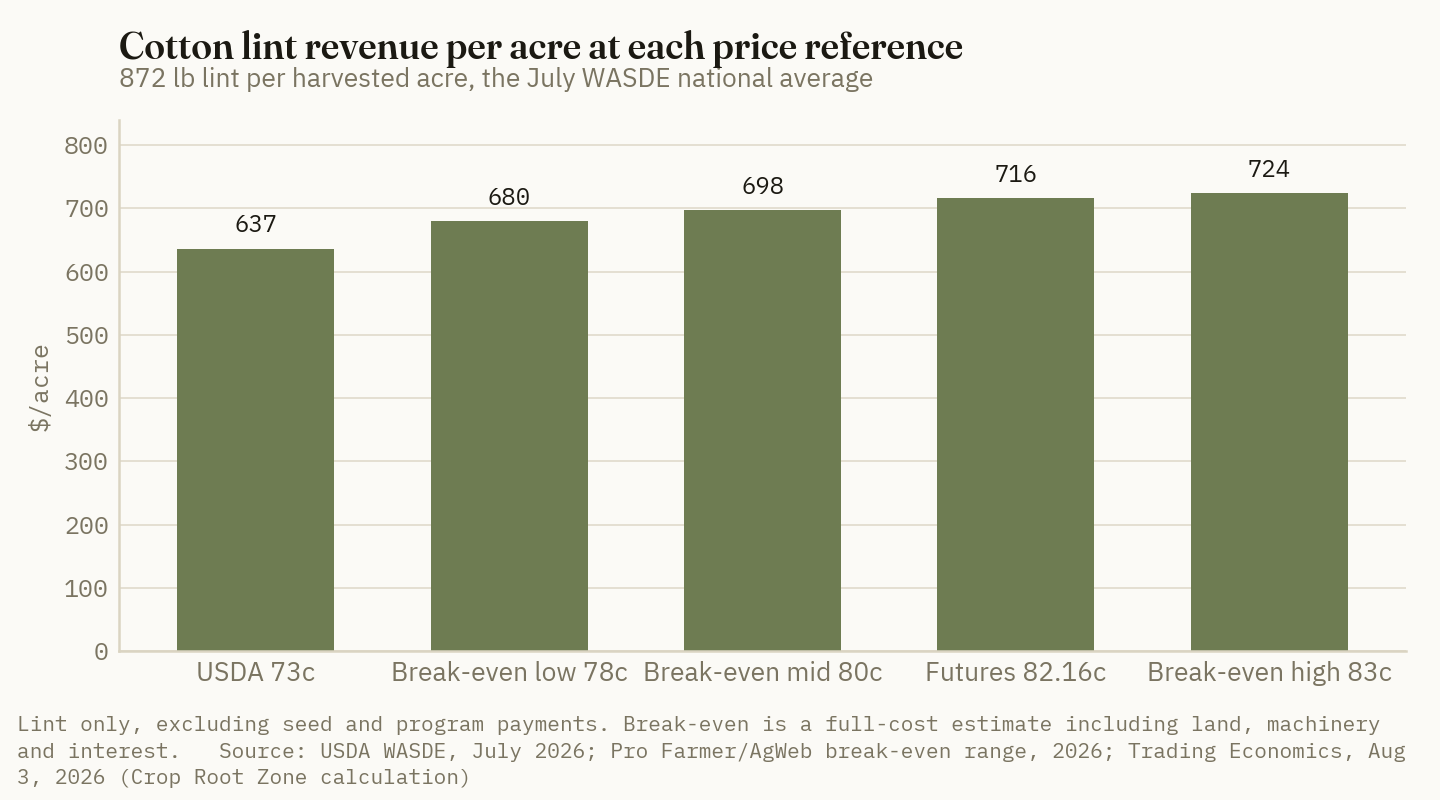
The three numbers measure different things and it is worth being exact about how.
Futures is what someone will pay today for December delivery of a specific quality at a specific warehouse. A grower cannot sell there — basis, quality discounts, and gin and warehouse charges all come out first.
Break-even is a total-cost estimate including land, machinery, labor and interest. It is a full-cost number, which is why it is high; a grower who owns land and equipment outright has a materially lower cash break-even, and one financing operating capital at current rates has a higher one.
The season-average price is the whole marketing year's sales, weighted by volume, as USDA expects them to land. It embeds basis. It embeds the fact that a large share of the crop is sold at harvest, when the board is typically at its weakest. And it embeds USDA's view that a 29.5% stocks-to-use ratio does not sustain 82-cent cotton.
9 cents = $78/acre
The gap between August's futures price and USDA's season-average forecast, converted at the WASDE national yield. That is roughly two-thirds of a typical cotton NPK program. (Crop Root Zone calculation from USDA WASDE, July 2026 and Trading Economics, Aug 3, 2026)
Ground Truth: Four losing years have trained cotton growers to watch the futures screen for permission to feel better. That is the wrong instrument. The season-average forecast is USDA's estimate of what the average unpriced grower will receive, and history says the average unpriced grower receives something close to it. The 82-cent print is not a condition a grower is in — it is an offer a grower can accept. Nine cents for an afternoon of paperwork is a better return than anything else available in the cotton complex this year.
2. The balance sheet is going the wrong way
What's new: The rally is happening against a US balance sheet that loosened, not tightened, in the most recent report.
Evidence: July 2026 WASDE, 2026/27 US all-cotton:
| Item | Level | Change from June |
|---|---|---|
| Planted area | 9.85 million acres | +2% |
| Harvested area | 7.54 million acres | +2% |
| Yield | 872 lb/harvested acre | +6 lb |
| Production | 13.7 million bales | +400,000 |
| Ending stocks | 4.1 million bales | +400,000 |
| Stocks-to-use | 29.5% | higher |
| Season-average price | 73 ¢/lb | unchanged |
Source: USDA World Agricultural Supply and Demand Estimates, July 2026.
Every line in that table except the price moved in the bearish direction, and the entire production increase went straight to carryout because demand was left unchanged. A 29.5% stocks-to-use ratio is not a tight market by any historical standard.
It is also worth noting how the acreage arrived. The National Cotton Council's planting-intentions survey projected 9.0 million acres, down 3.2% from 2025, including a nearly 21% collapse in the Mid-South. Actual planted area came in at 9.85 million — roughly 850,000 acres, or 9%, above the survey (National Cotton Council survey, 2026; USDA June Acreage as carried in the July WASDE).
Ground Truth: The gap between the intentions survey and the actual plant is the most important number in this article that nobody is discussing. Growers told the Council over the winter that cotton did not pencil, and then planted 9% more of it than they said they would. That is not optimism — it is what happens when the alternatives price worse and the rotation, the equipment and the gin relationship are already sunk. Acreage that shows up despite the economics is acreage that will show up again, which is precisely why a 29.5% carryout is hard to work off and why USDA is comfortable at 73 cents.
3. The crop got better while the price went up
What's new: Condition ratings improved sharply through the second half of July — the opposite of what usually accompanies a 5% monthly price rally.
Evidence: USDA's Crop Progress condition ratings for cotton across the 15 principal states:
| Week ending | Very poor | Poor | Fair | Good | Excellent | Good + excellent |
|---|---|---|---|---|---|---|
| Jul 12, 2026 | — | — | — | — | — | 44% |
| Jul 26, 2026 | 3% | 7% | 31% | 48% | 11% | 59% |
Source: USDA NASS Crop Progress, weeks ending Jul 12 and Jul 26, 2026. The July 12 category breakdown was not carried in the summary consulted; only the good-to-excellent aggregate is cited for that week.
A fifteen-point improvement in good-to-excellent in two weeks is a large move, and it is consistent with the WASDE yield increase. So the domestic crop improved and the domestic carryout grew while the price rallied 5%. The rally is therefore not domestic.
Its drivers are external, and they do not all point the same way:
| Driver | Detail | Direction |
|---|---|---|
| India sown area | Down 4% year over year despite monsoon recovery | Bullish |
| Brazil planted area | Planned 4% reduction | Bullish |
| Brazil exports | Record 2024/25 exports into Asian markets | Bearish |
| Crude oil | Lower oil cheapens polyester, cotton's substitute | Bearish |
| US crop | Condition 59% G/E; production +400,000 bales | Bearish |
Source: Trading Economics cotton market commentary, accessed Aug 3, 2026; USDA WASDE, July 2026; USDA NASS Crop Progress, Jul 26, 2026.
Ground Truth: A price supported entirely by two foreign acreage estimates and undercut by its own domestic balance sheet is a price with a short memory. India's sown area is a moving number that recovers with rain, and Brazil's planned reduction is an intention — cotton intentions having just been demonstrated, in the United States, to be wrong by 850,000 acres. This is the textbook definition of a rally to be sold rather than admired.
4. What it does to the fertility decision
What's new: Nine cents of price is worth more per acre than the entire nitrogen line of a cotton program, which means the marketing decision dominates the agronomic one by a wide margin this year.
Evidence: A costing of a moderate cotton fertility program at current retail nutrient prices. The rates below are a stated illustration for a crop in the 850-950 lb lint range, not a recommendation for any specific field:
| Nutrient | Rate | Source product | $/lb nutrient | $/acre |
|---|---|---|---|---|
| Nitrogen | 80 lb N | Urea, 46-0-0 | 0.742 | $59.36 |
| Phosphate | 40 lb P₂O₅ | DAP, 18-46-0 | 0.702* | $28.08 |
| Potash | 80 lb K₂O | MOP, 0-0-60 | 0.412 | $32.96 |
| Total NPK | $120.40 |
Source: retail nutrient prices from DTN/Progressive Farmer, Jul 29, 2026 (week of Jul 20-24). Rates are Crop Root Zone's stated illustration. *The DAP figure is a Crop Root Zone derivation: DAP at $913/short ton, credited for its 360 lb of contained N at urea's $0.742/lb, with the residual assigned to 920 lb of P₂O₅. It is an implied phosphate cost, not a quoted one.
Now scale it against the price gap:
| Item | $/acre | Share of NPK bill | |
|---|---|---|---|
| Nine cents of price (82.16¢ vs 73¢) | 78.28 | ███████ |
65% |
| Total NPK program | 120.40 | ██████████ |
100% |
| — Nitrogen line | 59.36 | █████ |
49% |
| — Potash line | 32.96 | ███ |
27% |
| — Phosphate line | 28.08 | ██ |
23% |
Source: Crop Root Zone calculation from the two tables above. Bars scaled to the NPK total.
The nine cents is larger than the nitrogen line, larger than the potash and phosphate lines combined, and worth about two-thirds of the whole fertility program. There is no plausible agronomic economy — no rate cut, no product substitution, no skipped micronutrient — that recovers as much money as capturing the current board does.
Ground Truth: In a normal year the input decision and the marketing decision are roughly comparable in size, and both deserve attention. In cotton in 2026 they are not comparable. A grower who spends August optimizing a fertility program while leaving the crop unpriced has allocated effort exactly backwards. Price the crop first, at the level currently available, then have the fertility conversation with a known revenue number in hand — which is, not incidentally, the only version of that conversation a lender will find persuasive.
5. The 2027 acre, and why the survey will miss again
What's new: The 2027 acreage decision is already being framed, and the same forces that produced a 9% miss this year are still in place.
Evidence: The structural facts a Mid-South or Southeast grower carries into the 2027 decision:
- Four consecutive seasons of unfavorable market returns (National Cotton Council economic outlook, 2026).
- Operating loan rates in the 7-8% range, which raises the full-cost break-even directly and constrains prepay and input timing (Pro Farmer/AgWeb, 2026).
- A 29.5% stocks-to-use ratio and a 73-cent USDA price forecast — neither of which invites expansion.
- Against all that: cotton-specific sunk capital. A picker, a module builder and a gin relationship do not convert to a grain enterprise, and the residual value of that equipment is realized only by continuing to grow cotton.
That last item is the one the intentions surveys keep failing to capture, and it is why 9.0 million intended acres became 9.85 million planted acres. Sunk cotton-specific capital is not a reason cotton is profitable. It is a reason cotton gets planted anyway.
| 2026 acreage | Million acres | Δ vs survey |
|---|---|---|
| NCC intentions survey | 9.00 | — |
| Actual planted (June Acreage, via July WASDE) | 9.85 | +0.85 (+9%) |
| Harvested | 7.54 | — |
| Implied abandonment | 2.31 | 23% of planted |
Source: National Cotton Council planting intentions survey, 2026; USDA WASDE, July 2026. The abandonment line is Crop Root Zone's arithmetic from the planted and harvested figures.
That 23% abandonment figure deserves a note of its own. It is high by Corn Belt standards and unremarkable by cotton standards — much of the Southwest plants cotton knowing a meaningful share will not be harvested. It also means the fertility dollars applied to those 2.31 million acres are a real, and rarely counted, industry-level cost. At the $120.40 NPK program above, the nutrients placed on acreage that never reaches a gin come to roughly $278 million nationally. That figure is an illustration built on a national-average program, not a survey of what was actually applied, and dryland acres at genuine abandonment risk are typically fertilized more conservatively than the average — but even at half the rate it is a nine-figure line item that appears in no balance sheet.
Ground Truth: The honest read on 2027 cotton is that it will be planted for reasons that have nothing to do with the price and everything to do with what the grower already owns. That puts the acreage floor above what the economics justify, which makes the carryout stickier, which makes USDA's 73 cents more defensible than an 82-cent screen suggests. The decision that follows is uncomfortable but simple: treat any print above 80 cents as a gift rather than a trend, and size fall input commitments to the 73-cent world rather than the 82-cent one.
References
- Trading Economics, cotton price series and market commentary, accessed Aug 3, 2026. https://tradingeconomics.com/commodity/cotton
- USDA Office of the Chief Economist, World Agricultural Supply and Demand Estimates, July 2026 (2026/27 US cotton planted and harvested area, yield, production, ending stocks, stocks-to-use, season-average price). https://www.usda.gov/oce/commodity/wasde/wasde0726.pdf
- USDA NASS, Crop Progress, week ending Jul 26, 2026 (cotton condition ratings). https://esmis.nal.usda.gov/sites/default/release-files/795995/prog3026.pdf
- USDA NASS, Crop Progress, week ending Jul 12, 2026 (cotton condition ratings). https://esmis.nal.usda.gov/sites/default/release-files/795983/prog2926.pdf
- Pro Farmer / AgWeb, "Cotton Prices Rally, But Reality is Growers Are Still Chasing Break-Even for 2026," 2026 (78-83¢ break-even range; operating loan rates). https://www.profarmer.com/news/agriculture-news/cotton-prices-rally-reality-growers-are-still-chasing-break-even-2026
- National Cotton Council, "World Economic Outlook for 2026: Economic Pressures Remain but Declining Stocks Could Provide Price Support," 2026 (planting intentions survey; fourth year of unfavorable returns). https://www.cotton.org/news/releases/2026/world-economic-outlook-26.cfm
- DTN/Progressive Farmer, "Fertilizer Prices Keep Sliding as UAN32 Leads 4 Nutrients in Significant Drops," Jul 29, 2026 (retail nutrient prices used in the fertility costing). https://www.dtnpf.com/agriculture/web/ag/crops/article/2026/07/29/fertilizer-prices-keep-sliding-uan32
Disclosures
Crop Root Zone is an independent publication. Nothing here is investment advice. Market calls, where included, reflect the editors' own read and are not a recommendation to buy or sell any security.
The Machinery Market Split by Horsepower Class, and Only One Half Is Discounting
AGCO cut its 2026 outlook on weakness in Western Europe, Brazil and North American small ag — while North American sales rose about 20% and it took share in high-horsepower tractors. That divergence tells you where the fall equipment deals are, and where they aren't.
A guidance cut and a 20% regional sales increase do not usually appear in the same earnings release. AGCO Corporation's second-quarter 2026 report contained both. The company reported adjusted earnings of $1.43 a share against a $1.45 consensus on revenue of $2.61 billion, below forecasts near $2.75 billion, and reduced its full-year outlook to sales of $10.1–10.2 billion and adjusted earnings of $5.50–5.75 a share — attributing the reduction to weaker demand in Western Europe, Brazil and North American small ag. In the same release, North American sales rose about 20% on a constant-currency basis, with market share gains in high-horsepower tractors and hay tools. For a grower deciding whether this is the autumn to replace a toolbar, an applicator or a tractor, that split is more useful than either headline on its own.
1. What was cut, and what was not
What's new: The reduction is a demand call on specific geographies and one specific domestic segment — not a broad statement that farm equipment is in retreat.
Evidence:
| AGCO 2026 outlook | Figure |
|---|---|
| Full-year net sales | $10.1bn – $10.2bn (reduced) |
| Full-year adjusted EPS | $5.50 – $5.75 (reduced) |
| Q3 2026 sales guidance | $2.3bn – $2.4bn |
| Q3 2026 EPS guidance | $0.85 – $0.90 |
| Q2 2026 adjusted EPS | $1.43 (vs ~$1.45 consensus) |
| Q2 2026 revenue | $2.61bn (vs ~$2.75bn consensus) |
Source: AGCO Corporation, Q2 2026 results and earnings call, late July 2026.
Set the third-quarter guide against the full year. A midpoint of roughly $2.35 billion in the third quarter against a full-year midpoint near $10.15 billion implies the back half is being modelled well below the first-half run rate. The company is not guiding to a recovery inside the calendar year; it is guiding to the weakness persisting through it.
| Region / segment | Direction |
|---|---|
| North America, overall | Up ~20% (constant currency) |
| North America, high-horsepower tractors | Share gains |
| Hay tools | Share gains |
| North America, small ag | Weak |
| Western Europe | Weak |
| Brazil | Weak |
Source: AGCO Corporation, Q2 2026 results and earnings call, late July 2026.
Ground Truth: The useful signal is not the guidance cut — it is that the weakness and the strength are inside the same company's North American book. Small ag soft while high-horsepower gains share is a demand pattern that tracks farm size and enterprise type, not the farm economy as a whole. Row-crop operations large enough to run high-horsepower iron are still buying. That is the segment paying $960 anhydrous and still expanding application capacity, and it is not the segment that is going to be offered a deal this fall.
2. Where a discount is actually available
What's new: Discounting follows inventory, and inventory is accumulating unevenly.
Evidence: The classes showing share gains and 20% growth are the classes where a dealer has the least reason to negotiate. The classes named in the guidance cut are where the order book is thin and the lot is full. As a practical map for a fall purchase:
| Equipment class | Demand signal | Expect |
|---|---|---|
| High-horsepower tractors | Share gains, NA +20% | Firm pricing, longer lead times |
| Hay tools | Share gains | Firm pricing |
| Small ag / compact and utility | Named in the guidance cut | Discount and floor stock |
| Application equipment (self-propelled, toolbars) | Follows row-crop capex | Firm; tied to the strong half |
Source: Crop Root Zone assessment based on AGCO Corporation Q2 2026 disclosures, late July 2026. Class-level pricing behaviour is inferred from the disclosed demand pattern, not company guidance.
That inference is exactly that — an inference, and it is the sort of claim worth testing against your own dealer rather than accepting. But the direction is not ambiguous. A manufacturer taking share in high-horsepower does not discount high-horsepower.
3. Why the application side sits on the strong half of the split
What's new: Fertilizer economics are currently pushing work toward exactly the equipment classes that are not discounting.
Evidence: Anhydrous ammonia remains the cheapest nitrogen in the shed at $0.59 per pound of N, against $0.72 for UAN32, $0.75 for urea and $0.83 for UAN28 (DTN/Progressive Farmer, week ending Jul 31, 2026). Anhydrous is also the most equipment-intensive nitrogen to apply: it needs a toolbar, a tractor with enough horsepower to pull it through the fall, nurse tanks and a trained operator.
| Nitrogen source | $/lb N | Application intensity | |
|---|---|---|---|
| UAN28 | 0.83 | ██████████ |
Low — sprayer or coulter |
| Urea | 0.75 | █████████ |
Low — dry spreader |
| UAN32 | 0.72 | █████████ |
Low — sprayer or coulter |
| Anhydrous | 0.59 | ███████ |
High — toolbar, high-HP tractor, nurse tanks |
Source: DTN/Progressive Farmer retail survey, week ending Jul 31, 2026, published Aug 5, 2026. Application intensity is Crop Root Zone's classification.
The cheapest nitrogen per pound is the one that requires the equipment class currently holding its price. That is not a coincidence — it is the same underlying demand showing up in two different markets. A fall anhydrous program that pencils on nutrient cost has to be checked again on the iron and the labour hours it takes to put down, because that side of the ledger is in the half of the machinery market with pricing power.
$0.59/lb N
Anhydrous ammonia's delivered retail cost per pound of nitrogen — 21% below UAN32 and 29% below UAN28, and the only nitrogen source that requires high-horsepower equipment to place. (DTN/Progressive Farmer, week ending Jul 31, 2026)
4. What a fall capex decision should actually turn on
What's new: The split changes the order of the questions, not the arithmetic.
Evidence: Three tests, applied in sequence:
- Is the machine on the strong side or the weak side of the split? If it is compact, utility or small ag, this is a buyer's autumn — inventory exists and the guidance cut says the manufacturer knows it. If it is high-horsepower or application equipment, negotiate on lead time and specification rather than expecting price.
- Does the purchase change acres covered per day, or only cost per acre? Application equipment bought in a tight nitrogen year is usually justified on window — the number of suitable fall days you can actually use — rather than on custom-rate arbitrage. A machine that adds days is worth more this year than one that shaves dollars.
- What does the weak half do to your trade? Small-ag softness is where used values are most exposed. An operation trading a utility tractor into a high-horsepower purchase is selling into the weak market and buying into the strong one — the worst configuration of the two, and worth quantifying before the deal is structured rather than after.
Ground Truth: The guidance cut is not permission to wait for a better price on the equipment most row-crop operations actually need. It is a signal that the market has divided, and that the half a large row-crop grower shops in is the half that is holding. If a fall anhydrous program depends on adding application capacity, the deal to negotiate is availability and delivery date — because the equipment that puts down the cheapest nitrogen is being bought by everyone else for the same reason.
5. The booking calendar is where the split gets priced
What's new: Equipment pricing in North America is not set continuously. It is set in early-order and winter booking programs, and the split described above will be expressed through those programs long before it shows up in a retail negotiation.
Evidence: The mechanics matter because they determine when a buyer's leverage exists at all. An early-order program prices a machine months ahead of delivery in exchange for a volume commitment from the buyer and production visibility for the manufacturer. In a class where the order book is full, those programs are thin on incentive and the real currency is a delivery slot. In a class where inventory is accumulating, the same programs carry discount, extended terms or both.
| Booking dynamic | Strong classes (high-HP, hay, application) | Weak classes (small ag, compact/utility) |
|---|---|---|
| What the manufacturer needs | Production visibility | Volume — to clear inventory |
| What the buyer can negotiate | Delivery date, specification | Price and terms |
| Cost of waiting | Slot risk | Low — inventory persists |
| Right posture | Book early, negotiate the slot | Wait; let the program improve |
Source: Crop Root Zone assessment based on the demand pattern AGCO disclosed for Q2 2026, late July 2026. Program behaviour by class is inferred, not company guidance.
This is where the guidance cut becomes actionable rather than merely informative. A company that has reduced full-year sales guidance to $10.1–10.2 billion and guided the third quarter to $2.3–2.4 billion has told the market it expects a soft back half. Manufacturers facing a soft back half do one of two things in the booking period: they buy volume with incentive, or they hold price and accept lower units. The disclosed pattern says they are likely to do the first in small ag and the second in high-horsepower — because in high-horsepower they are taking share without needing to.
Ground Truth: The mistake available this autumn is applying a single negotiating posture across a mixed equipment list. An operation replacing both a utility tractor and a high-horsepower unit should run two different processes on two different calendars — wait out the weak class, book the strong one early and negotiate delivery rather than price. Treating both as "the equipment market is soft, so wait" costs a delivery slot on the machine that actually has to be in the field for fall application.
6. What to watch
- Whether small-ag weakness spreads up the horsepower ladder. It has not yet. If North American constant-currency growth decelerates from ~20% in the next quarter, the split is closing and the pricing conclusion above changes.
- Dealer floor plan and used inventory by class, which is a local observation and a better guide to your own negotiation than any national figure.
- Fall anhydrous application demand, which is the variable that determines whether application-equipment pricing stays on the strong side of the split through the winter order period.
References
- AGCO Corporation, Q2 2026 results and earnings call, late July 2026 — investor relations, https://investors.agcocorp.com/
- Investing.com, "Earnings call transcript: AGCO cuts 2026 outlook after Q2 revenue miss," July 2026 — https://www.investing.com/news/transcripts/earnings-call-transcript-agco-cuts-2026-outlook-after-q2-revenue-miss-93CH-4825457
- DTN/Progressive Farmer, "Fertilizer Prices Fall as UAN32 Leads Significant Drops Heading Into August," retail survey week ending Jul 31, 2026, published Aug 5, 2026 — https://www.dtnpf.com/agriculture/web/ag/crops/article/2026/08/05/fertilizer-prices-fall-uan32-leads
- farmdoc daily, University of Illinois, "The U.S. Farm Machinery & Equipment Market: Sales, Inventories, and Tariff Headwinds," Feb 2026 — https://farmdocdaily.illinois.edu/2026/02/the-u-s-farm-machinery-equipment-market-sales-inventories-and-tariff-headwinds.html
Disclosures
Crop Root Zone is an independent publication. Nothing here is investment advice. Market calls, where included, reflect the editors' own read and are not a recommendation to buy or sell any security.
A 1,000-Gallon Nurse Tank Covers 20 Acres. That Is the Real Price of Cheap Nitrogen.
Anhydrous is $0.16 a pound cheaper than urea, but it is only purchasable inside a soil-temperature window and only at the rate a retailer can turn tanks — and the binding constraint is tank turns, not toolbar hours.
Anhydrous ammonia is the cheapest nitrogen sold in the United States. DTN's August 5 retail survey puts it at $0.59 per pound of contained nitrogen against $0.75 for urea, $0.72 for UAN32 and $0.83 for UAN28 — a discount to urea worth $28.80 an acre on a 180 lb.N corn program. It is also the only nitrogen product whose purchase is gated by a thermometer. Fall ammonia should go on when soil temperature at four inches has fallen below 50 degrees F and is still falling, and in central Kansas that threshold is typically crossed around November 20. What sits between the price and the grower is not a market. It is a throughput problem with three constraints stacked in series, and the one that binds is not the one most operations plan around.
1. The window is a temperature, not a date
What's new: The agronomic rule is stable and well documented, and it is the reason the fall ammonia season cannot be lengthened by working harder.
Evidence: The threshold is soil temperature below 50 degrees F at a four-inch depth, with continued cooling forecast. Below that temperature, Nitrosomonas activity slows enough that ammonium stays ammonium through the winter instead of nitrifying to nitrate, which moves with water. Applied warm, the nitrogen converts quickly, and nitrate applied in November is nitrogen that may not be present in June.
The date that threshold arrives is a weather outcome, not a calendar entry. K-State reports that grass-covered soil at a two-inch depth in central Kansas typically reaches 50 degrees around November 20. The window then closes when the ground freezes hard enough to stop knife penetration — in practice a few weeks later, and in a warm autumn it does not open until the last possible moment.
| Constraint | What sets it | Grower control |
|---|---|---|
| Window opens | 4-inch soil temp below 50 °F and falling | None |
| Window closes | Ground freeze / knife penetration | None |
| Working days inside window | Rainfall, field conditions | Partial |
| Acres per working day | Equipment and supply logistics | Full |
Source: Iowa State University Integrated Crop Management and K-State Agronomy fall anhydrous guidance; Bayer Crop Science agronomy notes.
Ground Truth: Of the four rows in that table, a grower controls one. Which means the entire fall nitrogen plan reduces to a single question — how many acres can be covered per working day — and that number is set in August, when equipment and supply arrangements are made, not in November when the thermometer finally cooperates.
2. The toolbar is not the constraint
What's new: Applicator throughput is comfortably faster than most operations assume, which is why the bottleneck is somewhere else.
Evidence: Standard machinery arithmetic: acres per hour equals effective width in feet, times speed in miles per hour, times field efficiency, divided by 8.25. A 12-row toolbar on 30-inch spacing is 30 feet wide. At 5 mph with 80% field efficiency:
14.5 acres/hour
A 30-foot anhydrous toolbar at 5 mph and 80% field efficiency. At 12 working hours, that is 174 acres a day per rig. (Computed from standard machinery capacity arithmetic; width, speed and efficiency are stated assumptions.)
| Toolbar width | 4 mph | 5 mph | 6 mph |
|---|---|---|---|
| 30 ft (12-row) | 11.6 | 14.5 | 17.5 |
| 40 ft (16-row) | 15.5 | 19.4 | 23.3 |
| 60 ft (24-row) | 23.3 | 29.1 | 34.9 |
Acres per hour at 80% field efficiency. Computed from the standard capacity formula (width × speed × efficiency ÷ 8.25); speeds and efficiency are assumptions, not survey data.
At 174 acres a day, a single rig clears 4,350 acres across a 25-working-day window. Very few individual operations need more applicator hours than that. The equipment is not what runs out.
Ground Truth: Every conversation about fall ammonia capacity starts with the toolbar because the toolbar is the visible part. On the arithmetic it is the least binding of the three constraints. An operation that buys a wider bar to fix a fall nitrogen bottleneck has usually bought the wrong machine.
3. What actually runs out: nurse tank turns
What's new: Anhydrous is delivered in pressurized nurse tanks, and the number of acres a tank covers is small relative to how fast a toolbar empties it.
Evidence: Liquid anhydrous ammonia weighs approximately 5.15 pounds per gallon, and nurse tanks are filled to a maximum of about 85% of water capacity to allow for vapour expansion. A nominal 1,000-gallon nurse tank therefore holds roughly 850 gallons of product, or about 4,378 pounds of NH₃. At 82% nitrogen, that is roughly 3,590 pounds of contained N.
| Nurse tank (nominal) | Usable gal @ 85% | lb NH₃ | lb contained N | Acres @ 180 lb.N |
|---|---|---|---|---|
| 1,000 gal | 850 | 4,378 | 3,590 | 19.9 |
| 1,450 gal | 1,233 | 6,348 | 5,206 | 28.9 |
| 1,950 gal | 1,658 | 8,536 | 7,000 | 38.9 |
Computed from standard handling figures: NH₃ liquid density ≈ 5.15 lb/gal, 85% maximum fill, 82% N analysis, 180 lb.N/acre rate. Source: standard product handling data; arithmetic by Crop Root Zone.
Now stack the two numbers. A rig covering 174 acres a day at 180 lb.N is consuming about 8.7 one-thousand-gallon nurse tanks per day. Not per week. Per day. Each of those tanks has to be filled at a retail plant, hooked, hauled to the field, swapped, and hauled back — and during the two or three weeks when the window is open, every operation in the county is asking the same retailer for the same trucks.
| Constraint in series | Capacity per rig-day | Runs out? |
|---|---|---|
| Toolbar hours (30 ft @ 5 mph, 12 hr) | 174 acres | No |
| Nurse tank supply (1,000 gal units) | 8.7 tanks/day required | Yes — this one |
| Retail plant fill capacity | Shared across all customers | Yes, at peak |
Source: Crop Root Zone arithmetic from the assumptions stated above.
Extension guidance on ammonia handling describes exactly this at peak: retailer lots that normally hold rows of nurse tanks and applicators standing empty, because every working piece of anhydrous equipment in the trade area is in a field.
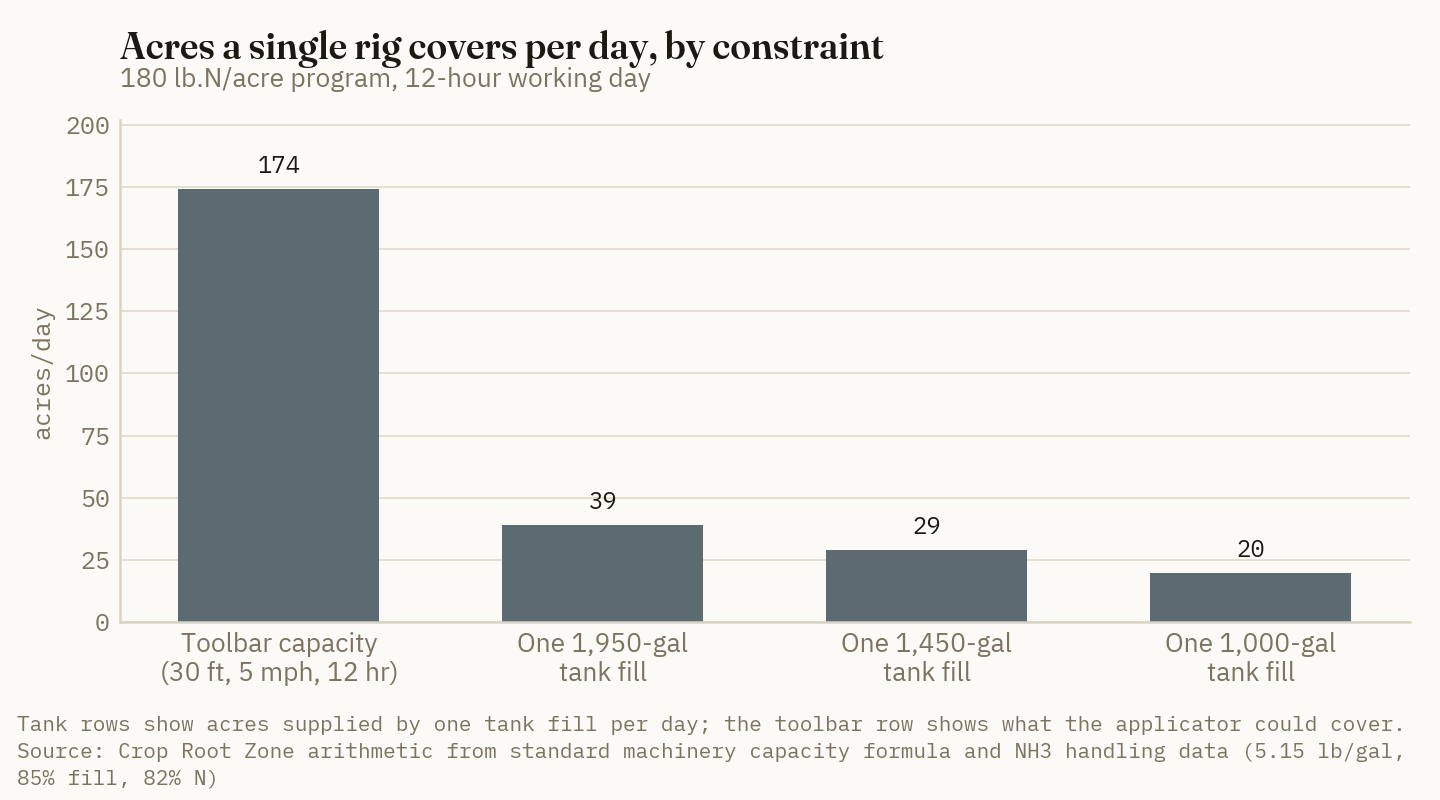
Ground Truth: The anhydrous discount is not a price discount. It is a delivery-rate discount — $0.16/lb.N is what the market pays a grower for absorbing the logistics of a pressurized product inside a three-week weather window. An operation that has secured tank turns captures it in full. An operation that has not is buying urea in December at $0.75 and calling it a market decision when it was an equipment-scheduling decision made in August.
4. Pricing the constraint
What's new: The discount is large enough per acre to justify paying for delivery capacity, which is a different purchase than paying for a machine.
Evidence: At the August 5 spread, going with anhydrous instead of urea on a 180 lb.N program saves $28.80/acre. Across the 4,350 acres a single rig can theoretically cover in a 25-day window, that is roughly $125,000 of nitrogen cost avoided per rig-season — provided the tanks show up.
| Acres on anhydrous | Saving vs. urea @ $0.16/lb.N | 1,000-gal tank fills required |
|---|---|---|
| 1,000 | $28,800 | 50 |
| 2,500 | $72,000 | 126 |
| 4,350 | $125,280 | 219 |
At 180 lb.N/acre and the Aug 5, 2026 DTN spread of $0.585 vs. $0.746 per lb.N. Source: DTN/Progressive Farmer, Aug 5, 2026; arithmetic by Crop Root Zone.
A note on what this piece cannot tell you: Iowa State's 2026 Farm Custom Rate Survey — 205 respondents and 4,698 reported rates, and the first year in which side-dressing anhydrous was surveyed as its own operation — is the right public benchmark for what custom application actually costs per acre in this market. The rate tables live in the full report rather than in the announcement, so this piece does not quote a figure for it rather than estimate one. Growers comparing custom application against owning the iron should pull the survey directly.
| What to secure now | Why | Lead time |
|---|---|---|
| Nurse tank allocation from your retailer | The binding constraint, not the toolbar | Book before fill programs post |
| A second fill point | Peak-week plant queues | Weeks |
| A stated priority position at peak | Everyone calls the same week | Weeks |
| Custom application quote (if not owning) | Compare against Iowa State survey rates | Before fall fill |
Source: Crop Root Zone analysis; Iowa State University Extension Ag Decision Maker, 2026 Farm Custom Rate Survey (survey scope as published).
Ground Truth: The cheapest nitrogen in the country is priced for people who can take delivery of it, and the delivery is rationed by a fleet of steel tanks that nobody has added to in years. Book tank turns before you book tons. The tons are available at a posted price; the turns are not, and in the third week of November the turns are what the $28.80 an acre actually costs.
Market read: No market call. Nurse-tank and applicator capacity sits with private retailers and co-ops rather than with any name on the approved list; forcing a ticker onto this would be reaching.
References
- DTN/Progressive Farmer, "Fertilizer Prices Fall as UAN32 Leads Significant Drops Heading Into August," Aug 5, 2026 — https://www.dtnpf.com/agriculture/web/ag/crops/article/2026/08/05/fertilizer-prices-fall-uan32-leads
- Iowa State University Extension, Integrated Crop Management, "Fall Anhydrous Ammonia Applications: What to know about soil moisture" — https://crops.extension.iastate.edu/post/fall-anhydrous-ammonia-applications-what-know-about-soil-moisture
- K-State Agronomy, "Fall Applications of Anhydrous Ammonia" — https://www.sunflower.k-state.edu/agronomy/soil_fertility/fall_anhydrous_ammonia.html
- Bayer Crop Science, "Fall and Spring Anhydrous Ammonia Applications" — https://www.cropscience.bayer.us/articles/bayer/fall-spring-anhydrous-ammonia-applications
- Purdue University Pesticide Programs, PPP-140/PPP-1401, Anhydrous Ammonia: Understanding, Avoiding and Mediating Inherent Risks — https://ag.purdue.edu/department/extension/ppp/resources/ppp-publications/mobile/ppp-1401.html
- Iowa State University Extension, Ag Decision Maker, 2026 Iowa Farm Custom Rate Survey (A3-10) — https://www.extension.iastate.edu/agdm/crops/pdf/a3-10.pdf
- Minnesota Department of Agriculture, "Anhydrous Safety Key Goal for Farmers This Fall" — https://www.mda.state.mn.us/anhydrous-safety-key-goal-farmers-fall
Disclosures
Crop Root Zone is an independent publication. Nothing here is investment advice. Market calls, where included, reflect the editors' own read and are not a recommendation to buy or sell any security.
The $5 Diesel Column Was the Stress Test. On August 4 It Became the Base Case.
EIA put on-highway diesel at $5.348 — up $1.55 in a year — which turns a well-irrigated rice acre into a $177 pumping bill and makes one conversion ratio, 12.5 kWh per gallon, the most valuable number in the pump house.
The US national average on-highway diesel price rose four cents to $5.348 a gallon in the Energy Information Administration's August 4 release — up $1.548 from a year ago, a 41% increase, with West Coast diesel at $6.130 and Gulf Coast at $5.141 (FleetOwner, Aug 5, 2026, citing EIA data of Aug 4, 2026). Two weeks earlier, Louisiana State University extension economists published an irrigation pumping cost analysis with three diesel scenarios: $1.50, $3.00 and $5.00 a gallon (Southern Ag Today, Jul 20, 2026). The $5.00 column was the high case. Net of the federal 24.3-cent on-highway excise that off-road farm diesel does not pay, it is now approximately the live price. Every number in the right-hand column of that table is a bill somebody is currently paying.
1. What the pump actually burns
The LSU work by Michael Deliberto and Stacia Davis-Conger models two configurations — a surface (relift) system and a well system — and publishes its engineering assumptions, which is what makes the results usable rather than merely quotable.
| Assumption | Surface system | Well system |
|---|---|---|
| Engine size | 100 hp | 120 hp |
| Flow rate | 2,500 GPM | 2,500 GPM |
| Diesel consumption | 6.78 gal/hr | 8.136 gal/hr |
| Electric consumption | 84.7 kW | 101.64 kW |
| Diesel per acre-foot | 14.73 gal | 17.67 gal |
| Electric per acre-foot | 183.99 kWh | 220.79 kWh |
Source: Southern Ag Today (Deliberto and Davis-Conger), Jul 20, 2026. The analysis covers surface and well systems; it does not separately model center pivot or other sprinkler configurations.
The well system costs about 20% more energy per acre-foot than the surface system for the obvious reason — it lifts water further. That penalty compounds with every inch applied, which is why the crop matters as much as the equipment.
Applied to the two application depths the authors price:
| System | Depth | $1.50/gal | $3.00/gal | $5.00/gal |
|---|---|---|---|---|
| Surface | Row crops, 10.5" | 19.33 | 38.67 | 64.44 |
| Well | Row crops, 10.5" | 23.20 | 46.39 | 77.32 |
| Surface | Rice, 24" | — | 88.38 | 147.30 |
| Well | Rice, 24" | — | 106.04 | 176.74 |
All $/acre. Source: Southern Ag Today, Jul 20, 2026.
$5.348/gal
National average on-highway diesel, Aug 4, 2026 — up $1.548 year over year, and above the top scenario in the extension budgets published two weeks earlier. (EIA via FleetOwner, Aug 5, 2026)
The rice numbers deserve to be read slowly. At the $5.00 column, a well-irrigated rice acre carries $176.74 of pumping energy — not equipment, not labor, not water, just the fuel to move it. On a thousand acres that is $176,740 of diesel, and it is a cost that scales with a hot dry summer rather than with the marketing plan.
2. The whole decision reduces to one ratio
Buried in the published assumptions is a constant that does more work than anything else in the analysis. Divide electric consumption per acre-foot by diesel consumption per acre-foot:
- Surface: 183.99 kWh ÷ 14.73 gal = 12.49 kWh per gallon
- Well: 220.79 kWh ÷ 17.67 gal = 12.50 kWh per gallon
The same number, both systems. In this model, a gallon of diesel does the pumping work of 12.5 kilowatt-hours. Which yields a rule a farm manager can carry in their head:
Breakeven electricity price ($/kWh) = diesel price ($/gal) ÷ 12.5
The authors state the same result at one point on the curve — at $5.00/gal diesel, the equivalent electric cost is $0.40/kWh, against commercial rates that generally run $0.15 to $0.20/kWh (Southern Ag Today, Jul 20, 2026). The ratio generalizes it:
| Diesel price | Breakeven power price | vs. $0.15/kWh | vs. $0.20/kWh |
|---|---|---|---|
| $1.50/gal | $0.120/kWh | diesel wins | diesel wins |
| $1.88/gal | $0.150/kWh | breakeven | diesel wins |
| $2.50/gal | $0.200/kWh | electric wins | breakeven |
| $3.00/gal | $0.240/kWh | electric wins | electric wins |
| $5.00/gal | $0.400/kWh | electric wins | electric wins |
| $5.348/gal | $0.428/kWh | electric wins | electric wins |
Crop Root Zone calculation from the published 12.5 kWh/gal equivalence in Southern Ag Today, Jul 20, 2026. Commercial rate range per the same source. Actual utility tariffs vary by service territory, and many agricultural rates carry demand charges not captured in a simple $/kWh comparison.
Ground Truth: The diesel-versus-electric argument has been fought for thirty years as if it were close. At $1.88 a gallon it was close. At $5.348 it is not an argument — the crossover sits at $0.428/kWh and commercial power is a third of that. What has actually changed is not the technology or the tariff; it is that the breakeven diesel price for a farm on $0.15/kWh power is $1.88 a gallon, and diesel has not printed near that in years. Any pump still burning diesel in 2026 is doing so because of a wire, a right-of-way or a line-extension quote — not because of the arithmetic. That reframes the problem from an energy decision to an interconnection decision, and those have very different lead times.
3. What the switch is worth, per acre
Converting the electric consumption figures at both ends of the commercial rate range, against the sourced $5.00/gal diesel column:
| System / crop | Diesel @ $5.00 | Electric @ $0.15 | Electric @ $0.20 | Saving @ $0.15 | Saving @ $0.20 |
|---|---|---|---|---|---|
| Surface, row crop 10.5" | 64.44 | 24.15 | 32.20 | 40.29 | 32.24 |
| Well, row crop 10.5" | 77.32 | 28.98 | 38.64 | 48.34 | 38.68 |
| Surface, rice 24" | 147.30 | 55.20 | 73.60 | 92.10 | 73.70 |
| Well, rice 24" | 176.74 | 66.24 | 88.32 | 110.50 | 88.42 |
All $/acre. Diesel column: Southern Ag Today, Jul 20, 2026. Electric columns are Crop Root Zone calculations from the same source's kWh-per-acre-foot assumptions (183.99 surface, 220.79 well) at 0.875 and 2.0 acre-feet respectively. Excludes demand charges, conversion capital and any standby-generation requirement.
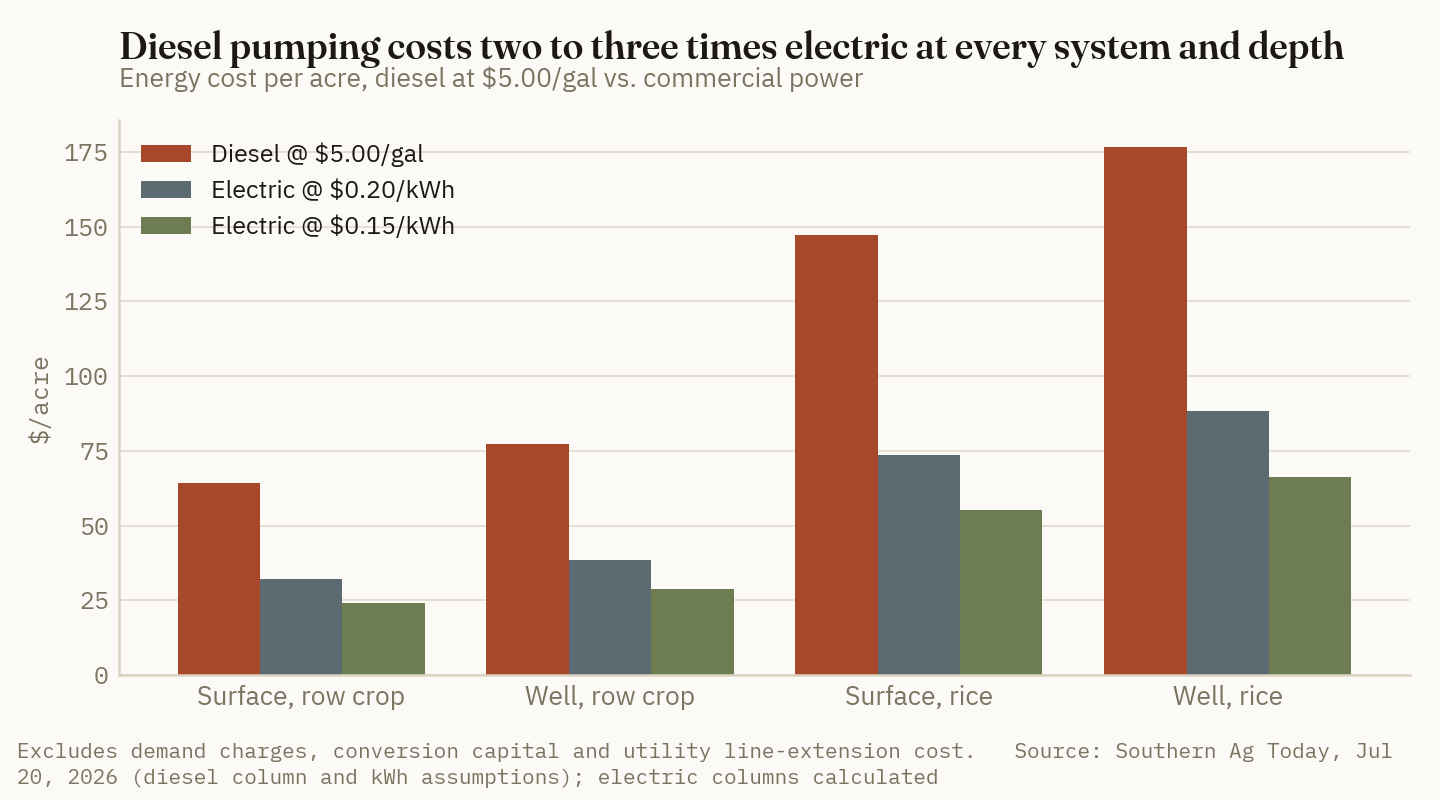
The annual figures follow directly. A thousand acres of well-irrigated row crop saves $48,340 a year at $0.15/kWh power. A thousand acres of well-irrigated rice saves $110,500.
Against that sits conversion capital, and this is where an honest analysis has to stop quoting and start flagging. A well conversion needs a motor, a control panel, a service drop and — the item that actually decides projects — three-phase power at the wellhead. Where three-phase already runs to the site, the equipment cost is modest against savings of this size. Where it does not, the utility line-extension quote is the entire project, it is site-specific, it scales with distance, and it is not a number that can be responsibly generalized from a desk. We are not going to invent one. The correct move is to get the extension quote in hand before treating the per-acre savings above as available.
Two further caveats belong on the same page. Agricultural electric tariffs frequently carry demand charges priced off peak kilowatt draw, and an irrigation load is close to the worst possible demand profile — high draw, concentrated in a few summer months. A pure $/kWh comparison understates electric cost where a demand charge applies. And a diesel unit is portable and independent of the grid; an electric unit is neither, which matters in regions where summer load-shedding is a live possibility.
4. Why the year-over-year number matters more than the level
Diesel at $5.348 is up $1.548 from a year ago (FleetOwner, Aug 5, 2026). Run that delta through the pumping model rather than the headline.
At 15.46 gallons per acre for a well system at 10.5 inches, a $1.548 increase is $23.93 an acre of pure year-over-year cost inflation on row-crop irrigation. At 35.34 gallons per acre for rice at 24 inches, it is $54.71 an acre. Neither of those showed up in a fertilizer quote, a seed invoice or a cash rent negotiation. They showed up in a fuel tank.
| Year-over-year diesel cost increase | $/acre |
|---|---|
| Well, rice 24" | 54.71 |
| Surface, rice 24" | 45.60 |
| Well, row crop 10.5" | 23.93 |
| Surface, row crop 10.5" | 19.95 |
Crop Root Zone calculation: gallons per acre from Southern Ag Today's Jul 20, 2026 assumptions, multiplied by the $1.548/gal year-over-year change reported by EIA for Aug 4, 2026.
Ground Truth: Irrigated budgets built last winter are wrong by $20 to $55 an acre, and the error is concentrated entirely in the irrigated ground — which means it is concentrated in the acres the operation considered its safest. A dryland acre absorbed none of this. Any operation carrying a mixed dryland/irrigated book and tracking cost at the whole-farm average has diluted a real $55/acre problem into a small-looking one. Pull the irrigated acres out and re-cost them separately before the next cash rent conversation, because on rice ground that $54.71 is a meaningful share of what the landlord and the operator are currently arguing over.
The direction from here is genuinely uncertain and worth saying so. The diesel move is attributed to Strait of Hormuz tensions and ongoing US–Iran negotiations, with a potential reopening expected to move crude and fuel costs (FleetOwner, Aug 5, 2026). A resolution could take a large piece of this back out. But the conversion decision does not depend on that forecast: at $0.15/kWh power the breakeven diesel price is $1.88 a gallon, and no plausible resolution scenario returns diesel there.
Market read: none. This is a utility-tariff and fuel-price story; no name on the approved list has a clean read on it.
5. What to do before next season
Meter the pumps, not the farm. Hours-run on each engine and gallons burned per season are the two inputs that turn the tables above into your actual numbers. Most operations know the fuel bill and not the split.
Get the line-extension quote now, not in April. Utility engineering queues and easement work run in months. A conversion decided in spring is a conversion that misses the season.
Ask the utility for the irrigation tariff specifically, including the demand-charge structure and any interruptible or seasonal rate. The $/kWh headline is not the whole bill, and irrigation is exactly the load profile demand charges are designed to catch.
Re-cost irrigated acres separately in the 2027 budget. The $19.95 to $54.71 per-acre year-over-year increase does not exist on dryland ground, and averaging it across the whole farm hides it precisely where it needs to be seen.
References
- Southern Ag Today (Michael Deliberto and Stacia Davis-Conger), "Fuel Pricing Impacts Irrigation Pumping Costs Across All Systems," Jul 20, 2026 — https://southernagtoday.org/2026/07/20/fuel-pricing-impacts-irrigation-pumping-costs-across-all-systems/
- FleetOwner, "Diesel prices rise to $5.35/gal amid Strait of Hormuz tensions," Aug 5, 2026, citing US Energy Information Administration data released Aug 4, 2026 — https://www.fleetowner.com/emissions-efficiency/news/55395603/diesel-prices-rise-to-535-gal-amid-strait-of-hormuz-tensions
- Oklahoma Farm Report, "Fuel Pricing Impacts Irrigation Pumping Costs Across All Systems," Jul 20, 2026 — https://www.oklahomafarmreport.com/2026/07/20/fuel-pricing-impacts-irrigation-pumping-costs-across-all-systems/
- US Energy Information Administration, Weekly Retail Gasoline and Diesel Prices, accessed Aug 5, 2026 — https://www.eia.gov/petroleum/supply/weekly/pdf/table14.pdf
Disclosures
Crop Root Zone is an independent publication. Nothing here is investment advice. Market calls, where included, reflect the editors' own read and are not a recommendation to buy or sell any security.
Urea Fell $148 a Ton Since May. DAP Rose a Dollar. Only One of Those Pays for a Building.
The seasonal spread that justifies on-farm dry fertilizer storage sits almost entirely in nitrogen — and the shed's real competitor is not the spring price, it is a prepay contract that costs no capital at all.
Two DTN collection weeks, nine weeks apart, settle most of the argument about on-farm fertilizer storage. In the week of May 18–22, retail urea averaged $831/ton and anhydrous $1,118/ton at the end of a 14-week run of increases (DTN/Progressive Farmer, May 27, 2026). In the week of July 20–24, urea was $683 and anhydrous $962 (DTN/Progressive Farmer, Jul 29, 2026). Over the same nine weeks DAP went from $912 to $913, MAP from $953 to $958, and potash sat at $494 both times. A building that captures a $148/ton move on urea is a good investment. The same building, filled with the products it is actually designed to hold, captured six dollars a ton.
1. The spread, product by product
| Product | May 18–22 | Jul 20–24 | Change | % | Storable in a dry shed? |
|---|---|---|---|---|---|
| Urea (46-0-0) | 831 | 683 | −148 | −17.8% | Yes |
| Anhydrous (82-0-0) | 1,118 | 962 | −156 | −14.0% | No — pressure vessel |
| UAN32 | 586 | 461 | −125 | −21.3% | No — liquid tank |
| UAN28 | 531 | 473 | −58 | −10.9% | No — liquid tank |
| MAP | 953 | 958 | +5 | +0.5% | Yes |
| DAP | 912 | 913 | +1 | +0.1% | Yes |
| Potash | 494 | 494 | 0 | 0.0% | Yes |
| 10-34-0 | 724 | 718 | −6 | −0.8% | No — liquid tank |
Delivered retail, $/ton. Sources: DTN/Progressive Farmer, May 27, 2026 (week of May 18–22) and Jul 29, 2026 (week of Jul 20–24). Percentage changes are Crop Root Zone calculations.
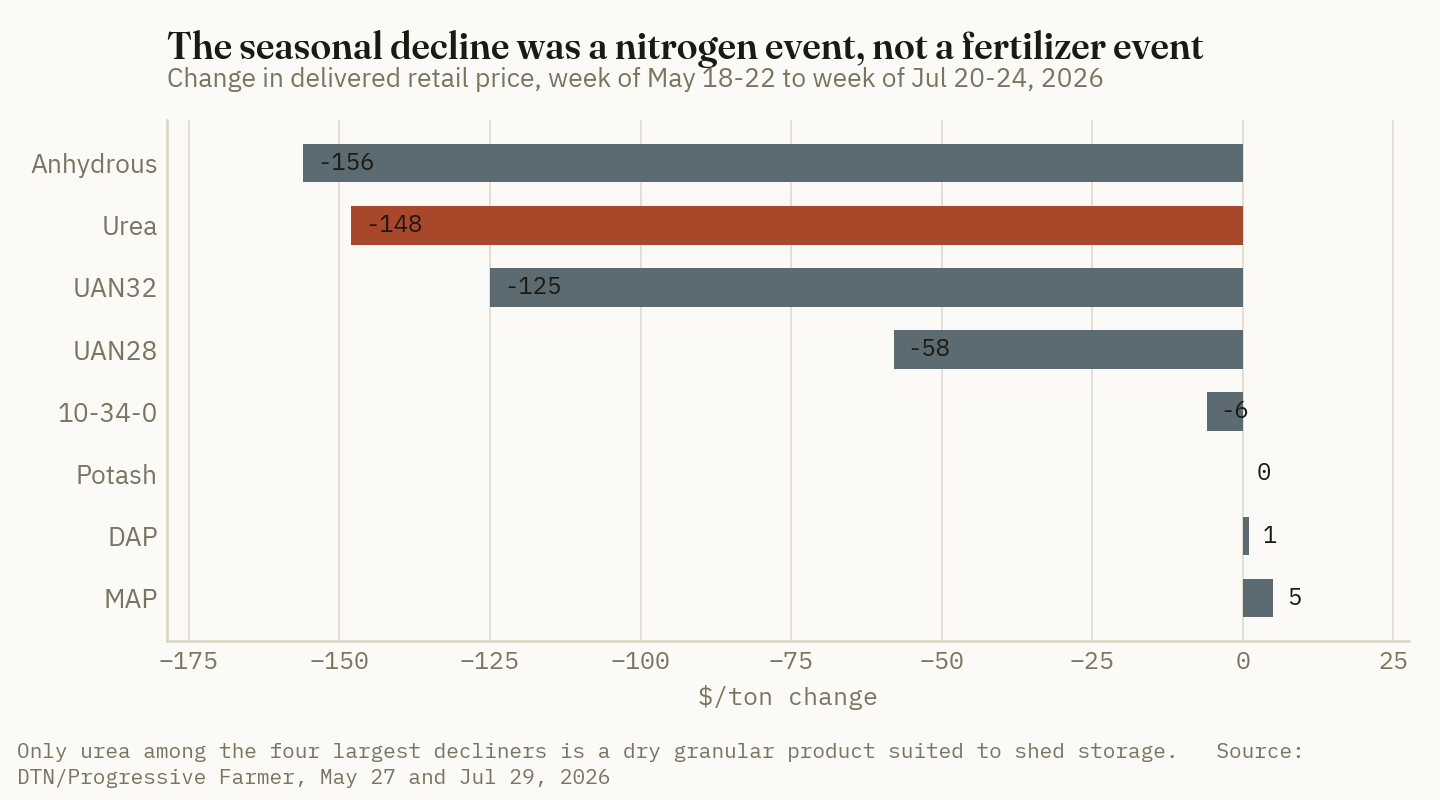
−$148/ton
The move in retail urea between DTN's May 18–22 and July 20–24 collections. Over the same nine weeks, DAP moved +$1. (DTN/Progressive Farmer, May 27 and Jul 29, 2026)
The table sorts itself into an awkward shape for anyone planning a dry fertilizer building. Of the four products with a meaningful seasonal decline, exactly one — urea — is a dry granular product that belongs in a shed. Anhydrous needs a pressure vessel and a nurse tank fleet. UAN32 and UAN28 need lined liquid tanks and containment. And of the three products a dry building is classically justified by — DAP, MAP and potash — none moved.
Ground Truth: The standard pitch for on-farm dry storage is a blended one: build the shed, buy P and K in the summer, save on all of it. This season's numbers say that blend is doing the work of a single product. Phosphate and potash showed no exploitable seasonal decline at all — DAP and MAP actually rose — so a building sized and financed against a whole-farm dry fertilizer bill is being underwritten by the urea line alone. Size the building to urea tonnage, not to total dry tonnage, and the capital number gets substantially smaller and substantially easier to justify.
There is also a directional read worth separating from the seasonal one. Phosphate is not flat because it lacks a seasonal pattern; it is flat because it is in a firm market — DAP is +13% and MAP +9% year over year, while urea is only +6% and UAN32 is actually −7% (DTN/Progressive Farmer, Jul 29, 2026). A storage strategy built to buy the seasonal dip does nothing about a product that is trending up, which is a different problem requiring a different instrument.
2. What the building costs, and what it holds
Construction cost has to be estimated rather than cited here, and we will label it as such throughout. Published 2026 ranges for steel agricultural building shells run $18–$28 per square foot unfinished, with materials at $15–$25/sq ft and installation adding $10–$30/sq ft depending on scope (National Steel Buildings, 2026; SteelCo Buildings, accessed Aug 5, 2026). A fertilizer building is not a bare shell — it needs bunker walls that resist corrosive product loading, ventilation, a covered load-out, a wash-down floor and electrical — so the finished cost runs well above the shell figure.
Working a representative case with explicit assumptions:
| Line | Value | Basis |
|---|---|---|
| Building footprint | 3,600 sq ft (60' × 60') | Assumption |
| Shell cost at $23/sq ft | $82,800 | Midpoint of published 2026 range |
| Bunker walls, ventilation, load-out, electrical, floor | ×1.8 multiplier | Estimate — highly site-specific |
| Installed cost | ~$149,000 | Estimate |
| Usable capacity at ~14 ft pile, 50% fill efficiency, 60 lb/cu ft | ~600 tons | Estimate |
| Cost per ton of capacity | ~$248/ton | Calculated |
Crop Root Zone estimate. Shell cost range per National Steel Buildings (2026) and SteelCo Buildings (accessed Aug 5, 2026); every other line is a modeled assumption, not a quoted figure. Site conditions, permitting, containment requirements and local contractor pricing will move the installed number materially in either direction. Get a quote.
Annualizing that over a 20-year life at a 6% cost of capital gives a capital recovery factor of 0.0872, or $12,990 a year. Spread across 600 tons of capacity that is $21.65 per ton per year in ownership cost before insurance, maintenance, handling labor and the shrink and caking risk that comes with holding hygroscopic product through a Gulf-humid summer. Call it $25–30/ton/year all-in as a working figure.
| Annual cost per ton of storage | $/ton/yr | |
|---|---|---|
| All-in estimate (ownership + operating) | 28 | ██ |
| Ownership only (capital recovery) | 22 | ██ |
| Urea seasonal spread captured, 2026 | 148 | ██████████ |
| DAP seasonal spread captured, 2026 | 1 | |
Spread figures: DTN/Progressive Farmer, May 27 and Jul 29, 2026. Cost figures are Crop Root Zone estimates per the table above.
3. What it returns, and the year that return assumes
Take a 3,000-acre corn operation applying 180 lb N/acre from urea. That is 540,000 lb of N, or 587 tons of urea at 46% analysis — which the 600-ton building holds almost exactly.
| Line | Value |
|---|---|
| Urea required, 3,000 acres at 180 lb N/acre | 587 tons |
| Spread captured at $148/ton (2026 May→Jul) | $86,876 |
| Less annualized building cost at $28/ton | −$16,436 |
| Net, in a year like 2026 | $70,440 |
Crop Root Zone calculation. Tonnage derived from a 46% urea analysis at a stated agronomic rate. Spread per DTN/Progressive Farmer, May 27 and Jul 29, 2026. Excludes working capital cost on the inventory itself, and assumes the entire requirement is bought at the July level and none at the May level.
Payback inside a single season, on those assumptions. Which is exactly the point at which an honest analysis has to slow down, because 2026 was not an average year and the arithmetic above is doing something slightly dishonest. Three things in particular:
The spread is not $148 every year. Urea fell 17.8% peak-to-trough over nine weeks in a market unwinding a Middle East supply shock, having peaked above $700/MT internationally in April (Trading Economics, accessed Aug 5, 2026). In a year when nitrogen trends sideways or rises through the summer, the building captures nothing and still costs its $16,436.
Buying the whole requirement at the low is a backtest, not a plan. The July trough is only identifiable now. Illinois extension work on fertilizer purchase timing notes that spreading purchases across multiple windows raises the likelihood of transacting near the season average, which is the realistic outcome, not the low (farmdoc daily, Aug 12, 2025). A building lets you buy at the low; it does not tell you when the low is.
Working capital is not free. Holding $400,000 of urea from July to April at a 7% operating note is roughly $21,000 of interest — a line the table above omits and one that eats 30% of the modeled net.
Adjust for all three and the return is real but far less spectacular: a building that captures perhaps half the headline spread in a good year and nothing in a flat one, against a fixed annual cost.
4. The comparison almost nobody runs
Here is the analysis that decides the project, and it is not the one in Section 3.
The alternative to building a shed is not buying fertilizer in April at $831. It is signing a summer prepay contract with a retailer at approximately the July price and taking delivery in spring. Prepay captures the same seasonal spread, requires zero capital, and moves the storage, shrink, caking and handling risk onto the retailer's balance sheet.
| On-farm building | Summer prepay contract | |
|---|---|---|
| Capital required | ~$149,000 (estimate) | $0 |
| Annual fixed cost | ~$16,400 (estimate) | $0 |
| Captures seasonal spread | Yes | Yes |
| Working capital tied up | Full inventory value | Full contract value |
| Storage/shrink/caking risk | Farm | Retailer |
| Counterparty risk | None | Retailer insolvency / non-delivery |
| Timing flexibility | Any day of the year | Retailer's program window only |
| Product availability at application | In the yard | Depends on retailer logistics |
| Basis/retail margin | Farm may buy wholesale-adjacent | Pays retail |
Ground Truth: The building's return is not the $148 seasonal spread. It is the difference between the summer spot price and the best available prepay quote, plus the option value of being able to buy on any day instead of inside the retailer's program window, plus the value of having product physically in the yard on a wet spring morning when the retailer's trucks are three days out. Those three things are real and worth something — but they are worth far less than $148/ton, and a farm that justifies the capex on the headline spread has quietly assumed the retailer offers no prepay at all. Get the prepay quote first. If it lands near the summer spot, the building is buying logistics and optionality, not price — and it should be priced against those, at which point the honest question is whether $16,400 a year is worth never waiting on a delivery truck.
That last item is not a small consideration, and it is the reason on-farm storage keeps getting built in spite of the arithmetic. Application timing on nitrogen is weather-constrained and the window is short. An operation that loses two suitable field days a season waiting on delivery is losing something that does not appear in any of the tables above.
5. When the building is still right
When urea tonnage alone justifies it. Size to the nitrogen requirement, not the total dry bill. On the case above that is 587 tons, not the 1,000+ ton building a whole-farm blend calculation would specify.
When prepay is unavailable, rationed, or priced above spot. In tight years retailers cap prepay volumes or price the program above the summer market. That is precisely when owned storage earns its keep — and it is not knowable in advance, which is an argument for the building as insurance rather than as arbitrage.
When the operation is far enough from a terminal that spring logistics are the binding constraint. This is a field-days argument, and it is the strongest one. Price it as such.
When the building does more than one job. A structure that stores fertilizer in winter and equipment or seed the rest of the year amortizes across more than the fertilizer line, and the $21.65/ton ownership figure falls accordingly.
Not on the strength of a single season's spread. 2026 handed nitrogen buyers an unusually clean seasonal decline. Underwriting twenty years of capital recovery on nine weeks of an unwinding supply shock is the error this piece exists to name.
Market read: none. This is a capital-budgeting question at the farm gate; no name on the approved list reads cleanly against it.
References
- DTN/Progressive Farmer, "Some Fertilizer Prices Fall for First Time in 14 Weeks," May 27, 2026 — https://www.dtnpf.com/agriculture/web/ag/crops/article/2026/05/27/fertilizer-prices-fall-first-time-14
- DTN/Progressive Farmer, "Fertilizer Prices Keep Sliding as UAN32 Leads 4 Nutrients in Significant Drops," Jul 29, 2026 — https://www.dtnpf.com/agriculture/web/ag/crops/article/2026/07/29/fertilizer-prices-keep-sliding-uan32
- farmdoc daily (Paulson, Schnitkey, Monaco and Zulauf), "Fertilizer Decisions for the 2026 Crop Year," Aug 12, 2025 — https://farmdocdaily.illinois.edu/2025/08/fertilizer-decisions-for-the-2026-crop-year.html
- National Steel Buildings, "Agricultural Building Construction Cost Per Sq Ft (2026)," 2026 — https://nationalsteelbuildingscorp.com/blog/agricultural-building-construction-cost-per-sq-ft-2026
- SteelCo Buildings, "Price Guide for Steel Agricultural Buildings," accessed Aug 5, 2026 — https://www.steelcobuildings.com/steel-agricultural-buildings-prices/
- Trading Economics, Urea commodity price series, accessed Aug 5, 2026 — https://tradingeconomics.com/commodity/urea
Disclosures
Crop Root Zone is an independent publication. Nothing here is investment advice. Market calls, where included, reflect the editors' own read and are not a recommendation to buy or sell any security.
America's Biggest New Ammonia Plant Broke Ground This Month. Its Customer Burns Ammonia, Not Spreads It.
Blue Point is 1.4 million tonnes a year with better than 95% carbon capture, and the offtake went to a Japanese power company and a trading house — which is why a 2029 startup is not the fertilizer supply relief a 2029 budget wants it to be.
The first genuinely large new ammonia project on the US Gulf Coast in years stopped being an announcement this month and became a construction site. CF Industries confirmed that the Blue Point complex has received all permits and that construction begins in August, with module fabrication starting later this year and low-carbon ammonia production expected in 2029. The facility is designed for roughly 1.4 million metric tonnes of annual nameplate ammonia capacity and to capture greater than 95% of the carbon dioxide generated in production, at a reported cost around $3.7 billion. For anyone modelling nitrogen supply out past this decade, that is a material number. For anyone modelling it as future fertilizer, two details in the structure of the deal matter more than the tonnage does.
1. The project, as built
What's new: Permits secured, construction underway, and a 2029 production date that is now anchored to a physical schedule rather than an intention.
Evidence:
| Blue Point complex | Specification |
|---|---|
| Nameplate ammonia capacity | ~1.4 million tonnes/year |
| CO₂ capture rate | >95% of CO₂ generated in ammonia production |
| Reported capital cost | ~$3.7bn |
| Location | Louisiana, US Gulf Coast |
| Permits | All received; construction begins August 2026 |
| Module fabrication | Begins later in 2026 |
| First low-carbon ammonia production | 2029 |
| Ownership | Joint venture — CF Industries with JERA Co., Inc. and Mitsui & Co. |
| CO₂ expected to qualify for 45Q | ~2.3 million tonnes/year |
Sources: CF Industries Blue Point program disclosures; CF Industries Q2 2026 earnings call, Aug 6, 2026; Fuel Cells Works, Aug 6, 2026; CF Industries/JERA/Mitsui joint venture announcement, Apr 2025.
The joint-venture structure was set in April 2025 and is explicitly described as covering both production and offtake. That is the first of the two details. A project whose offtake was contracted at the same time as its ownership is not building tonnes that will be sold into the spot fertilizer market in 2029. It is building tonnes that already have a home.
JERA is a Japanese power generator. The application it has pursued for ammonia is co-firing — burning ammonia alongside or in place of coal to reduce the carbon intensity of thermal power generation. Mitsui is a trading house. Neither is a fertilizer distributor.
Ground Truth: Do not enter Blue Point into a 2029 nitrogen supply model as fertilizer. 1.4 million tonnes of new Gulf Coast ammonia capacity sounds like the beginning of the end of the tightness every producer is currently describing — but capacity contracted at the point of sanction to an energy offtaker does not compete for a Corn Belt tonne. The correct way to carry it is as capacity that relieves the global ammonia balance at the margin while adding little or nothing to domestic fertilizer availability. Those are different lines in a supply model, and conflating them is the single easiest way to underestimate nitrogen cost at the end of the decade.
2. The credit is doing a lot of the work
What's new: The second structural detail is where the project's revenue comes from. The 45Q tax credit — a federal per-tonne payment for captured and permanently sequestered carbon dioxide — steps up materially once a Class VI injection well permit is secured.
Evidence: CF's existing Donaldsonville carbon capture, already feeding 45Q, contributed $45 million of revenue in the first half of 2026, with management expecting that to step up when the Class VI permit lands and the credit moves from $60 to $85 per tonne of CO₂. At the joint-venture level, Blue Point is expected to qualify for 45Q on roughly 2.3 million tonnes of CO₂ a year.
| 45Q economics | Figure |
|---|---|
| Current credit rate | $60 / tonne CO₂ |
| Rate after Class VI permit | $85 / tonne CO₂ |
| Blue Point CO₂ expected to qualify | ~2.3m tonnes/year |
| Implied annual credit at $85/t (Crop Root Zone calculation) | ~$196m/year |
| CF's stated Blue Point contribution to 2030 mid-cycle EBITDA | ~$300m |
| CF's stated added carbon-capture contribution | ~$100m |
| H1 2026 carbon capture revenue, Donaldsonville | $45m |
Sources: CF Industries Q2 2026 earnings call, Aug 6, 2026, and Blue Point program disclosures. The implied annual credit line is Crop Root Zone's arithmetic (2.3m tonnes × $85), not a company figure.
A caution on that comparison, because it is easy to over-read. The ~$196 million is a joint-venture-level credit calculation; the ~$300 million is CF's own stated contribution to its 2030 mid-cycle EBITDA. They are not on the same ownership basis, and the JV equity split is not applied here. Read the pair as an order-of-magnitude statement rather than a ratio: the sequestration credit is not a rounding item in this project's economics — it is comparable in size to the entire earnings contribution the operator has guided to.
$85/tonne CO₂
The 45Q credit rate Blue Point's economics step up to once a Class VI injection well permit is secured, against roughly 2.3 million tonnes of qualifying CO₂ a year. (CF Industries, Q2 2026 earnings call, Aug 6, 2026)
3. What this means for the emerging "low-carbon fertilizer" question
What's new: Low-carbon ammonia is a genuinely new input material, and the natural grower question — will I be able to buy it, and will it cost more or less — does not yet have a settled commercial answer.
Evidence: What can be stated from the record is narrow, and it is worth separating cleanly from what cannot:
| Question | Status |
|---|---|
| Does the molecule differ agronomically? | No. Ammonia is NH₃ regardless of how the CO₂ from its production was handled. Same analysis, same rate, same handling. |
| Is new US low-carbon capacity being built? | Yes — Blue Point, 1.4 Mt/yr, construction from Aug 2026, production 2029. |
| Is it contracted to fertilizer buyers? | No — offtake sits with an energy generator and a trading house. |
| Does it lower a grower's nitrogen cost? | No identified mechanism. The cost advantage in the project accrues via a tax credit to the producer, not via a lower posted price. |
| Is there a paying premium for low-carbon fertilizer at the farmgate? | Unproven. Interest exists in food-supply-chain emissions accounting, but no established US farmgate premium is documented here. Treat any such claim as speculative until a contract price is public. |
Source: Crop Root Zone assessment against CF Industries Blue Point disclosures and the JV offtake structure, Apr 2025 – Aug 2026.
The agronomic row is the one that settles most of the practical confusion. There is no performance case to evaluate. Low-carbon ammonia is a provenance claim about how a conventional product was manufactured, not a new material with a different yield response. Any value it carries at the farmgate has to come from someone downstream paying for the provenance, and that is a commercial question with no public answer yet.
Ground Truth: The honest position for a grower is that low-carbon ammonia is, for now, someone else's product with your molecule in it. It should not change a rate decision, a source decision or a purchase timing decision this year or next. The one thing it should change is a long-horizon assumption: if you have been carrying "new Gulf Coast capacity arrives around 2029 and loosens nitrogen," check whether the capacity you are counting on was contracted to a power company before the first module was fabricated. In this case it was.
4. The part that does help — and by how little
What's new: There is a real, if indirect, benefit to the domestic fertilizer balance, and it is worth stating accurately rather than dismissing.
Evidence: Ammonia is fungible at the global level even when specific tonnes are contracted. A 1.4 million tonne per year plant supplying an Asian power offtaker displaces demand that would otherwise have been met from the international merchant market — which, at the margin, leaves that international supply available to other buyers, including fertilizer buyers. The effect is real. It is also second-order, it does not begin until 2029, and it is small relative to the deficit producers are currently describing.
Against that, the same producer used its August 6 call to say it expects nitrogen conditions to remain constrained into 2027, citing capacity closures, limited new supply, geopolitical disruption and elevated construction expense — and raised its own long-run NOLA urea price assumption from $355 to $385 per short ton. A company does not raise its long-run price deck because it believes its own new plant is about to solve the shortage.
| What Blue Point does for a fertilizer buyer | Magnitude | When |
|---|---|---|
| Adds contracted tonnes to the domestic fertilizer pool | None identified | — |
| Relieves the global merchant ammonia balance at the margin | Second-order | From 2029 |
| Changes the agronomy of nitrogen | None | — |
| Changes 2026–2028 nitrogen availability | None | — |
Source: Crop Root Zone assessment; CF Industries Q2 2026 earnings call, Aug 6, 2026.
5. What to watch
- The Class VI well permit. It is the gate on the $60-to-$85 step in the credit, and by extension on the project economics as guided.
- Whether any US low-carbon ammonia tonnes are ever offered into the domestic fertilizer channel with a published price. That is the event that would turn this from an energy story into a New Inputs story with a number attached.
- Construction and module fabrication milestones through 2027. A 2029 date announced in 2026 is a schedule, not an outcome — and elevated construction cost is one of the reasons the operator gave for raising its long-run price assumption in the first place.
References
- CF Industries, "Blue Point Complex" program page — https://www.cfindustries.com/bluepoint
- CF Industries, "CF Industries Announces Joint Venture with JERA Co., Inc., and Mitsui & Co., for Production and Offtake of Low-Carbon Ammonia," Apr 2025 — https://www.cfindustries.com/newsroom/2025/blue-point-joint-venture
- Fuel Cells Works, "CF Industries to begin construction of $3.7bn Louisiana blue ammonia plant," Aug 6, 2026 — https://fuelcellsworks.com/2026/08/06/clean-energy/cf-industries-to-begin-construction-of-3-7bn-louisiana-blue-ammonia-plant
- Decarbonfuse, "CF Industries Secures Permits, Starts Construction on Blue Point," Aug 2026 — https://decarbonfuse.com/posts/cf-industries-secures-permits-starts-construction-on-blue-point-low-carbon-ammonia-complex
- CF Industries Holdings, Inc., Q2 2026 earnings call, Aug 6, 2026 (45Q rate step, carbon capture revenue, mid-cycle contribution, nitrogen outlook).
- CF Industries Holdings, Inc., H1 2026 results release, Aug 5, 2026.
Disclosures
Crop Root Zone is an independent publication. Nothing here is investment advice. Market calls, where included, reflect the editors' own read and are not a recommendation to buy or sell any security.
A Nitrogen Stabilizer Costs 8 Cents a Pound. Anhydrous Nitrogen Costs 59. Do That Division.
On conserved fertilizer alone, a fall nitrification inhibitor needs nitrogen above $0.667/lb.N to pay — and anhydrous has never been there in the past year. The whole case rests on 3.1 bushels.
Enhanced-efficiency nitrogen products are sold by the pound of nitrogen treated, not by the acre. A nitrification inhibitor applied with fall nitrogen adds roughly $0.08 to each pound of N going on. That pricing convention has an arithmetic consequence that almost nobody states out loud: the product's value is a fraction of the nitrogen price, while its cost is a fixed adder to it. When nitrogen gets more expensive the inhibitor gets relatively cheaper, and when nitrogen gets cheaper the inhibitor gets relatively dearer. DTN's August 5 retail survey put anhydrous at $0.585 per pound of contained nitrogen, down 7% on the month, with UAN32 down 14% and urea down 4%. Every one of those moves made the stabilizer decision harder, not easier — and the number that decides it is smaller than most growers would guess.
1. The pricing convention, and what it implies
What's new: A nitrification inhibitor with fall nitrogen adds about $0.08 per pound of N applied. On a 180 lb.N corn program that is $14.40 an acre — a real line item, roughly the size of a full-rate zinc program or a fungicide pass.
Evidence: Set that fixed adder against the nitrogen it is protecting. Corteva's own trial reporting for nitrapyrin describes an average of 12% more nitrogen remaining in the ammonium form in the second half of May where fall-applied nitrogen was stabilized, and returns of up to $20 an acre over unstabilized acres, with a yield advantage of up to 18 bushels an acre in the strongest trials.
Take the 12% figure at face value as the ceiling on the fertilizer-conservation benefit — it is a measure of nitrogen still in a form that has not moved, not a measure of nitrogen definitively saved, so treating it as the upper bound is generous to the product:
| Nitrogen source | $/lb.N | Value of 12% conserved on 180 lb.N | Inhibitor cost @ $0.08/lb.N | Net |
|---|---|---|---|---|
| Anhydrous | 0.585 | $12.64 | $14.40 | −$1.76 |
| UAN32 | 0.717 | $15.49 | $14.40 | +$1.09 |
| Urea | 0.746 | $16.11 | $14.40 | +$1.71 |
| UAN28 | 0.829 | $17.91 | $14.40 | +$3.51 |
Source: DTN/Progressive Farmer, Aug 5, 2026 for prices; Corteva Agriscience nitrogen stabilizer trial reporting for the 12% figure; $0.08/lb.N inhibitor cost per extension guidance. Conservation value is an upper bound, not an expected value.
The breakeven falls out of the same arithmetic and does not depend on the rate at all. The inhibitor repays itself on conserved fertilizer alone when $0.08 is less than 12% of the nitrogen price — that is, when nitrogen costs more than $0.667 per pound.
$0.667/lb.N
The nitrogen price above which a fall nitrification inhibitor repays its own cost on conserved fertilizer alone, before any yield response. Anhydrous is $0.585. (Derived from $0.08/lb.N inhibitor cost and a 12% conservation ceiling; DTN/Progressive Farmer, Aug 5, 2026)
Ground Truth: The product most often sold with fall anhydrous is the one product-price pairing where the fertilizer-conservation case does not close. And it is not a near miss caused by this month's decline — anhydrous has been below $0.667/lb.N for the entire past year. At last year's price the shortfall was far worse. The fertilizer-savings pitch for fall inhibitors on ammonia has been rhetorical for some time; this month's print merely made it easy to check.
2. Which means the whole case is the yield response
What's new: If conserved fertilizer does not cover the cost, the decision reduces to a single question: how many bushels does the treatment need to return?
Evidence: At $14.40 an acre and December 2026 corn at $4.62 a bushel:
3.1 bu/acre
The yield response a $14.40/acre fall nitrogen stabilizer must deliver to break even at $4.62 corn, counting no fertilizer savings at all. (Computed from $0.08/lb.N × 180 lb.N and CME December 2026 corn settlement, Aug 6, 2026)
That is a low bar against the trial evidence, and it stays low across any plausible corn price:
| Corn price | Bushels needed to cover $14.40/acre | |
|---|---|---|
| $3.75 | 3.8 | ██████████ |
| $4.25 | 3.4 | █████████ |
| $4.62 | 3.1 | ████████ |
| $5.25 | 2.7 | ███████ |
| $6.00 | 2.4 | ██████ |
Computed from a $14.40/acre treatment cost on a 180 lb.N program. Source: Crop Root Zone arithmetic.
Corteva's reporting cites returns of up to $20 an acre and yield advantages of up to 18 bushels in its trials. "Up to" is doing load-bearing work in both figures — these are the strong end of a distribution whose weak end is a year when nitrogen would not have moved anyway. But 3.1 bushels is not the strong end of anything. It is the kind of response a treatment can deliver in a wet spring and fail to deliver in a dry one, which is the correct way to think about it: the inhibitor is insurance against overwinter and early-spring nitrate loss, priced at about three bushels a year.
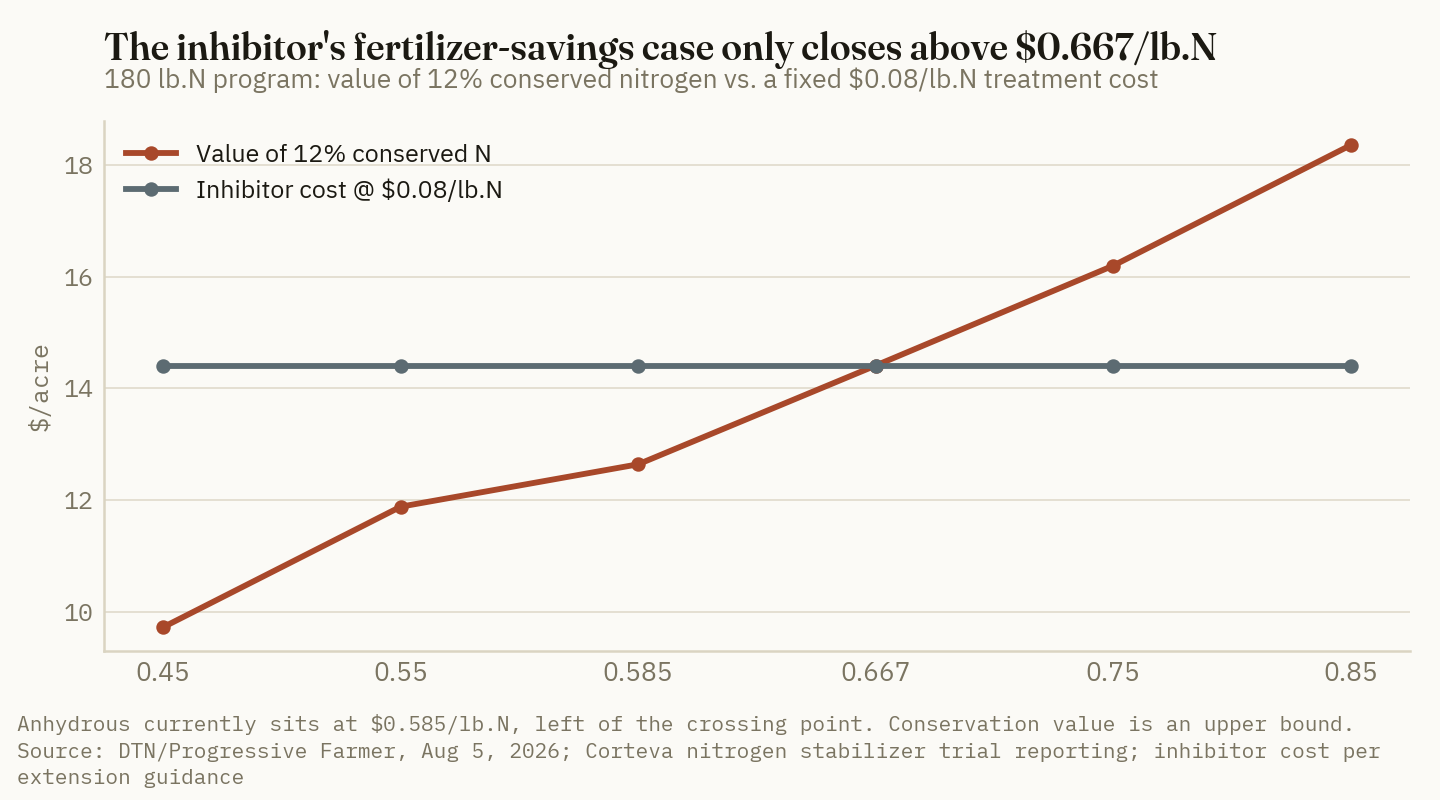
Ground Truth: Stop underwriting fall inhibitors on fertilizer savings and underwrite them as weather insurance, because that is what the arithmetic says they are. The premium is about three bushels an acre. The claim only pays in years with meaningful overwinter or early-spring water movement. A grower on well-drained ground with a dry-spring history is buying a policy on a peril they do not have; a grower on tile-drained heavy ground is buying it well below what the peril is worth.
3. The urease inhibitor is a different product with different arithmetic
What's new: Urease inhibitors — NBPT and its relatives — address a different loss pathway, on a different product, in a different season, and their evidence base is both stronger and wider in dispersion.
Evidence: NBPT targets ammonia volatilization from surface-applied urea and UAN, not nitrification. Published meta-analyses put the reduction in ammonia volatilization at roughly 53% versus untreated urea, within a range across studies of about 15.2% to 61%. The associated yield gain averages roughly 6.0%, with a study range from −0.8% to +10.2%.
| Product class | Loss pathway addressed | Typical placement | Evidence, central estimate | Evidence, range |
|---|---|---|---|---|
| Nitrification inhibitor (nitrapyrin) | Nitrate leaching / denitrification | Fall or spring, injected | +12% N still in ammonium in late May | Varies by season |
| Urease inhibitor (NBPT) | Ammonia volatilization | Surface-applied urea/UAN | −53% volatilization; +6.0% yield | −0.8% to +10.2% yield |
Source: Cantarella et al., "Agronomic efficiency of NBPT as a urease inhibitor: A review," ScienceDirect; meta-analytic ranges as published in Scientific Reports (2023); Corteva trial reporting for nitrapyrin.
A 6.0% mean yield gain on a 200 bushel crop is 12 bushels — $55 an acre at $4.62 corn, comfortably above any plausible treatment cost. But the honest reading of that literature is the range, not the mean: it includes outcomes where treated urea yielded slightly less than untreated. And a substantial share of the underlying trials come from systems with far higher volatilization pressure than a Corn Belt grower incorporating urea ahead of a rain.
Ground Truth: The two inhibitor classes are sold as one category and should not be bought as one. The urease inhibitor has the better evidence base and the worse targeting problem — it only earns its keep when urea genuinely sits on the surface in volatilizing conditions, and a grower who incorporates or applies ahead of half an inch of rain has already bought the same protection for nothing. The nitrification inhibitor has the weaker fertilizer-savings case and the clearer indication: heavy, wet, tile-drained ground with fall-applied nitrogen.
4. What falling nitrogen actually changed
What's new: The month's decline did not change whether these products work. It changed the size of the pot they are protecting, and it changed one thing about the fall decision that matters more than either inhibitor.
Evidence: On a 180 lb.N program, the nitrogen bill itself moved as follows over the month, derived from DTN's published percentage changes:
| Program | Nitrogen cost/acre, a month ago* | Now | Inhibitor as % of N bill |
|---|---|---|---|
| Anhydrous, 180 lb.N | $113.22* | $105.30 | 13.7% |
| UAN32, 180 lb.N | $150.10* | $129.10 | 11.2% |
| Urea, 180 lb.N | $139.81* | $134.28 | 10.7% |
*Derived from DTN's published month-over-month percentage changes applied to the Aug 5, 2026 print, not separately observed. Source: DTN/Progressive Farmer, Aug 5, 2026; inhibitor at $0.08/lb.N.
The inhibitor now costs 13.7% of the anhydrous nitrogen bill, up from about 12.7% a month ago. It became a bigger share of a smaller bill. That is the correct way to state what happened, and it is the reason the decision got harder rather than easier despite everything getting cheaper.
There is a second-order effect worth naming. A stabilizer's value is partly the option value of applying nitrogen early — of using the fall window rather than competing for spring application capacity. If the nitrogen price advantage of fall anhydrous is narrowing against spring-applied UAN32, as it did sharply this month, then some of what the inhibitor was buying is being repriced independently.
Ground Truth: The stabilizer question and the fall-versus-spring question are the same question and should be answered together. If a grower is on the fence about fall ammonia because UAN32 just closed most of the price gap, the right comparison is not "anhydrous plus inhibitor versus anhydrous" — it is "anhydrous plus inhibitor plus fall logistics versus spring UAN32 with no inhibitor at all." At $0.132/lb.N of remaining ammonia advantage and $0.08/lb.N of inhibitor cost, that comparison is a great deal closer than it was in July.
References
- DTN/Progressive Farmer, "Fertilizer Prices Fall as UAN32 Leads Significant Drops Heading Into August," Aug 5, 2026 — https://www.dtnpf.com/agriculture/web/ag/crops/article/2026/08/05/fertilizer-prices-fall-uan32-leads
- Corteva Agriscience, "2025 trials prove nitrogen stabilizers maximize profit," nitrogen stabilizer trial results — https://www.corteva.com/us/Resources/crop-protection/corn/nitrogen-stabilizer-trial-results.html
- Corteva Agriscience, "Nitrogen Stabilizers: Frequently Asked Questions" — https://www.corteva.com/us/products-and-solutions/crop-protection/Nitrogen-Stabilizers/Nitrogen-Stabilizers-FAQ.html
- Cantarella, H. et al., "Agronomic efficiency of NBPT as a urease inhibitor: A review," Journal of Advanced Research — https://www.sciencedirect.com/science/article/pii/S2090123218300638
- "Urease inhibitors technologies as strategy to mitigate agricultural ammonia emissions and enhance the use efficiency of urea-based fertilizers," Scientific Reports, 2023 — https://www.nature.com/articles/s41598-023-50061-z
- Plymouth County SWCD, nitrogen inhibitor cost guidance — https://www.plymouthswcd.com/nitrogen-inhibitor
- CME Group, December 2026 corn settlement, Aug 6, 2026.
Disclosures
Crop Root Zone is an independent publication. Nothing here is investment advice. Market calls, where included, reflect the editors' own read and are not a recommendation to buy or sell any security.
The Zinc Costs $6 an Acre and Lasts Three Years. The Argument Is Entirely About Which Critical Level You Use.
Published critical soil-test zinc levels for corn run from 0.5 ppm to 7 ppm depending on the state and the pH — a fourteenfold spread that decides a 10-to-1 return, while the zinc price decides almost nothing.
Zinc is the micronutrient most commonly deficient in North American corn, ahead of manganese on high-pH soils, boron on sands and iron on calcareous ground. It is also the micronutrient with the clearest yield evidence: university trials document 5 to 15 bushel per acre corn responses on zinc-deficient soils. At December 2026 corn of $4.62 a bushel, that is $23.10 to $69.30 an acre of return. And the material costs about six dollars, spread over two to three years. A return that lopsided normally means somebody has mis-stated the cost. In this case the cost is right — what is wrong is the assumption that anyone agrees on when the soil is deficient. Published critical levels for soil-test zinc span a factor of fourteen across mainstream extension guides.
1. The material cost is trivial, and worth doing precisely
What's new: Wholesale zinc sulfate pricing is publicly indexed, so the material cost of a zinc program can be built from the ground up rather than taken from a retail quote.
Evidence: US zinc sulfate averaged approximately $971 per metric tonne in Q4 2025 and roughly $0.99 per kilogram — about $990/MT — in Q1 2026. Colorado State University Extension recommends a single application of 5 to 10 pounds of zinc per acre, equivalent to 15 to 30 pounds of 36% zinc sulfate, as sufficient for two to three years of production.
Working that through:
| Step | Value | Basis |
|---|---|---|
| Zinc sulfate, wholesale | $990/MT | US average, Q1 2026 |
| Per pound of product | $0.449 | $990 ÷ 2,205 lb |
| Per pound of contained Zn (36%) | $1.247 | $0.449 ÷ 0.36 |
| Material at 5 lb Zn/acre | $6.23 | Low end of CSU rate |
| Material at 10 lb Zn/acre | $12.47 | High end of CSU rate |
| Material per acre-year (3-year residual) | $2.08 – $4.16 | Spread over CSU's stated residual |
Wholesale index prices; a grower pays freight, blending, retail margin and application on top. Source: IMARC Group and Expert Market Research zinc sulfate price indices, Q4 2025 and Q1 2026; Colorado State University Extension rate guidance.
Retail is naturally higher, and published 2026 rate summaries put a basic zinc program at $1.20 to $8 an acre, bundled micronutrient blends added to a starter system at $8 to $15 an acre, and full multi-nutrient micronutrient programs at $15 to $60 an acre.
| Program tier | $/acre | What you are buying | |
|---|---|---|---|
| Basic zinc only | 1.20 – 8 | ██ |
Zinc, and only zinc |
| Zinc + boron + manganese in starter | 8 – 15 | ████ |
Three nutrients, one of them documented on your field |
| Full micronutrient suite | 15 – 60 | ██████████ |
Four or more, most of them unverified |
Source: published 2026 micronutrient rate summaries; bar scaled to the top of each range.
Ground Truth: A $15/acre bundled micro blend is not a zinc decision. The zinc inside it costs about six dollars of material at a full rate; the other nine-plus dollars buys boron, manganese and whatever else is in the jug, on fields where the soil test may show no deficiency in any of them. If zinc is the documented problem, buy zinc. Bundling is a retail convenience being sold as an agronomic package, and it roughly doubles the price of the one component with real evidence behind it.
2. The disagreement that actually decides the money
What's new: The critical soil-test zinc level — the number below which a response is expected — is not a settled figure. Mainstream extension guides differ by more than an order of magnitude, and the difference is largely about pH.
Evidence:
| Source | Critical DTPA soil-test Zn | Condition |
|---|---|---|
| University of Minnesota Extension | 0.5 ppm | Response likely at or below |
| University of Minnesota Extension | 0.75 ppm | Response possible at or below |
| NDSU Extension | 1.0 ppm | Critical level, DTPA extraction |
| Michigan State University Extension | 2.0 ppm | At pH 6.6 |
| Michigan State University Extension | 7.0 ppm | At pH 7.0 |
Source: University of Minnesota Extension zinc guidance; NDSU Soil Fertility Recommendations for Corn; MSU Extension E2904, Nutrient Recommendations for Field Crops in Michigan.
Read the top and bottom rows together. A soil testing 1.5 ppm DTPA zinc is comfortably sufficient under the Minnesota framing, marginal under North Dakota's, below critical under Michigan's at pH 6.6, and dramatically deficient under Michigan's at pH 7.0. Same soil, same extraction, four different answers.
14×
The spread between the lowest and highest published critical soil-test zinc levels for corn — 0.5 ppm to 7.0 ppm. The zinc price moved about 2% over the same period. (University of Minnesota Extension; MSU Extension E2904)
The mechanism behind the spread is real rather than a disagreement about methods. Zinc availability falls sharply as pH rises: above roughly pH 7 much of the soil zinc is present in forms the plant cannot reach, so a DTPA number that means "sufficient" on an acid soil means very little on a calcareous one. Michigan's tiered table is not a different opinion about zinc — it is the same opinion with pH written into it, which most guides handle implicitly or not at all.
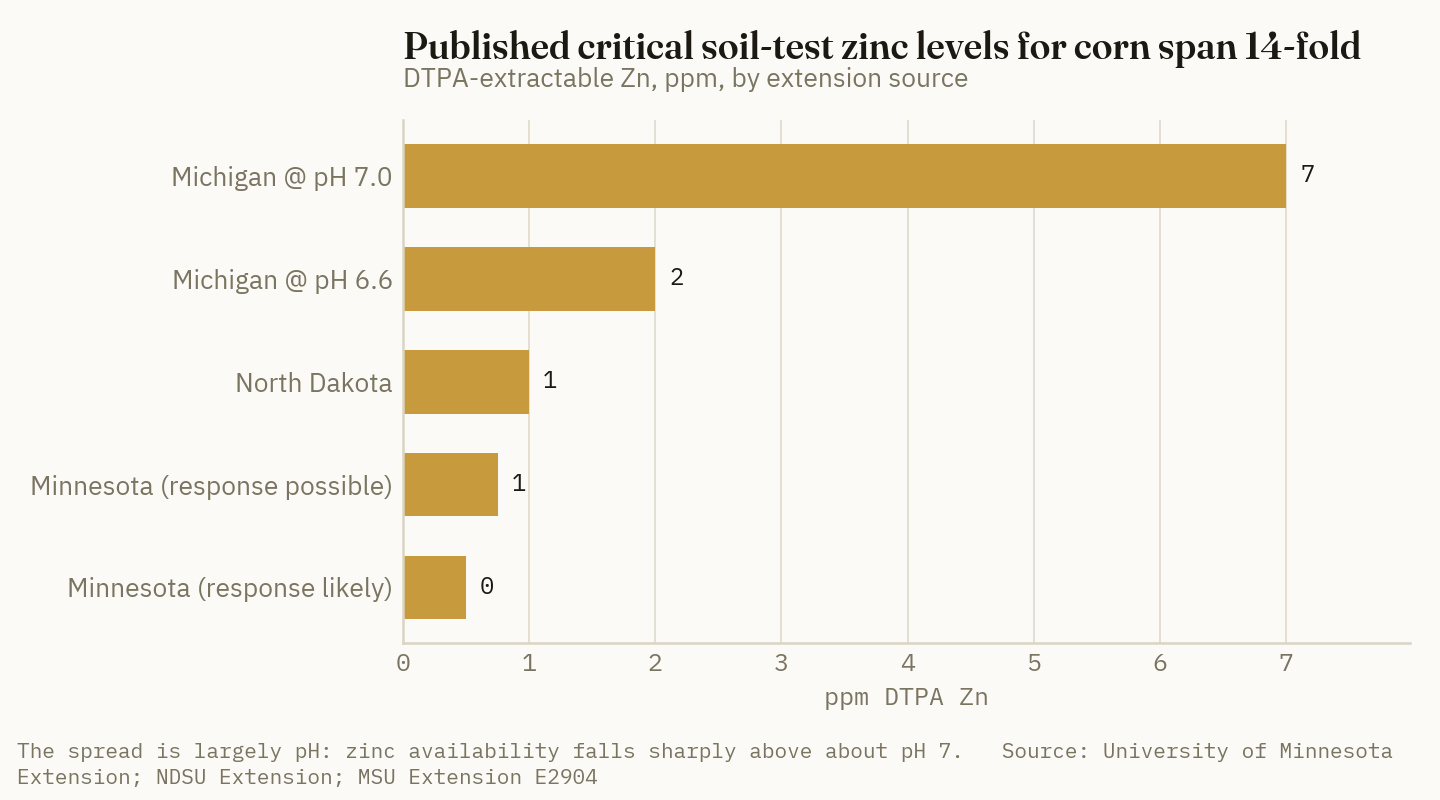
Ground Truth: If your soil test report gives a zinc number without a pH-adjusted critical level beside it, the report has answered the easy half of the question. Ask the lab which critical level table it applied and at what pH. On a soil at pH 7.2 testing 1.2 ppm — a common Corn Belt combination — the honest answer is that the mainstream guides do not agree, and the $6 of material is a cheap way to stop caring which one is right.
3. Sizing the bet honestly
What's new: The asymmetry between cost and potential return is large enough that the usual precision arguments stop mattering — but only on soils where a response is plausible in the first place.
Evidence: At $4.62 December corn, against a full-rate 10 lb Zn/acre application costing $12.47 of material:
| Yield response | Value at $4.62 | Net over $12.47 material | Return multiple |
|---|---|---|---|
| 0 bu | $0 | −$12.47 | 0× |
| 2 bu | $9.24 | −$3.23 | 0.7× |
| 5 bu | $23.10 | +$10.63 | 1.9× |
| 10 bu | $46.20 | +$33.73 | 3.7× |
| 15 bu | $69.30 | +$56.83 | 5.6× |
Yield responses are the documented university range on zinc-deficient soils, not an expectation for any given field. Material cost only; freight, blending and application excluded. Source: Crop Root Zone arithmetic; response range per university trial literature summarized by Pioneer agronomy.
The breakeven is 2.7 bushels an acre on material cost, or roughly 3.2 bushels at the top of the $1.20-$8 retail range for a basic zinc program. Against a documented 5 to 15 bushel response on deficient ground, the bet is heavily favoured. Against zero response on sufficient ground, it is a straight loss of $6 to $12 that lasts three years.
That is the entire decision, and it is worth stating in its plainest form: the zinc question is a diagnosis question, not an economics question. No plausible move in the zinc price changes the answer. Zinc sulfate would have to roughly quadruple before the material cost approached the low end of the response value.
| What could change the zinc decision | Would it? |
|---|---|
| Zinc sulfate price ±20% | No — moves cost by about $2.50/acre at a full rate |
| Corn price ±$1.00 | Marginally — moves breakeven by about 0.7 bu |
| Soil pH ±0.5 | Yes — can move the critical level severalfold |
| A current, correctly-interpreted soil test | Yes — this is the whole decision |
Source: Crop Root Zone analysis from the price and critical-level sources cited above.
Ground Truth: Zinc is one of the few input decisions where the cost of finding out exceeds the cost of acting. A grid soil test costs more per acre than the zinc does. On fields with a plausible deficiency profile — high pH, eroded knolls, high-P soils, cut-and-fill ground, cold early springs with visible interveinal striping in young corn — applying a full rate and moving on is a defensible answer that requires no further analysis. Reserve the testing budget for the nutrients where a wrong answer costs $168 an acre, not six.
4. Where the six dollars comes from this year
What's new: The month's nitrogen decline happens to have freed almost exactly the budget a full zinc program requires.
Evidence: DTN's August 5 print put anhydrous down 7% month over month to $0.585 per pound of contained nitrogen. On a 180 lb.N corn program, that decline is worth about $7.92 an acre against last month's cost. A full-rate 10 lb Zn/acre application costs about $12.47 of material and covers two to three years — roughly $4 to $6 an acre-year.
| Line | $/acre |
|---|---|
| Nitrogen cost released by the month's decline (180 lb.N anhydrous) | 7.92 |
| Full-rate zinc, material, per acre-year over 3 years | −4.16 |
| Remaining | 3.76 |
Source: DTN/Progressive Farmer, Aug 5, 2026; zinc material cost derived from Q1 2026 wholesale index. Nitrogen decline derived from DTN's published month-over-month change, not a separately observed print.
This is a coincidence rather than a causal relationship, and it should not be dressed up as a strategy. But it is a useful framing for a fall input meeting: the single largest input line in the budget moved by more than the entire cost of the micronutrient decision that most operations defer every year on cost grounds.
Ground Truth: The reason zinc gets skipped is almost never the price. It is that it sits on the agenda after nitrogen, phosphate, potash, seed and chemistry, by which point the meeting is over. Move it to the front of the agenda this year, where a $6 decision with a documented 5-to-15-bushel upside belongs, and settle it before the nitrogen argument consumes the room.
Market read: No market call. Zinc sulfate for agriculture is supplied largely through private and industrial-chemical channels rather than by any name on the approved list; the publicly traded fertilizer majors have no meaningful zinc exposure to trade on.
References
- IMARC Group, zinc sulfate / zinc sulphate pricing reports, Q4 2025 and Q1 2026 — https://www.imarcgroup.com/zinc-sulfate-pricing-report
- Expert Market Research, "Zinc Sulfate Heptahydrate Price Trend 2026" — https://www.expertmarketresearch.com/price-forecast/zinc-sulfate-heptahydrate-price-trends
- Colorado State University Extension, "Zinc and Iron Deficiencies" — https://extension.colostate.edu/resource/zinc-and-iron-deficiencies/
- University of Minnesota Extension, "Zinc for crop production" — https://extension.umn.edu/micro-and-secondary-macronutrients/zinc-crop-production
- NDSU Extension, "Soil Fertility Recommendations for Corn" — https://www.ndsu.edu/agriculture/extension/publications/soil-fertility-recommendations-corn
- Michigan State University Extension, E2904, Nutrient Recommendations for Field Crops in Michigan — https://www.canr.msu.edu/resources/nutrient_recommendations_for_field_crops_in_michigan_e2904
- Pioneer Seeds agronomy, "Zinc Deficiencies and Fertilization in Corn Production" — https://www.pioneer.com/us/agronomy/zinc_deficiencies_and_fertilization.html
- University of Wisconsin Extension, A2528, Soil and Applied Zinc — https://corn.aae.wisc.edu/Management/pdfs/a2528.pdf
- DTN/Progressive Farmer, "Fertilizer Prices Fall as UAN32 Leads Significant Drops Heading Into August," Aug 5, 2026 — https://www.dtnpf.com/agriculture/web/ag/crops/article/2026/08/05/fertilizer-prices-fall-uan32-leads
- CME Group, December 2026 corn settlement, Aug 6, 2026.
Disclosures
Crop Root Zone is an independent publication. Nothing here is investment advice. Market calls, where included, reflect the editors' own read and are not a recommendation to buy or sell any security.
A 22% Potash Product Now Sells at a $93 Premium to a 60% One
Intrepid realized $387/ton on langbeinite against $353 on muriate in the first quarter, and told investors why: buyers are paying for the sulfate, not the potassium. At $705 sulfur, the multi-nutrient minerals stopped being a specialty product.
Intrepid Potash sells two potassium products out of southeastern New Mexico. One is muriate of potash — standard 0-0-60, the commodity that sets the world's potassium price. The other is Trio, a granulated natural langbeinite carrying roughly 22% K₂O, 21-22% sulfur and 10.5-10.8% magnesium, all as sulfates. In the first quarter of 2026 the company realized $353 per ton on muriate and $387 per ton on Trio (Intrepid Potash Q1 2026 results, May 6, 2026). The product with a third of the potassium sold for $34 a ton more, and management said plainly why: customers "value the individual components, particularly sulfate, due to ongoing disruptions in raw sulfur supply." Guidance for the second quarter put Trio at $390-400 per ton. That is not a specialty-crop story anymore. It is what happens to an entire product category when the Tampa molten sulfur contract settles at a record $705 per long ton and stays there.
1. The premium, and the fact that it inverted
What's new: The multi-nutrient sulfate minerals have historically traded at a modest premium to muriate on a per-ton basis and a large discount on a per-unit-of-K₂O basis. The per-ton premium has now widened to the point where it exceeds the K₂O differential's ability to explain it.
Evidence: Intrepid's two products, first quarter 2026:
| Product | Analysis | Q1 2026 $/ton | Q1 2025 $/ton | YoY |
|---|---|---|---|---|
| Muriate of potash | 0-0-60 | 353 | 312 | +13% |
| Trio (langbeinite) | ~0-0-22-22S-10.6Mg | 387 | 345 | +12% |
| Premium, Trio over MOP | +$34 | +$33 | — | |
| Trio, Q2 2026 guidance | 390-400 | — | — |
Source: Intrepid Potash Q1 2026 results and earnings call, May 6, 2026. Analyses from Intrepid's published product specifications (21.5-22% K₂O, 21-22% S, 10.5-10.8% Mg, depending on grade). These are producer net realized prices in short tons, not retail delivered prices.
The premium held at roughly $34 a ton in both years, but the composition of what justifies it has changed. Price the nutrients out at current retail values and the arithmetic reorders itself.
2. What is actually in the bag, priced
What's new: At July 2026 retail nutrient values, the sulfur and magnesium in a ton of langbeinite are worth more than the potassium in it. That is a new condition, and it is the whole story.
Evidence: One short ton of langbeinite at the midpoint of Intrepid's published analysis contains 435 lb of K₂O, 430 lb of S, and 212 lb of Mg. Valuing each against a current market reference:
| Nutrient | lb per short ton | Reference price | $/lb | Value in one ton |
|---|---|---|---|---|
| K₂O | 435 | MOP retail, $494/st ÷ 1,200 lb | 0.412 | $179.22 |
| Sulfur | 430 | AMS retail basket, see note | 0.310* | $133.30 |
| Magnesium | 212 | Not separately quoted | n/a | not valued |
| Total valued | $312.52 |
Source: K₂O reference from DTN/Progressive Farmer retail potash, Jul 29, 2026. *The sulfur reference is a Crop Root Zone estimate, not a quoted price: it is derived from published Argus feedstock data putting the year-over-year sulfur cost step at roughly $194 per long ton delivered, applied against a Tampa molten contract at a record $705/lt for the third quarter (Argus Media, Dec 30, 2025 and Jul 13, 2026), and cross-checked against the implied sulfur content of retail sulfur-bearing products. Sulfur has no clean US retail per-pound quote the way N, P and K do, and this figure should be read as an estimate with a wide band. Magnesium is deliberately left unvalued — there is no defensible public per-pound reference for it — which means the $312.52 understates the ton.
Two conclusions survive even a generous error bar on the sulfur estimate.
The sulfate is now roughly as valuable as the potassium. At $179 of K₂O against a sulfur estimate near $133, with magnesium unpriced, the product is no longer a potassium fertilizer that happens to contain sulfur. It is close to a fifty-fifty split, and if magnesium were priced at anything at all the balance would tip further.
The producer is not capturing the whole of it. $387 realized against $312 of valued nutrients plus unvalued magnesium is a modest gap for a granulated, chloride-free, OMRI-listed product — which suggests the premium has further to run rather than that it is stretched.
| Component of a ton of Trio | $ value | Share of valued total | |
|---|---|---|---|
| K₂O (435 lb) | 179.22 | ██████████ |
57% |
| Sulfur (430 lb, estimated) | 133.30 | ███████ |
43% |
| Magnesium (212 lb) | unvalued | — |
Source: as above. Bars scaled to the K₂O value. The sulfur figure is an estimate and is marked as such throughout.
$34/ton
The premium langbeinite commanded over muriate of potash at the same producer in Q1 2026 — on a product carrying roughly a third of the potassium. (Intrepid Potash Q1 2026 results, May 6, 2026)
Ground Truth: The multi-nutrient sulfate minerals have spent forty years being sold as a magnesium fix for sandy, low-Mg ground — a legitimate but small market. The sulfur shock has quietly changed what they are. A product whose second nutrient is now worth nearly as much as its first is not a specialty amendment; it is a sulfur fertilizer with a potassium credit attached, and it should be evaluated against the sulfur products a grower is otherwise buying, not against muriate. Almost nobody is doing that comparison, which is precisely why the premium is only $34.
3. Why the sulfur leg will not un-tighten quickly
What's new: The producer's stated reason for the premium — raw sulfur supply disruption — is not a spot condition. It is a contract that has settled higher in every quarter tracked for two years.
Evidence: The Tampa molten sulfur quarterly contract, the price that actually sets US sulfur-bearing fertilizer economics:
| Quarter | Tampa molten, $/lt | Δ | ||
|---|---|---|---|---|
| Early 2024 | 69 | — | █ |
|
| Mid 2025 | ~270 | +291% | ████ |
|
| Q1 2026 | 495.69 | +84% | ███████ |
|
| Q2 2026 | 655.00 | +32% | █████████ |
|
| Q3 2026 | 705.00 | +8% | ██████████ |
record |
| Q4 2026 | unsettled | — | the open question |
Source: Argus Media, Jul 13, 2026 (Q3 settlement) and prior quarterly settlements.
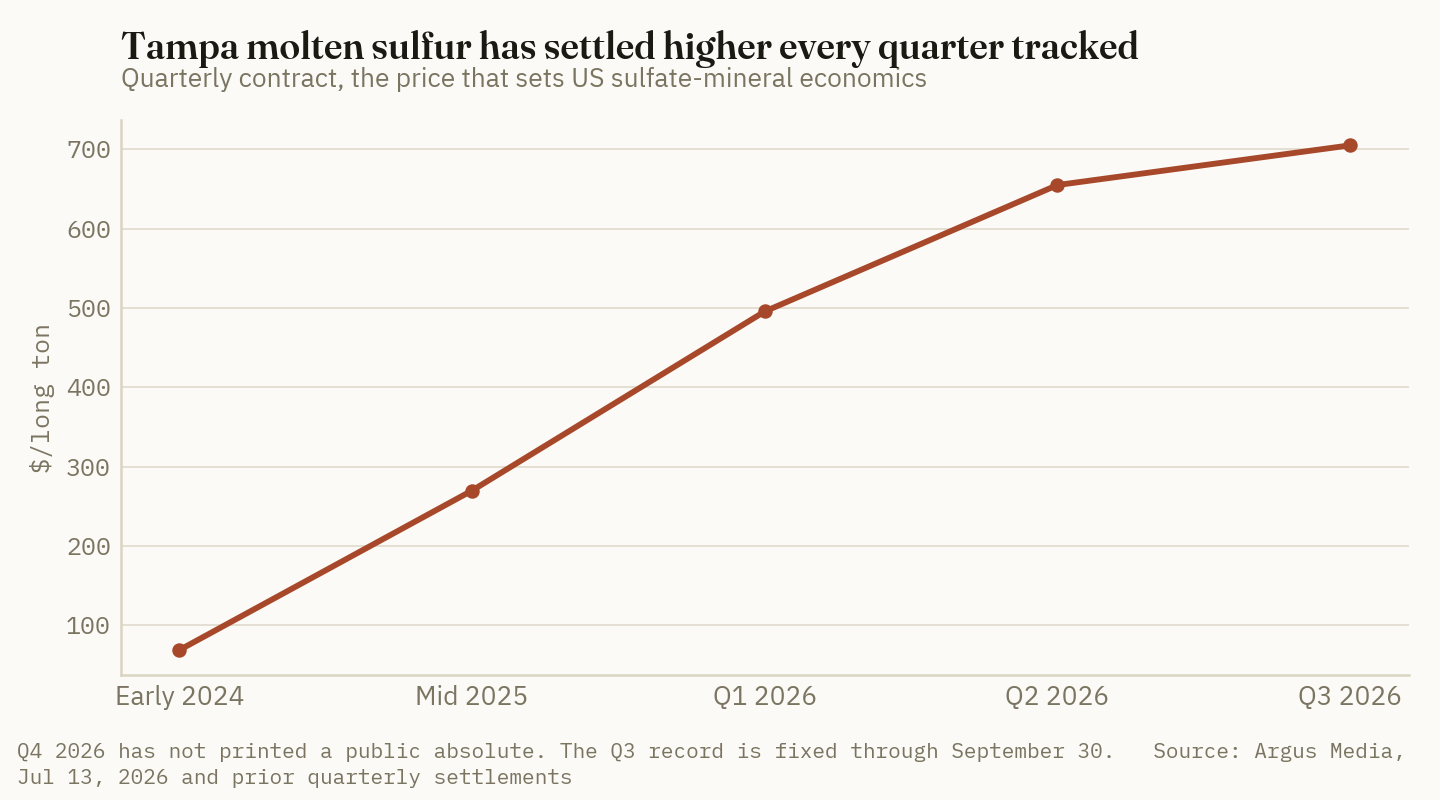
The Q3 contract is fixed through September 30. The Q4 settlement has not printed a public absolute. Meanwhile the Chinese daily spot series that gets quoted as a sulfur signal fell 4.5% on July 27, recovered, and finished July 31 at 9,185.67 CNY/T — a net 3.67% below its July 24 high after a five-session round trip in three directions (Trading Economics/SunSirs, accessed Jul 31, 2026).
That divergence is the point. Anyone reading Chinese spot as the sulfur price would have marked a sulfur-bearing fertilizer position down and back up three times in one week to end where they started. The contract that actually prices a US sulfate mineral did not move at all, because it cannot until the quarter turns.
Ground Truth: A producer whose premium rests on a quarterly contract has a more durable position than one whose premium rests on spot. Intrepid guided Trio to $390-400 for the second quarter before the Q3 sulfur settlement printed at a record, and the Q4 settlement is still open against a contract that has risen in every quarter for two years. The sulfate premium is not a spike to be waited out. It is being repriced on a ratchet, and the next click has not happened yet.
4. The supply answer is a decade away
What's new: The obvious response to a structurally valuable multi-nutrient sulfate is to mine more of it. The world's largest known deposit is under a national park in North Yorkshire, and it is still in feasibility.
Evidence: Anglo American's Woodsmith project targets the world's largest known polyhalite deposit — a hydrated sulfate carrying potassium, sulfur, magnesium and calcium in a single chloride-free granule, sold as POLY4 — at depths reaching approximately 1,500 metres beneath the North York Moors National Park, among the deepest proposed polyhalite mines in the world. In 2026 the project moved forward on two fronts: Anglo American appointed Fluor for feasibility study services in May 2026, appointed Stantec to feasibility work, and Mitsubishi Corporation entered a definitive agreement in February 2026 to invest in the project and collaborate on the feasibility study (Anglo American and Mitsubishi Corporation disclosures, Feb-May 2026).
| Woodsmith / polyhalite | Detail |
|---|---|
| Mineral | Polyhalite — K, S, Mg, Ca in one hydrated sulfate |
| Product | POLY4, chloride-free, granular |
| Depth | ~1,500 m below the North York Moors |
| Status, 2026 | Feasibility — Fluor (May 2026) and Stantec appointed |
| Partner | Mitsubishi Corporation, definitive agreement Feb 2026 |
| Positioning | Complementary to potash, not a direct MOP substitute |
Source: Anglo American project disclosures and Mitsubishi Corporation news release, Feb 20, 2026; Fluor and Stantec appointments as reported, 2026.
Read the status line carefully. Appointing engineering firms for a feasibility study in 2026 places first meaningful commercial tonnage years out, and the project's own positioning is explicit that POLY4 is "complementary or alternative" rather than a potash substitute. Whatever supply relief polyhalite eventually brings to the sulfate market, it does not arrive in time to affect a 2027 fertility program, or a 2030 one.
Ground Truth: The bull case for the sulfate minerals is not that demand is discovering them. It is that supply cannot respond. Langbeinite is mined at commercial scale in a handful of places on earth, the largest identified polyhalite resource is 1,500 metres under a national park and still in feasibility, and the by-product sulfur streams that supply the rest of the sulfur market are tied to refinery and gas-processing runs that nobody adjusts for fertilizer demand. A category with structurally rising demand and a decade-long supply lead time does not mean-revert on schedule.
5. How to actually use this on a farm
What's new: The correct comparison for a grower is not langbeinite versus muriate. It is langbeinite versus the combination of muriate plus a separate sulfur product, which is what most operations are actually buying.
Evidence: Compare two programs delivering approximately the same potassium and sulfur to an acre:
| Program | Product(s) | Rate | Delivers | Notes |
|---|---|---|---|---|
| A — split | MOP 0-0-60 + a sulfur source | 100 lb K₂O + 40 lb S | K₂O, S | Two products, two handling passes, chloride applied |
| B — single | Trio, ~0-0-22-22S-10.6Mg | ~455 lb/acre | ~100 lb K₂O, ~98 lb S, ~48 lb Mg | One product, chloride-free, Mg included |
Source: Crop Root Zone's own construction from Intrepid's published Trio analysis and standard MOP analysis. Rates are illustrative for comparison and are not a recommendation; a real program should be built from a current soil test.
Program B over-delivers sulfur substantially at the rate that matches the potassium, which is either a benefit or waste depending on the soil — and that is exactly the decision the arithmetic clarifies. On low-Mg sandy ground, on chloride-sensitive crops, and on soils where sulfur is genuinely limiting, the single-product route now competes on cost as well as on convenience, because the sulfur it carries is no longer nearly free. On high-Mg, chloride-tolerant Corn Belt ground with adequate sulfur, it does not, and paying a $34 premium for a third of the potassium remains a bad trade.
What has changed is where the line sits. Three years ago, at $69-per-long-ton sulfur, the sulfate in a ton of langbeinite was close to a rounding error and the product only made sense for the magnesium. At $705, it is roughly 43% of the valued nutrient content.
Ground Truth: Nobody should switch to a multi-nutrient sulfate mineral because sulfur is expensive. They should switch because a soil test says they need sulfur and magnesium, and then discover that the price of doing so has become much more defensible than it was. The practical instruction is narrower than the market story: pull the sulfur and magnesium numbers on this fall's soil tests before pricing potash, because for the first time in this category's history those two lines can change which potassium product is cheapest. And note the direction of the risk — the Q4 Tampa settlement is unprinted, the supply response is a decade out, and the producer has already guided the premium higher.
References
- Intrepid Potash, Inc., first quarter 2026 results, May 6, 2026 (potash and Trio volumes, production, average net realized sales prices, gross margin, COGS per ton). https://www.morningstar.com/news/business-wire/20260506835357/intrepid-announces-first-quarter-2026-results
- Investing.com, "Earnings call transcript: Intrepid Potash Q1 2026 earnings beat forecasts," May 2026 (management commentary on sulfate value and raw sulfur supply; Q2 Trio volume and price guidance). https://ca.investing.com/news/stock-market-news/earnings-call-transcript-intrepid-potash-q1-2026-earnings-beat-forecasts-93CH-4620213
- Intrepid Potash, Trio product specifications (K₂O, S and Mg analyses; OMRI listing). https://www.intrepidpotash.com/trio/
- Argus Media, "Tampa 3Q liquid sulphur price hits record $705/lt," Jul 13, 2026. https://www.argusmedia.com/en/news-and-insights/latest-market-news/2851577-tampa-3q-liquid-sulphur-price-hits-record-705-lt
- Argus Media, "Viewpoint: Sulfur costs to support amsul prices in 2026," Dec 30, 2025 (year-over-year sulfur cost step used in the sulfur value estimate). https://www.argusmedia.com/en/news-and-insights/latest-market-news/2770651-viewpoint-sulfur-costs-to-support-amsul-prices-in-2026
- Trading Economics / SunSirs, sulfur price series, accessed Jul 31, 2026. https://tradingeconomics.com/commodity/sulfur
- DTN/Progressive Farmer, "Fertilizer Prices Keep Sliding as UAN32 Leads 4 Nutrients in Significant Drops," Jul 29, 2026 (retail potash price used for the K₂O reference). https://www.dtnpf.com/agriculture/web/ag/crops/article/2026/07/29/fertilizer-prices-keep-sliding-uan32
- Mitsubishi Corporation, "Participation in Anglo American's Woodsmith Fertiliser Resource Project in the UK," Feb 20, 2026. https://www.mitsubishicorp.com/jp/en/news/release/2026/20260220001.html
- Anglo American, polyhalite and Woodsmith project information; POLY4 product description. https://www.angloamerican.com/products/crop-nutrients and https://www.poly4.com/what-is-polyhalite
Disclosures
Crop Root Zone is an independent publication. Nothing here is investment advice. Market calls, where included, reflect the editors' own read and are not a recommendation to buy or sell any security.
Discussion
One question for this issue, and it comes from a reader: have you ever managed to lock in an input price the way you lock in a crop price — and what did it actually cost you? We mean anything that behaved like a hedge rather than a purchase: a prepay you priced against the board, a basis arrangement with a retailer, a supplier collar, a split-tonnage commitment. Tell us the instrument, the season, and whether it paid.
Corrections are welcome and get printed. The sharpest replies get answered in next week's Letters & Responses.