Issue 03 · 2026-08-03
Last week both blades of the margin moved the grower's way at once, and we said the input half of that window would close first. It was the crop half. December corn gave back 23¾ cents and the soybean board 66 cents in the five sessions to July 31, on a rain forecast rather than a balance sheet, though both still finished the month higher (Brownfield Ag News, Jul 31, 2026). Retail nitrogen, meanwhile, nearly stopped falling — anhydrous slipped $5 after slipping $65 the week before (DTN, Jul 29, 2026).
That reordering is the thread running through this issue, and it goes deeper than one week's tape. Most of what follows is about a cost that has not yet arrived in a posted price. Ammonium sulfate's feedstock stack rose about $62 a ton while its Corn Belt offers rose $20 to $50. Diesel ran up 73 cents in three weeks and appears in no retail fertilizer survey. Pumping and drying bills get committed in the field, on a gauge reading, long before anyone budgets them.
Which is why we keep returning to the denominator. Priced in bushels rather than dollars, a standard N-P-K program already costs more than it did a year ago, and this week's corn break made that worse, not better. Cheaper nitrogen and a better margin are not the same thing.
— Crop Root Zone, Editorial Desk
Letters & Responses
Issue 02 drew one reply and no comments on the post. The reply was a general note — that the volume of material was useful and that suppliers, agronomists and growers would want it — with no question, correction or challenge in it. We are not going to manufacture a mailbag out of that, so this week's column is short.
One item from Issue 01 is still outstanding, and we would rather carry it forward in public than let it disappear. A reader asked us to enlarge the small line set under the masthead. That line is drawn by the cover and issue templates rather than typed each week, so it changes when the templates change, and they have not changed yet. It remains on the list.
What we would most like this week is pushback on a number. Several pieces in this issue turn on figures we calculated rather than looked up — ammonium sulfate's $62/ton feedstock step, the $0.90 to $2.25 per ton of freight that the retail surveys do not capture, the $32.07 per thousand gallons of plant-available nutrient in liquid dairy digestate. Each is built from published inputs and each is shown with its arithmetic so it can be checked. If one of them does not match what you are actually being quoted or actually spreading, that gap is more useful to us than agreement.
Have a question, correction, or pushback on something we ran? Reply to this email or comment on the post — we read everything and answer the ones that sharpen the next issue.
In This Issue
This week's features, by department.
- Ammonium Sulfate's Cost Stack Rose $62 a Ton. Its Price Rose $20 to $50.Sulfur and ammonia both repriced upward against 21-0-0-24S, but published Corn Belt offers moved less than half as much — meaning the pass-through is unfinished, not absorbed.
- The Nitrogen Slide Lost 92% of Its Speed in One WeekAnhydrous fell $5 after falling $65, and three of eight nutrients printed higher. The −11% month-over-month headline decays to roughly zero within four weeks at completely unchanged prices — which changes when you buy fall N, not whether.
- UAN32 Is Now Cheaper Than Urea Per Pound of N — and 17% Cheaper Than UAN28, Which Is the Same ChemistryUAN32 is the only one of eight nutrients below its year-ago level. The liquid premium over urea has flipped to a discount, and the spread between the two UAN grades has opened to $0.13/lb N for a difference that is entirely water.
- Nitrogen's Floor Is a Gas Price — and the Two Gas Prices That Set It Are 5.8x ApartUS ammonia's feedstock cost runs about $111/ton at EIA's Q3 Henry Hub forecast; Europe's runs about $640/ton at the current TTF. That gap is why retail nitrogen has fallen six straight weeks and still won't fall much further.
- USDA's $500 Million Fertilizer Program Buys Two-Thirds of One Ammonia TrainFIELDS caps awards at $150 million and requires a 50% private match, so no single project can exceed roughly $300 million — a quarter of what one 1.1-million-tonne ammonia train costs. And the nutrient with a 95% import gap is the one $500 million cannot touch.
- Priced in Bushels, Anhydrous Is the Only Nutrient That Got More Expensive This YearCorn is up 14.7% and fertilizer has fallen six weeks, yet a standard N-P-K program costs 42.0 bushels an acre against 40.8 a year ago. Seven of eight nutrients got cheaper in bushels. The one everyone calls the cheapest nitrogen in the country did not.
- The Wheat You Seed in September Is a Soybean Decision — and Beans Just Hit a Two-Year HighPurdue puts wheat/double-crop beans at $216/acre contribution margin against $116 for continuous corn. The system's fertility bill is 11% smaller than corn's but weighted to phosphate and potash — the two nutrients that just turned higher.
- Beans Made a Contract High on a Purchase Agreement, Not a Balance SheetNovember soybeans hit a contract high at $12.43¾ on Chinese buying that exists because of a government-to-government commitment. We separate the part of that price a grower can bank from the part that is counterparty risk, and price the rotation both ways.
- Corn Lost Four Points in the Week That Sets the Yield — and the Market Had Already Paid for ItCorn conditions fell to 63% good-to-excellent, ten points below last year, while December corn rallied 13.5% in a month. A bushel now buys 7.7 pounds of nitrogen, up from 6.1 in June — but still less than the 8.3 it bought a year ago.
- Corn's Biggest Customer Can't Say No: What a $0.54 Rally Does to a Feedlot That's Already UnderwaterCattle on feed is up 2% and June marketings were the lowest for the month since 1996. Feedlot breakevens now exceed $250/cwt against a record $246.91 fed steer — so the corn rally lands on equity, not on demand, and the corn market loses its usual shock absorber going into August.
- Diesel Went Up 73 Cents in Three Weeks. Your Delivered Fertilizer Price Hasn't Caught Up Yet.On-highway diesel ran $4.58 to $5.31 between July 6 and July 27 while wholesale nutrient prices fell — so the delivered ton and the quoted ton are now moving in opposite directions, and only one of them appears in the retail survey.
- The July Diesel Spike Added $21 an Acre to a Rice Flood — and Nobody Sent a BillPumping cost is pure fuel cost, so it moves the day diesel moves. At $5.31 diesel a well-irrigated rice acre now costs $188 to water, and the last three inches of that flood cost $23 — which is the number that should decide whether they go on.
- Your Trade-In Is Appreciating and Your Replacement Is Tariffed. The Fleet Math Just Inverted.Auction values rose 12.5% in Q1 while Deere guides North American ag equipment down another 15–20% and carries a projected $1.2 billion tariff bill. We show why the trade differential — not the list price — is now the number that decides whether an application rig stays another season.
- The Drying Bill Nobody Budgets: In a Wet Fall It Costs More Than the Nitrogen DidAt the Midwest's last posted propane price, taking 200 bu/acre corn from 25% to 15% moisture runs about $98/acre — against a $106/acre anhydrous bill for the same crop. Propane stocks are 29% above the five-year average, which is the one thing working in a grower's favor.
- Phosphorus Enhancers Have 503 Field Trials Behind Them. Only 116 Were Run Where They Could Work.The published meta-analysis says +2.1% yield across everything and +4.6% where a response was plausible — and the peer-reviewed rebuttal in the same journal says that framing is exactly backwards. With DAP at $913, the difference decides whether the product pencils.
- Digestate Is Worth $32 per Thousand Gallons. That Sets the Hauling Ceiling at 3.2 Cents.The renewable-gas buildout is producing a nutrient stream as a byproduct, and priced at current N-P-K it splits into near-equal thirds — but the economics are decided entirely by distance, not by the nutrients.
- EPA Traded a 272-Page PFAS Assessment for Nine Pages of Guidance. It Did Not Make Biosolids Safer to Accept.A dry ton of biosolids is worth about $62 in replacement nutrients at July retail, and $80/acre at a phosphorus-based rate. The federal risk question got softer on July 2; the state law, the buyer contract and the land's resale value did not move at all.
- The Cheapest Sulfur in America Is a Coal Byproduct, and Its Supply Is Now a Policy VariableDelivered-and-spread gypsum carries sulfur at roughly $0.11/lb against $0.31/lb for elemental sulfur at the record Tampa contract. The catch is that you cannot buy the sulfur without the tonnage — and the tonnage comes off a coal fleet retiring 6.4 GW this year.
State of the Industry
The margin window we flagged last week closed from the crop side, not the input side, and it closed fast. December corn lost 23¾ cents over the five sessions to July 31 and the soybean board lost 66, on widespread Midwest rain in the forecast rather than on any change to the balance sheet; both contracts still finished July higher (Brownfield Ag News, Jul 31, 2026). Retail nitrogen barely moved in the same stretch. A grower who spent last week admiring a better corn price and waiting for one more leg down in fertilizer got neither.
| Benchmark | Level | Move | Basis |
|---|---|---|---|
| Urea, retail | $683/st | −5% MoM, +6% YoY | Delivered to farm, Jul 20-24 |
| Anhydrous, retail | $962/st | −11% MoM, +26% YoY | Delivered to farm, Jul 20-24 |
| UAN32, retail | $461/st | −14% MoM, −7% YoY | Delivered to farm, Jul 20-24 |
| UAN28, retail | $473/st | −6% MoM, +13% YoY | Delivered to farm, Jul 20-24 |
| DAP, retail | $913/st | +0.1% MoM, +13% YoY | Delivered to farm, Jul 20-24 |
| MAP, retail | $958/st | +1% MoM, +9% YoY | Delivered to farm, Jul 20-24 |
| Potash, retail | $494/st | +2% MoM, +2% YoY | Delivered to farm, Jul 20-24 |
| 10-34-0, retail | $718/st | −1% MoM, +7% YoY | Delivered to farm, Jul 20-24 |
| Urea, wholesale benchmark | $420/MT | +15.9% MoM, −8.7% YoY | Benchmark quote, Jul 31 |
| Corn, Dec | $4.63/bu | −23¾¢ on the week | CBOT settle, Jul 31 |
| Soybeans, Nov | $11.88/bu | −66¢ on the week* | CBOT settle, Jul 31 |
| Wheat, Sep Chicago | $6.39¼/bu | −24¼¢ on Jul 31 | CBOT settle, Jul 31 |
Sources: DTN/Progressive Farmer, Jul 29, 2026 (survey week Jul 20-24); Trading Economics urea benchmark, Jul 31, 2026; Brownfield Ag News, Jul 31, 2026. *Weekly change as reported for the soybean board.
The upstream squeeze we warned about last week is unwinding on its own. The wholesale urea benchmark finished at $420/MT on July 31 against $451 a week earlier, and now sits 8.7% below year-ago levels even after a 15.9% month (Trading Economics, Jul 31, 2026). That matters more than the retail print. The case for hurrying a fall prepay rested on wholesale running away from retail; wholesale just stopped running. The retail decline is decelerating on its own schedule, so a buyer who waits now is trading a shrinking discount against a falling forward curve rather than racing a fill.
Phosphate and potash still refuse to participate, and the structure behind them is hardening. DAP at $913 and MAP at $958 were both flat to higher on the month and are up 13% and 9% on the year, with potash up on both (DTN, Jul 29, 2026). Behind the price, ownership is consolidating: Koch Ag & Energy Solutions agreed on July 20 to take a 50% stake in a 1.2-million-tonne phosphate unit at Jorf Lasfar, deepening a partnership with OCP that already spans two plants (Koch/OCP, Jul 20, 2026). Nothing in that chain is pointed at cheaper phosphate this fall.
Sulfur went from tight to political. India suspended sulfur exports in late July to hold supply for its own fertilizer producers, having imported 2.25 million tonnes in 2025 with roughly 84% of it from the Middle East (World Fertilizer, Jul 29, 2026; Argus, Jul 2026). For a US buyer of AMS, ATS or elemental sulfur, that removes a marginal export stream from a market already at record contract levels.
The denominator is the number to hold onto. At DTN's $0.59/lb N, a 180-pound anhydrous program costs $105.59 an acre. At Friday's $4.63 corn that is 22.8 bushels; at the prior Friday's $4.87½ it was 21.7 — the identical nitrogen, 1.1 bushels an acre dearer, on nothing the fertilizer market did. (Crop Root Zone calculation from DTN and CBOT settles.)
What to watch. Mosaic's Q2 results after the close on August 4 and its call on August 5, for what management says about fall phosphate order books rather than what the quarter earned; the August 12 WASDE, which carries the first survey-based corn and soybean production forecasts of the year; and the next DTN retail survey, for whether anhydrous's $5 week was a pause or a floor.
Verdict: nitrogen's discount is real but has stopped growing, phosphate and sulfur are going the other way, and the crop side just made every one of those bills bigger in bushels.
Weekly Briefing
Fertilizer
India approves 10 million tonnes of new urea capacity — India's cabinet cleared a plan to add roughly 10 million tonnes of domestic urea production across eight to nine new plants. Executed, that is a structural subtraction from the world's largest urea import demand, and it lands over years rather than seasons. (World Fertilizer, Jul 28, 2026)
The wholesale urea benchmark rolled over — The benchmark quote closed July at $420/MT, down from $451 a week earlier and 8.7% below year-ago levels, even after a 15.9% monthly gain. The wholesale-over-retail squeeze that dominated mid-July commentary eased in the last five sessions. (Trading Economics urea benchmark, Jul 31, 2026)
Two new production agreements in a week — GAIL and RCF signed an MoU for a gas-based fertilizer venture in Maharashtra, and ORNX reached an agreement with Morocco on an ammonia production project. Both are early-stage agreements, not sanctioned capacity. (World Fertilizer, Jul 30 and Aug 3, 2026)
Mosaic reports Tuesday — Q2 results come after the close on August 4, with the call at 11:00 a.m. ET on August 5. The number to listen for is fall phosphate order-book commentary, not the quarter. (Mosaic investor relations, Jul 15, 2026)
Crops
Rain took the weather premium back out — Corn and soybean futures fell through the week to July 31 as forecasts put 1.5 to more than 3 inches across southern Minnesota, eastern Iowa and northern Illinois. December corn finished at $4.63, down 23¾ cents on the week; the soybean board lost 66 cents; September Chicago wheat dropped 24¼ cents on Friday alone to $6.39¼. Both corn and beans still closed the month higher. (Brownfield Ag News, Jul 31, 2026)
Conditions slipped before the rain arrived — USDA rated corn 63% good-to-excellent as of July 26, down three points on the week, with soybeans also at 63%. The ratings predate the rain now in the ground. (USDA NASS Crop Progress, Jul 27, 2026)
China kept buying against the agreement — New-crop soybean sales for the week ending July 23 totaled 1,333,200 tonnes, with China at 519,000 and unknown destinations at 372,000, plus a separate 132,000-tonne flash sale to China. New-crop corn sales improved on the week, led by unknown destinations and Mexico. (USDA FAS Weekly Export Sales, Jul 30, 2026)
Home & Garden
The best lawn feeding of the year is the one nobody schedules — For cool-season grass, the fall application is worth more than the spring one: cool air slows leaf growth while roots keep working, so the nitrogen goes into roots and stored energy instead of top growth. Late August into early September is the window across most of the northern half of the country. (Iowa State University Extension, Yard and Garden)
Starter fertilizer is a phosphate purchase, and phosphate is the nutrient that did not fall — If you are overseeding this fall, the high-phosphorus starter bag is the one touching the input market that has not cooperated all summer: farm-gate DAP is up 13% year over year while nitrogen has fallen for weeks. Buy the starter, skip the weed-and-feed — extension seeding guidance is consistent that the herbicide in it kills new seedlings. (DTN, Jul 29, 2026; Rutgers NJAES FS584, Seeding Your Lawn)
Test the soil before you buy anything — A $15 to $25 extension soil test in late summer tells you whether you need the phosphorus at all, and most home lawns in long-established neighborhoods do not. Sample after harvest or before spring fertilization for the cleanest read. (Rutgers NJAES FS797, Soil Testing for Home Lawns and Gardens)
Micronutrients
India pulled sulfur off the export market — India suspended sulfur exports in late July to protect domestic fertilizer production, with no formal notice published but the restriction widely understood by traders. India imported 2.25 million tonnes of sulfur in 2025, roughly 84% of it from the Middle East, and shipped 356,900 tonnes out in January-April before halting. It is a modest export stream, but it is being removed from a market already at record contract levels. (World Fertilizer, Jul 29, 2026)
Boron moved zinc, which is not how the label reads — A recent trial on acidic soils in West Bengal found boron application raised tissue concentrations of both boron and zinc, and that balanced B-and-Zn application beat either alone for wheat productivity. Single-region, single-crop work on acid soils — read it as a reason to test for both, not as a recommendation to blanket-apply. (International Journal of Plant & Soil Science, 2026)
The micronutrient trade is having its own conference year — U.S. Borax convened a Global Micronutrient Summit in July on emerging trends in balanced fertilization, including zinc and boron. Vendor-hosted, and worth reading as a signal of where the marketing push is headed this fall. (U.S. Borax, July 2026)
Organics
Test the compost, not the label — University of Florida extension put out a reminder that compost nutrient analysis varies enough between batches and feedstocks that testing is a production practice, not a formality — particularly where a nutrient management plan has to account for what was actually applied. (UF/IFAS Extension, Jul 16, 2026)
The cost of an organic amendment is mostly the truck — Texas A&M AgriLife's working through the true delivered cost of compost and manure reaches the same conclusion the digestate arithmetic in this issue reaches independently: the nutrients are worth something, the hauling is worth more, and the break-even is a distance rather than a price. (Texas A&M AgriLife Organic, Jan 14, 2026)
A market-research number worth discounting — One published forecast puts the organic fertilizer market at $9.4 billion in 2026 growing to $15.6 billion by 2033, a 7.6% CAGR. That is a vendor-commissioned market study, not an audited figure, and we cite it as a direction rather than a level. (Market Minds, via Yahoo Finance, 2026)
Up and Coming
Everything in this section is pre-commercial. Treat capacity and cost claims as company statements, not verified performance.
On-farm electrochemical ammonia keeps raising seed money — Danish startup NitroVolt closed a €3.5 million seed round for its Nitrolyzer unit, which is designed to make ammonia on demand from intermittent renewable power at farm scale. No independent production data has been published. (Øresund Startups / ESG Today, 2026)
Nitricity raised $10 million for a California plant — The company makes nitrogen fertilizer from air, water, renewable electricity and recycled almond shells, and is building in Delhi, California with backing from Elemental Impact and Trellis Climate. This is a first-of-a-kind plant, which is the risk and the point. (AgFunderNews, 2026)
A $500/tonne green ammonia claim to keep an eye on — Faraday Earth says an AI-optimized plasma route could reach a levelized cost near $500 per tonne of ammonia. That is a company projection for a process not operating at scale, and the bar it has to clear is a conventional Gulf plant whose gas feedstock alone runs near $111 per ton at EIA's Q3 Henry Hub forecast. (AgFunderNews, 2026; EIA Short-Term Energy Outlook, Jul 2026)
Interesting
Food companies have started paying for fertilizer's carbon — Envision delivered low-carbon ammonia environmental attribute certificates to PepsiCo's Asia-Pacific business, and separately the Ammonia Energy Association launched a certification system with MiQ. The mechanism matters more than the volume: it creates a price for the nitrogen molecule's emissions that is paid by the food buyer rather than the grower. (World Fertilizer, Jul 31, 2026)
Soil bacteria fight salt by stiffening roots, not by blocking salt — Researchers found that beneficial bacteria improved plant performance on saline ground by raising root lignin content by over 30% under salt stress, rather than by reducing salt uptake as had been assumed for decades. Greenhouse and field tests showed higher yields; the mechanism finding is the news, and commercial products are not. (ScienceDaily, Jun 26, 2026)
Off the Wall Discovery
The largest untapped nitrogen source in a city is the plumbing — Source-separated human urine carries 70-80% of the nitrogen and 50-65% of the phosphorus in domestic wastewater. Precipitating it with magnesium yields struvite, a dry, odorless slow-release phosphate. Vermont's Rich Earth Institute already supplies farms with pasteurized urine-derived fertilizer, and France's Toopi Organics sells urine-derived biostimulants collected from festivals and service stations. (Frontiers in Soil Science, 2026; Willagri, Jun 1, 2026)
And the reason it is not in your spreader yet — 2026 work characterizing struvite from source-separated urine reports it performs as a slow-release P source but can carry pharmaceutical residues that alter soil biological indicators. This is an open research question, not a settled safety finding either way — which is precisely why it stays in this section and not in the phosphate column. (Frontiers in Environmental Science, 2026)
Ammonium Sulfate's Cost Stack Rose $62 a Ton. Its Price Rose $20 to $50.
Sulfur and ammonia both repriced upward against 21-0-0-24S, but published Corn Belt offers moved less than half as much — meaning the pass-through is unfinished, not absorbed.
For six weeks the ammonium sulfate story was a divergence a buyer could exploit: the sulfur leg locked at a record, the nitrogen leg in free-fall, and the net cost of a ton of 21-0-0-24S drifting sideways while everyone argued about which leg mattered. That divergence closed in the week of July 20-24. DTN's retail survey shows anhydrous ammonia fell $5 per ton after falling $65 the week before — a 92% deceleration in seven days — while phosphate and potash printed higher (DTN/Progressive Farmer, Jul 29, 2026). The nitrogen tailwind under the AMS cost stack is over. The sulfur leg was never going to move: the third-quarter Tampa molten contract settled at a record $705 per long ton on July 13 and is fixed through September 30 (Argus Media, Jul 13, 2026). Both legs are now firm at the same time for the first time since early June, and a piece of Argus data that has been sitting in public since December finally makes it possible to say how much of that has actually reached the price.
1. What the feedstock step actually was
What's new: Argus quantified the year-over-year input inflation behind ammonium sulfate in a December 2025 outlook piece — roughly +$194 per long ton on sulfur, delivered, and +$90 per tonne CFR on ammonia (Argus Media, "Viewpoint: Sulfur costs to support amsul prices in 2026," Dec 30, 2025). Those are input numbers, not product numbers. Converting them into the product is arithmetic, and nobody appears to have published the result.
Evidence: A short ton of 21-0-0-24S carries 420 lb of nitrogen and 480 lb of sulfur. Apply each feedstock step to the nutrient it feeds:
| Leg | Feedstock step (YoY) | Per lb of nutrient | Nutrient in 1 st of AMS | Cost step per st of product |
|---|---|---|---|---|
| Sulfur | +$194/lt delivered | +$0.0866/lb S | 480 lb S | +$41.57 |
| Ammonia | +$90/t CFR | +$0.0497/lb N | 420 lb N | +$20.86 |
| Combined | +$62.43 |
Source: feedstock steps from Argus Media, Dec 30, 2025. Nutrient conversion and per-short-ton arithmetic are Crop Root Zone's own; the result is a feedstock-equivalent calculation, not a producer cost accounting.
That last caveat matters and we will not bury it. Much of the world's ammonium sulfate is a caprolactam by-product rather than a purpose-built reaction of ammonia and sulfuric acid, and a by-product stream does not pay spot feedstock prices. The $62.43 is not what any specific producer's cost went up. It is what the market-clearing input cost of synthesizing the product went up — the number a merchant producer's replacement economics moved by, and the yardstick a by-product producer's pricing power gets measured against.
Against that, here is what the finished product did.
2. The gap between the inputs and the offers
What's new: The same Argus piece reports US Corn Belt amsul offers running $20-25/st above the prior year, with some producers quoting $40-50/st above prior-year fourth-quarter levels. Both figures sit below the $62.43 feedstock-equivalent step. One of them sits at roughly a third of it.
Evidence:
| Measure | $/st of AMS | Share of input step | |
|---|---|---|---|
| Feedstock-equivalent input step | 62.43 | ██████████ |
100% |
| Offers, upper end (vs prior-yr Q4) | 45.00* | ███████ |
72% |
| Offers, typical (vs prior year) | 22.50* | ████ |
36% |
Source: input step derived from Argus Media, Dec 30, 2025 feedstock figures (Crop Root Zone calculation); offer levels reported in the same article. *Offer figures are midpoints of the $20-25/st and $40-50/st ranges Argus reports; bars scaled to the input step.
$62 in, $23 out
The typical reported Corn Belt offer step recovered about 36% of the feedstock-equivalent cost increase behind the product. The rest was absorbed. (Crop Root Zone calculation from Argus Media feedstock and offer data, Dec 30, 2025)
Ground Truth: A market that has passed through only a third of its input inflation has not finished repricing — it has postponed. Absorbed cost is not vanished cost; it is margin a producer will try to recover on the next contract round, and every quarter sulfur settles higher makes that attempt more credible. The buyer's read is the inverse of the obvious one: the fact that AMS hasn't risen as much as its inputs is bearish for future AMS prices only if you believe producers will keep eating the difference. There is nothing in these numbers that says they will.
Market read: MOS — Hold. Mosaic is one of North America's largest sulfur consumers through phosphoric acid production, and DAP at $913/ton (+13% YoY) has so far outrun the sulfur cost step; the risk is a fourth-quarter Tampa settlement that closes that gap before phosphate can re-rate again.
3. Why the December forecast is a floor, not a stale number
What's new: The Argus outlook built its bullish amsul call on a specific sulfur assumption — that the first-quarter 2026 Tampa molten contract would settle at $475-520/lt, against roughly $310/lt at the time of writing. Checking that assumption against what actually happened changes how the offer data should be read.
Evidence:
| Quarter | Tampa molten, $/lt | Δ vs prior | ||
|---|---|---|---|---|
| Early 2024 | 69 | — | █ |
|
| Mid 2025 | ~270 | +$201 | ████ |
|
| Q1 2026 | 495.69 | +$226 | ███████ |
inside the projected range |
| Q2 2026 | 655.00 | +$159 | █████████ |
past it |
| Q3 2026 | 705.00 | +$50 | ██████████ |
record |
| Q4 2026 | unsettled | — | the open question |
Source: Argus Media, Jul 13, 2026 (Q3 settlement) and prior quarterly settlements; Q1 2026 projection from Argus Media, Dec 30, 2025.
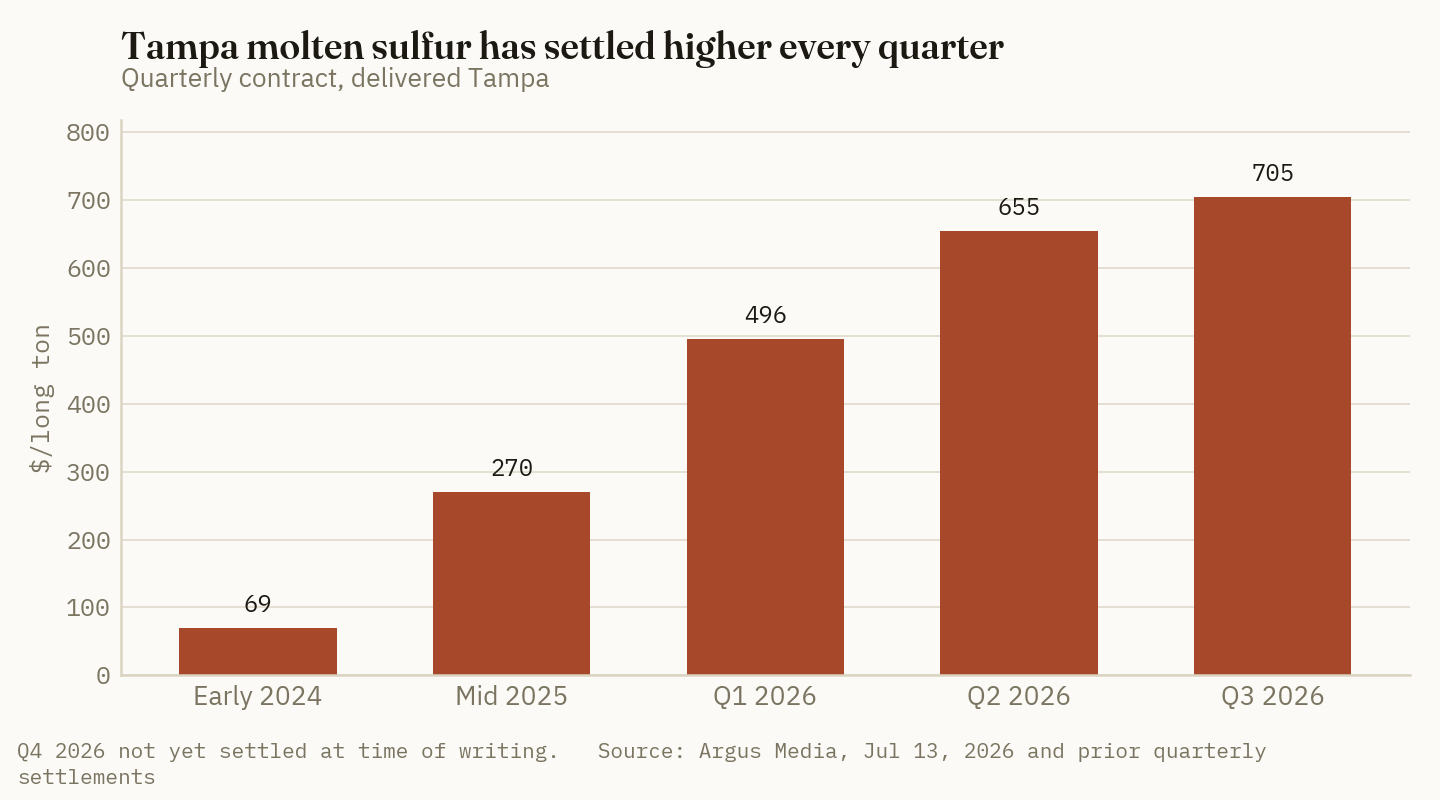
The projection was not wrong in the way forecasts are usually wrong. Q1 came in at $495.69 — inside the $475-520 window. Then Q2 went to $655 and Q3 to $705, roughly 36% above the top of the assumption the amsul call was built on. A forecast whose bullish case has been beaten to the upside by its own key input is not a stale number to be discounted. It is a conservative one.
That reframes the $20-50/st offer step entirely. It was the pass-through consistent with sulfur at $475-520/lt. Sulfur went to $705.
4. The nitrogen leg has stopped doing the buyer's work
What's new: The other half of the AMS cost stack has been falling all summer, and it just about stopped.
Evidence: DTN's retail survey for the week of July 20-24, published July 29, against the prior week:
| Nutrient | $/ton | w/w $ | MoM | YoY | $/lb N |
|---|---|---|---|---|---|
| DAP | 913 | +2 | +1% | +13% | — |
| MAP | 958 | 0 | +1% | +9% | — |
| Potash | 494 | 0 | +2% | +2% | — |
| Urea | 683 | +1 | −5% | +6% | 0.74 |
| 10-34-0 | 718 | — | −1% | +7% | — |
| Anhydrous | 962 | −5 | −11% | +26% | 0.59 |
| UAN28 | 473 | −7 | −6% | +13% | 0.85 |
| UAN32 | 461 | −4 | −14% | −7% | 0.72 |
Source: DTN/Progressive Farmer Retail Fertilizer Trends, Jul 29, 2026 (week of Jul 20-24) and Jul 22, 2026 (week of Jul 13-17).
Read the week-over-week column, not the month-over-month column. The MoM figures are a trailing four-week window and they still look violent — anhydrous −11%, UAN32 −14%. The actual week was nearly flat, and two products printed higher. Anhydrous fell $5 after falling $65. Seven of the eight now sit above year-ago levels, with UAN32 the lone exception.
Ground Truth: The AMS buyer who has been waiting has been waiting on the wrong leg. Every week nitrogen fell, the implied nitrogen value inside a ton of 21-0-0-24S fell with it, and waiting looked smart. That mechanism is spent — anhydrous at $0.59/lb N is the cheapest nitrogen in the country and it has stopped moving. From here, the only leg with any capacity to move the delivered cost of a sulfur-bearing nitrogen product is the sulfur leg, and that leg is contractually fixed at a record through September 30 and unsettled for the quarter after.
5. What resolves this, and what does not
What's new: There is exactly one number that re-rates this product, and it has not printed.
Evidence: The fourth-quarter Tampa molten sulfur settlement. Argus has carried an item indicating the price rises for 4Q, but no public absolute has appeared. Meanwhile the Chinese sulfur spot series — the sulfur signal most widely quoted, because it updates daily and is free — fell 4.5% on July 27, fell another 1.1% on July 28, then recovered 0.93% and 1.10% and finished flat at 9,185.67 CNY/T on July 31, a net −3.67% from its July 24 high.
| Session | CNY/T | Δ |
|---|---|---|
| Jul 24 | 9,535.67 | +0.18% |
| Jul 27 | 9,102.33 | −4.54% |
| Jul 28 | 9,002.33 | −1.10% |
| Jul 29 | 9,085.67 | +0.93% |
| Jul 30 | 9,185.67 | +1.10% |
| Jul 31 | 9,185.67 | 0.00% |
Source: Trading Economics/SunSirs sulfur series, accessed Jul 31, 2026.
A five-session round trip that ended 3.7% below where it started, with the decline decaying and the recovery stalling. Anyone who marked a sulfur-bearing fertilizer position down on Monday's 4.5% would have needed to mark it back up Wednesday and Thursday and flat on Friday — three revisions to arrive exactly where they began.
Ground Truth: Daily Chinese spot is not the sulfur price that sets a US sulfur fertilizer bill, and this week demonstrated it at some cost to anyone who thought otherwise. The Tampa quarterly contract is that price. It is settled through September 30 at $705, it is unsettled for the fourth quarter, and until that number prints the honest position on AMS is that its cost floor is firm on both legs while its published price has recovered roughly a third of its input inflation. Those two facts point the same direction, and it is not down.
For a fall sulfur buyer the practical consequence is narrow but real. The case for waiting rested on nitrogen continuing to fall; it isn't. The case for a fourth-quarter break rests on the Tampa settlement coming in soft against a contract that has risen in every quarter for two years. Neither is a strong hand. Covering fall sulfur needs at current offers is not a call that the price is going up — it is a recognition that the mechanism which was making it go down has been switched off.
References
- Argus Media, "Viewpoint: Sulfur costs to support amsul prices in 2026," Dec 30, 2025. https://www.argusmedia.com/en/news-and-insights/latest-market-news/2770651-viewpoint-sulfur-costs-to-support-amsul-prices-in-2026
- Argus Media, "Tampa 3Q liquid sulphur price hits record $705/lt," Jul 13, 2026. https://www.argusmedia.com/en/news-and-insights/latest-market-news/2851577-tampa-3q-liquid-sulphur-price-hits-record-705-lt
- DTN/Progressive Farmer, "Fertilizer Prices Keep Sliding as UAN32 Leads 4 Nutrients in Significant Drops," Jul 29, 2026 (week of Jul 20-24). https://www.dtnpf.com/agriculture/web/ag/crops/article/2026/07/29/fertilizer-prices-keep-sliding-uan32
- DTN/Progressive Farmer, "Fertilizer Prices Continue Downward Trend," Jul 22, 2026 (week of Jul 13-17). https://www.dtnpf.com/agriculture/web/ag/crops/article/2026/07/22/fertilizer-prices-continue-downward
- Trading Economics / SunSirs, sulfur price series, accessed Jul 31, 2026. https://tradingeconomics.com/commodity/sulfur
- Argus Media, "Tampa molten sulphur price rises for 4Q" (carries no public absolute at time of writing). https://www.argusmedia.com/en/news-and-insights/latest-market-news/2614283-tampa-molten-sulphur-price-rises-for-4q
Disclosures
Crop Root Zone is an independent publication. Nothing here is investment advice. Market calls, where included, reflect the editors' own read and are not a recommendation to buy or sell any security.
The Nitrogen Slide Lost 92% of Its Speed in One Week
Anhydrous fell $5 after falling $65, and three of eight nutrients printed higher. The −11% month-over-month headline decays to roughly zero within four weeks at completely unchanged prices — which changes when you buy fall N, not whether.
Retail anhydrous ammonia averaged $962/ton in the week of July 20–24, down $5 from the week before (DTN/Progressive Farmer, Jul 29, 2026). The week before that it fell $65. Three of the eight nutrients DTN tracks printed higher on the week, two were unchanged, and the three that fell gave up a combined $16/ton between them. The headline on the report still reads like a rout — UAN32 −14% month-over-month, anhydrous −11% — because those are trailing four-week comparisons and the big weeks are still inside the window. They will not be inside it for long.
1. Read the week, not the month
What's new: The nitrogen down-leg that has run since mid-June decelerated to near-zero in the week of July 20–24.
Evidence: Placing the two most recent DTN surveys side by side is the whole story.
| Nutrient | $/ton, Jul 20–24 | $/ton, Jul 13–17 | w/w $ | MoM | YoY |
|---|---|---|---|---|---|
| DAP | 913 | 911 | +2 | +1% | +13% |
| MAP | 958 | 958 | 0 | +1% | +9% |
| Potash | 494 | 494 | 0 | +2% | +2% |
| Urea | 683 | 682 | +1 | −5% | +6% |
| 10-34-0 | 718 | — | — | −1% | +7% |
| Anhydrous | 962 | 967 | −5 | −11% | +26% |
| UAN28 | 473 | 480 | −7 | −6% | +13% |
| UAN32 | 461 | 465 | −4 | −14% | −7% |
Source: DTN/Progressive Farmer Retail Fertilizer Trends, Jul 29, 2026 (week of Jul 20–24) and Jul 22, 2026 (week of Jul 13–17). Basis: delivered-to-farm retail, national average.
Scaled by absolute dollar move, the week looks less like a slide than like a market that has stopped.
| Nutrient | w/w move ($/ton) | ||
|---|---|---|---|
| UAN28 | −7 | ██████████ |
down |
| Anhydrous | −5 | ███████ |
down |
| UAN32 | −4 | ██████ |
down |
| MAP | 0 | flat | |
| Potash | 0 | flat | |
| Urea | +1 | █ |
up |
| DAP | +2 | ███ |
up |
Source: DTN/Progressive Farmer, Jul 22 and Jul 29, 2026. Bars scaled to absolute move; the longest bar is $7.
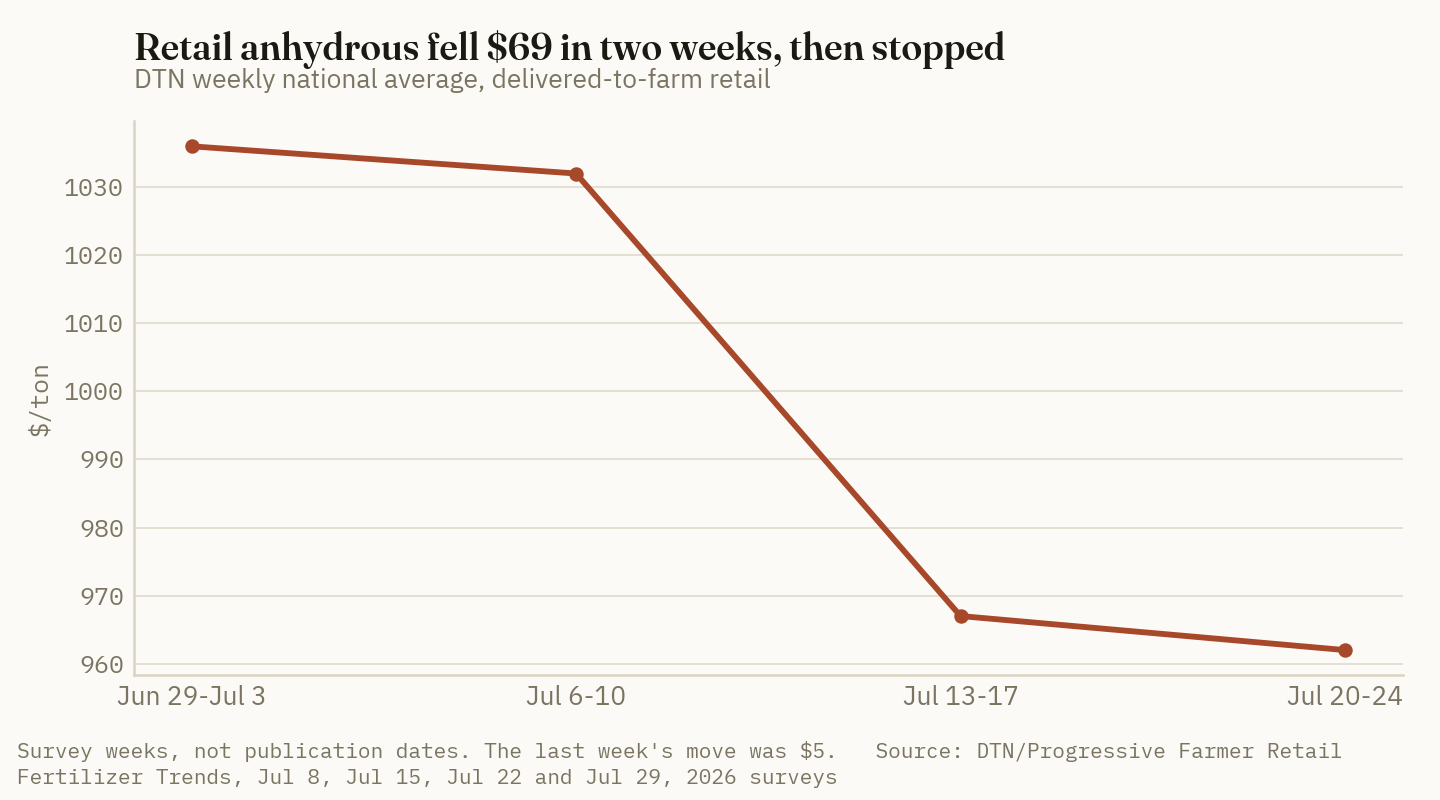
The anhydrous line carries the point on its own. Across four consecutive DTN surveys it has run $1,036 → $1,032 → $967 → $962.
−$5
Anhydrous ammonia's week-on-week move in DTN's July 29 survey, after −$65 the week prior — a 92% deceleration in the rate of decline in a single week. (DTN/Progressive Farmer, Jul 22 and Jul 29, 2026)
Ground Truth: A down-leg that decays from −$65 to −$5 in one week has not paused; it has arrived. Retail spent six weeks catching down to a wholesale reset that happened in the spring, and at $962 the catch-down is substantially complete. The open question is no longer how much further retail nitrogen falls. It is whether $962 holds through the fall application window — and that is a question about ammonia logistics and fall demand, not about lag.
2. The month-over-month column collapses on its own arithmetic
What's new: The −11% and −14% MoM prints that dominate the headlines are rolling-window artifacts with a knowable expiry date.
Evidence: DTN's month-over-month figure compares the current survey week against the survey four weeks earlier. That base is currently the pre-collapse price. Hold anhydrous perfectly flat at $962, let the window roll, and the printed MoM change decays like this:
| Survey week (price held flat at $962) | Comparison base $/ton | Implied MoM print |
|---|---|---|
| Jul 20–24 (actual) | ~1,081* | −11% |
| +1 week | 1,036 | −7.1%* |
| +2 weeks | 1,032 | −6.8%* |
| +3 weeks | 967 | −0.5%* |
| +4 weeks | 962 | 0.0%* |
Values marked * are Crop Root Zone calculations from the published DTN weekly averages (Jul 8,
Jul 15, Jul 22 and Jul 29, 2026 surveys); the Jul 20–24 base is implied from DTN's own −11%
figure. This is an arithmetic illustration of the rolling window, not a price forecast.
Four weeks from now, at a completely unchanged price, the report prints roughly zero. Two of those four weeks are already banked. Anyone waiting for the MoM column to stop being negative before buying is waiting on a lagging indicator to catch up to a market that has already moved.
The same mechanic runs under UAN32's −14%. UAN32 fell $4 last week. What distinguishes it from anhydrous is not its rate of change but its level: at −7% year-over-year it is the only one of the eight below where it sat a year ago.
Ground Truth: Treat the MoM column as a description of the last month, never of the current market. In a decelerating market it overstates the decline by exactly the weight of the old weeks still trapped in the window — which right now is most of it. The week-on-week delta and the year-over-year level are the two numbers worth carrying into a buying conversation. The middle column is the one that will be quoted at you.
3. Phosphate and potash already turned, and nobody was watching
What's new: While the trade watched nitrogen fall, DAP, MAP and potash went the other way.
Evidence: DAP is $913 (+1% MoM, +13% YoY), MAP $958 (+1%, +9%), potash $494 (+2%, +2%). DAP printed $2 higher on the week. Potash's +2% year-over-year is a firmer annual comparison than the flat-to-slightly-lower readings that characterized the series through midsummer.
Seven of the eight nutrients DTN tracks now cost more than they did a year ago. The lone exception is UAN32.
| Nutrient | YoY | ||
|---|---|---|---|
| Anhydrous | +26% | ██████████ |
|
| UAN28 | +13% | █████ |
|
| DAP | +13% | █████ |
|
| MAP | +9% | ███ |
|
| 10-34-0 | +7% | ███ |
|
| Urea | +6% | ██ |
|
| Potash | +2% | █ |
|
| UAN32 | −7% | only nutrient below year-ago |
Source: DTN/Progressive Farmer, Jul 29, 2026. Bars scaled to the largest positive value (+26%).
That table is the one to take into a 2027 budget meeting. "Fertilizer prices are falling" has been true for six weeks and is, at the level that actually sets a crop budget, a one-nutrient statement dressed up as a market condition.
Ground Truth: The nitrogen story and the fertility-bill story have decoupled. A grower running an anhydrous-heavy program has been handed real relief since mid-June. A grower on high-testing ground running a phosphate-heavy program has been handed nothing, and the P and K lines are now moving against them. When fall quotes arrive, the spread between those two experiences will be wider than any headline suggests, and it will show up as a per-acre number, not a per-ton one.
Market read: CF Industries (CF, NYSE) — Hold. The end of the retail down-leg removes the buyer-deferral drag on the fall book, but CF realizes wholesale, and wholesale reset months before retail did. A retail floor forming now is confirmation of a move already in the price, not new upside.
4. What it does to the fall prepay decision
What's new: For six weeks, waiting was the trade. It no longer is — and that is an argument about timing, not about volume.
Evidence: The decision has four moving parts. Only two of them have changed.
| Input to the decision | Six weeks ago | Now |
|---|---|---|
| Direction of retail N | Falling $30–65/wk | Falling $5/wk |
| Anhydrous vs. other N forms | Cheapest per lb N | Still cheapest, $0.59/lb N |
| P and K | Flat to slightly lower | +1% to +2% MoM, both higher |
| Payoff to waiting | Large and reliable | Inside the noise |
Source: DTN/Progressive Farmer, Jul 8 through Jul 29, 2026 surveys.
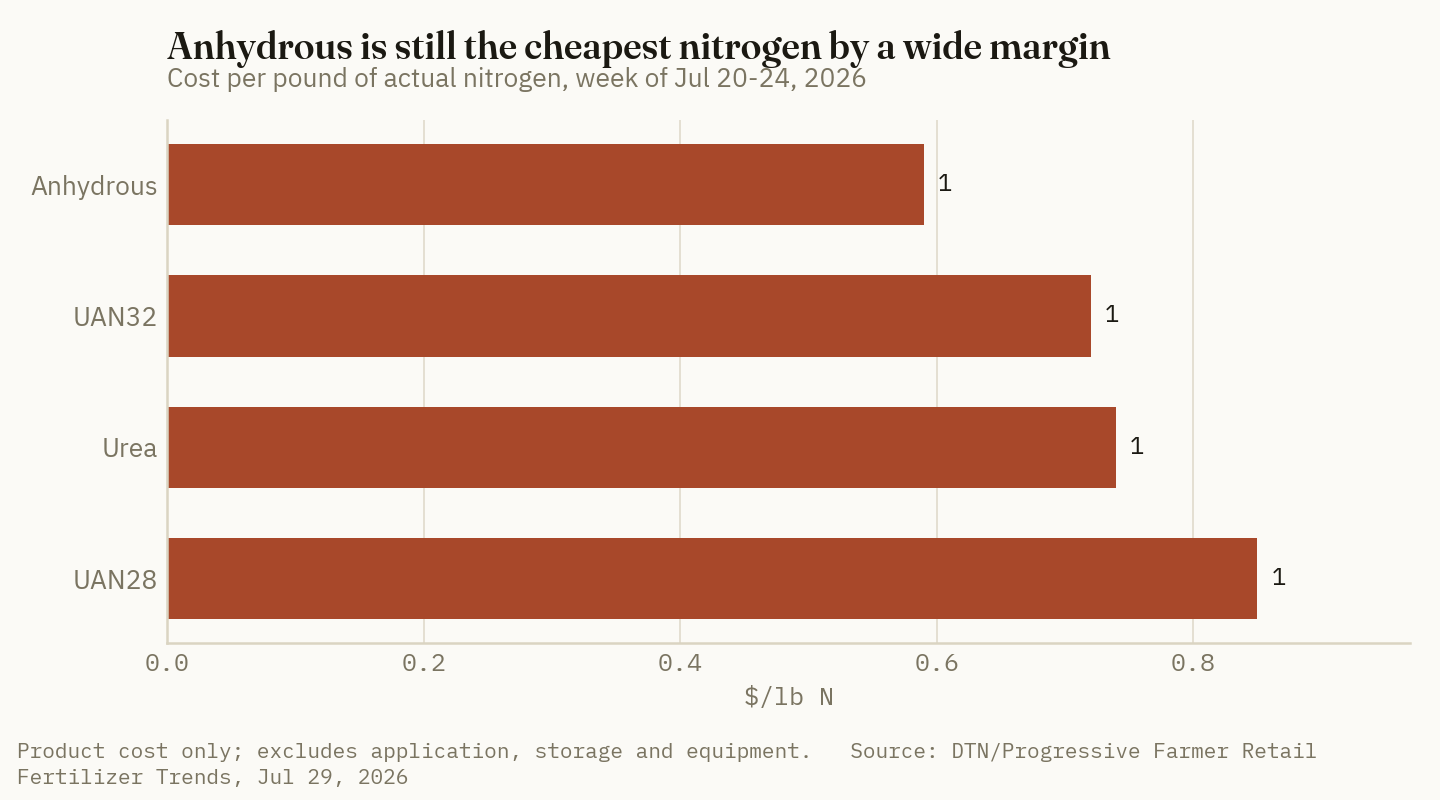
Anhydrous remains the cheapest nitrogen in the country at $0.59 per pound of N, against UAN32 at $0.72, urea at $0.74 and UAN28 at $0.85 (DTN, Jul 29, 2026). That ranking has not moved and is not the variable here.
What moved is the payoff to patience. When the market was giving up $65/ton a week, a week of delay on a 180 bu corn nitrogen program — roughly 0.11 tons of anhydrous per acre — was worth about $7/acre for doing nothing. At $5/ton a week the same delay is worth about $0.55/acre, which is inside the noise of a single delivery charge or a fill-rate discount.
| Weekly price move | Value of a one-week delay, per acre* |
|---|---|
| −$65/ton | −$7.14 |
| −$30/ton | −$3.30 |
| −$5/ton | −$0.55 |
| $0/ton | $0.00 |
| +$10/ton | +$1.10 |
*Crop Root Zone calculation: 180 bu/acre corn at 1.0 lb N/bu, applied as anhydrous ammonia (82% N) = 0.110 tons of product per acre. Price moves per DTN, Jul 8–Jul 29, 2026 surveys.
The mirror risk is now the live one. Fall ammonia is a logistics-constrained product: tank capacity, applicator availability and terminal supply decide who actually gets tons inside a narrow autumn window, and none of those care what the price series did in July.
Ground Truth: The prepay conversation should shift from price to position. Remaining downside in retail anhydrous is plausibly a handful of dollars a ton. The downside of being unpositioned in a compressed fall application window is a forced switch to a more expensive nitrogen form, or a spring-applied program nobody budgeted — both of which are order-of-magnitude larger numbers. Lock the tons and the application slot; argue about the last $10 afterward. That is the opposite of the advice that was right in June, and it changed because the price series changed, not because the agronomy did.
5. What decides whether $962 is a floor or a landing
Three things.
- The next two DTN surveys. A flat or higher anhydrous print in either says the floor is in, and the arithmetic in section 2 does the rest. A return to $20+ weekly declines would say the catch-down was not finished after all.
- Fall ammonia supply into the river system. Retail nitrogen's floor has been argued from replacement cost all summer. The tons that actually reach Corn Belt terminals in September–October are what test it.
- Whether the phosphate and potash turn holds. Two more higher prints in DAP and potash turn a curiosity into the season's real cost story — and it would land hardest on exactly the growers who got least out of the nitrogen decline.
The crop side is doing its part. Nearby corn futures traded at 451.7 cents/bu on July 30, up 7.3% on the month and 14.7% on the year (Trading Economics, Jul 30, 2026), against a crop USDA rated 63% good-to-excellent as of July 26, three points lower on the week (USDA NASS via DTN, Jul 27, 2026). Grain up and inputs flat is a better combination than this market has offered at any point in 2026. It is also the combination that historically ends fertilizer down-legs.
References
- DTN/Progressive Farmer, "Fertilizer Prices Keep Sliding as UAN32 Leads 4 Nutrients in Significant Drops," Jul 29, 2026 — https://www.dtnpf.com/agriculture/web/ag/crops/article/2026/07/29/fertilizer-prices-keep-sliding-uan32
- DTN/Progressive Farmer, "Fertilizer Prices Continue Downward Trend," Jul 22, 2026 — https://www.dtnpf.com/agriculture/web/ag/crops/article/2026/07/22/fertilizer-prices-continue-downward
- DTN/Progressive Farmer, "UAN Fertilizers Lead Nutrient Prices Downward," Jul 15, 2026 — https://www.dtnpf.com/agriculture/web/ag/crops/article/2026/07/15/uan-fertilizers-lead-nutrient-prices
- DTN/Progressive Farmer, "Six Fertilizers Lead Retail Fertilizer Prices Lower for Third Consecutive Week," Jul 8, 2026 — https://www.dtnpf.com/agriculture/web/ag/crops/article/2026/07/08/six-fertilizers-lead-retail-prices
- USDA NASS Crop Progress via DTN, "Corn Rated 63% Good to Excellent; Soybeans 63% Good to Excellent as of July 26," Jul 27, 2026 — https://www.dtnpf.com/agriculture/web/ag/news/article/2026/07/27/usda-crop-progress-corn-rated-63-63
- Trading Economics, corn futures series, accessed Jul 30, 2026 — https://tradingeconomics.com/commodity/corn
Disclosures
Crop Root Zone is an independent publication. Nothing here is investment advice. Market calls, where included, reflect the editors' own read and are not a recommendation to buy or sell any security.
UAN32 Is Now Cheaper Than Urea Per Pound of N — and 17% Cheaper Than UAN28, Which Is the Same Chemistry
UAN32 is the only one of eight nutrients below its year-ago level. The liquid premium over urea has flipped to a discount, and the spread between the two UAN grades has opened to $0.13/lb N for a difference that is entirely water.
UAN32 averaged $461/ton in the week of July 20–24, down 14% month-over-month and 7% below its level a year ago — the only one of the eight nutrients DTN tracks that is cheaper than it was in July 2025 (DTN/Progressive Farmer, Jul 29, 2026). Priced in the only unit that lets you compare a liquid to a solid, UAN32 is $0.72 per pound of nitrogen against urea's $0.74. The liquid premium that defined the UAN market through the spring has not merely compressed. It has inverted.
1. The crossover
What's new: For a second consecutive DTN survey week, UAN32 prices below urea per pound of actual nitrogen.
Evidence: The four nitrogen forms, priced in nitrogen rather than in tons.
| Form | Analysis | $/ton | lb N/ton | $/lb N | vs. anhydrous |
|---|---|---|---|---|---|
| Anhydrous ammonia | 82-0-0 | 962 | 1,640 | 0.59 | — |
| UAN32 | 32-0-0 | 461 | 640 | 0.72 | +22% |
| Urea | 46-0-0 | 683 | 920 | 0.74 | +26% |
| UAN28 | 28-0-0 | 473 | 560 | 0.85 | +44% |
Source: $/ton and $/lb N from DTN/Progressive Farmer Retail Fertilizer Trends, Jul 29, 2026 (week of Jul 20–24), delivered-to-farm retail national average. Pounds of N per ton follow from the product analysis and are arithmetic, not a price assessment.
The prior week's survey was effectively parity: UAN32 at $465/ton works out to $0.727/lb N against urea at $682/ton and $0.741/lb N (Crop Root Zone calculation from DTN, Jul 22, 2026). DTN's own rounded figures showed $0.73 and $0.74. This week the gap widened to a clean two cents.
Two cents a pound is not a rounding artifact once it is multiplied by a program. On a 180 lb N per acre corn program that is $3.60/acre, or $3,600 across 1,000 acres, for a decision that costs nothing to make if the equipment is already in the yard.
Ground Truth: The inversion matters less as a price fact than as a signal about what fell. Urea is a globally traded solid with an import-replacement floor at the Gulf. UAN32 is a freight-bound, domestically-heavy liquid whose demand stops abruptly when the sidedress window closes. The crossover is telling you that the summer nitrogen decline was disproportionately a seasonal demand event in the liquid rather than a global cost event across the complex — which is why UAN32 is the only nutrient of the eight below year-ago, and why it is the one most likely to be re-bid first when fall demand shows up.
2. The stranger number: UAN28 costs 17% more per pound of N than UAN32
What's new: The spread between the two UAN grades has opened to $0.13 per pound of nitrogen — between two products that are the same chemistry at different dilutions.
Evidence: UAN28 is $473/ton and UAN32 is $461/ton. The more dilute grade is more expensive per ton and, necessarily, far more expensive per pound of the thing actually being bought.
| Nitrogen form | $/lb N | ||
|---|---|---|---|
| UAN28 | 0.85 | ██████████ |
|
| Urea | 0.74 | █████████ |
|
| UAN32 | 0.72 | ████████ |
|
| Anhydrous | 0.59 | ███████ |
Source: DTN/Progressive Farmer, Jul 29, 2026. Bars scaled to the highest value ($0.85/lb N).
Both grades are urea-ammonium-nitrate solution. The difference is water: UAN32 carries 32% nitrogen by weight, UAN28 carries 28%, and the balance is dilution. Delivering 180 lb of N takes 563 lb of UAN32 or 643 lb of UAN28 — 80 extra pounds of product per acre, or 40 short tons of extra freight across 1,000 acres, to deliver identical nitrogen.
$0.13/lb N
The UAN28-to-UAN32 spread in DTN's July 29 survey — about $22/acre on a 180 lb N program, for a product difference that is water. (DTN/Progressive Farmer, Jul 29, 2026; per-acre figure is a Crop Root Zone calculation)
UAN28 exists anyway because of cold. UAN32 salts out at roughly 32°F; UAN28 salts out at roughly 0°F (Mississippi State University Extension, Fluid Fertilizers). In the northern Corn Belt and the Plains, holding UAN32 through a winter means heat trace, tank blankets and insulation — or crystallized urea and nitrate in the bottom of the tank come spring. UAN28 is what you buy when the tank has to sit outside.
Ground Truth: $0.13/lb N is a large number to be paying for antifreeze. At 1,000 acres and 180 lb N, the UAN28 default now costs roughly $22,000 a year, which is inside the range of what heat trace and insulation on a farm-scale liquid tank cost once. The grade choice has quietly stopped being an operational default and become a capital-budgeting question. At a $0.04 spread it was not one.
3. Why UAN32 fell hardest
What's new: UAN32's −14% month-over-month decline is the steepest in the complex, and it is the only nutrient whose level — not merely its rate of change — sits below a year ago.
Evidence: The eight nutrients, against July 2025.
| Nutrient | MoM | YoY |
|---|---|---|
| Anhydrous | −11% | +26% |
| UAN28 | −6% | +13% |
| DAP | +1% | +13% |
| MAP | +1% | +9% |
| 10-34-0 | −1% | +7% |
| Urea | −5% | +6% |
| Potash | +2% | +2% |
| UAN32 | −14% | −7% |
Source: DTN/Progressive Farmer, Jul 29, 2026.
Three things sit behind that bottom row.
Seasonality is doing most of the work. UAN demand concentrates in preplant and sidedress. By late July the sidedress window has closed across the Corn Belt — USDA had corn 78% silked and 25% at dough stage as of July 26 (USDA NASS via DTN, Jul 27, 2026). There is no in-season buyer left for liquid N this year. Urea, by contrast, has a wheat-country and pasture-fertility demand tail that does not shut off on the same calendar.
UAN is freight-bound in a way urea is not. NOLA barge values set the US benchmark for UAN32, with interior prices built up from there on freight and handling. A solid with an international bid can be sold somewhere else when domestic demand ends. A diluted liquid mostly cannot, and the price does the adjusting instead.
There is no trade-remedy floor. The 2021–22 countervailing and antidumping cases on UAN from Russia and Trinidad and Tobago ended in negative injury determinations at the USITC in July 2022, so no duty orders issued (USITC, Jul 18, 2022). Those two origins have historically supplied the large majority of US UAN imports. UAN32 has no duty structure underneath it of the kind that shapes some other nutrient markets; the domestic price is free to find seasonal lows.
Market read: Nutrien Ltd. (NTR, NYSE/TSX) — Hold. The retail-margin tailwind of the past six weeks came from wholesale falling faster than retail, and the July 29 survey is the week that gap stopped widening. Neutral-to-negative for retail margin from here, and not yet offset by volume.
4. What it changes in a program
What's new: At current spreads, the nitrogen-form decision for 2027 is worth more per acre than most of the agronomic decisions layered on top of it.
Evidence: The same 180 lb N per acre, delivered four ways.
| Form | Product needed (lb/acre) | Tons/acre | $/acre | vs. cheapest |
|---|---|---|---|---|
| Anhydrous | 220 | 0.110 | $105.60 | — |
| UAN32 | 563 | 0.281 | $129.65 | +$24.05 |
| Urea | 391 | 0.196 | $133.62 | +$28.02 |
| UAN28 | 643 | 0.321 | $152.02 | +$46.42 |
Crop Root Zone calculation. Product prices from DTN/Progressive Farmer, Jul 29, 2026; quantities from product analysis at 180 lb N/acre. Product cost only — excludes application, storage, equipment and any stabilizer.
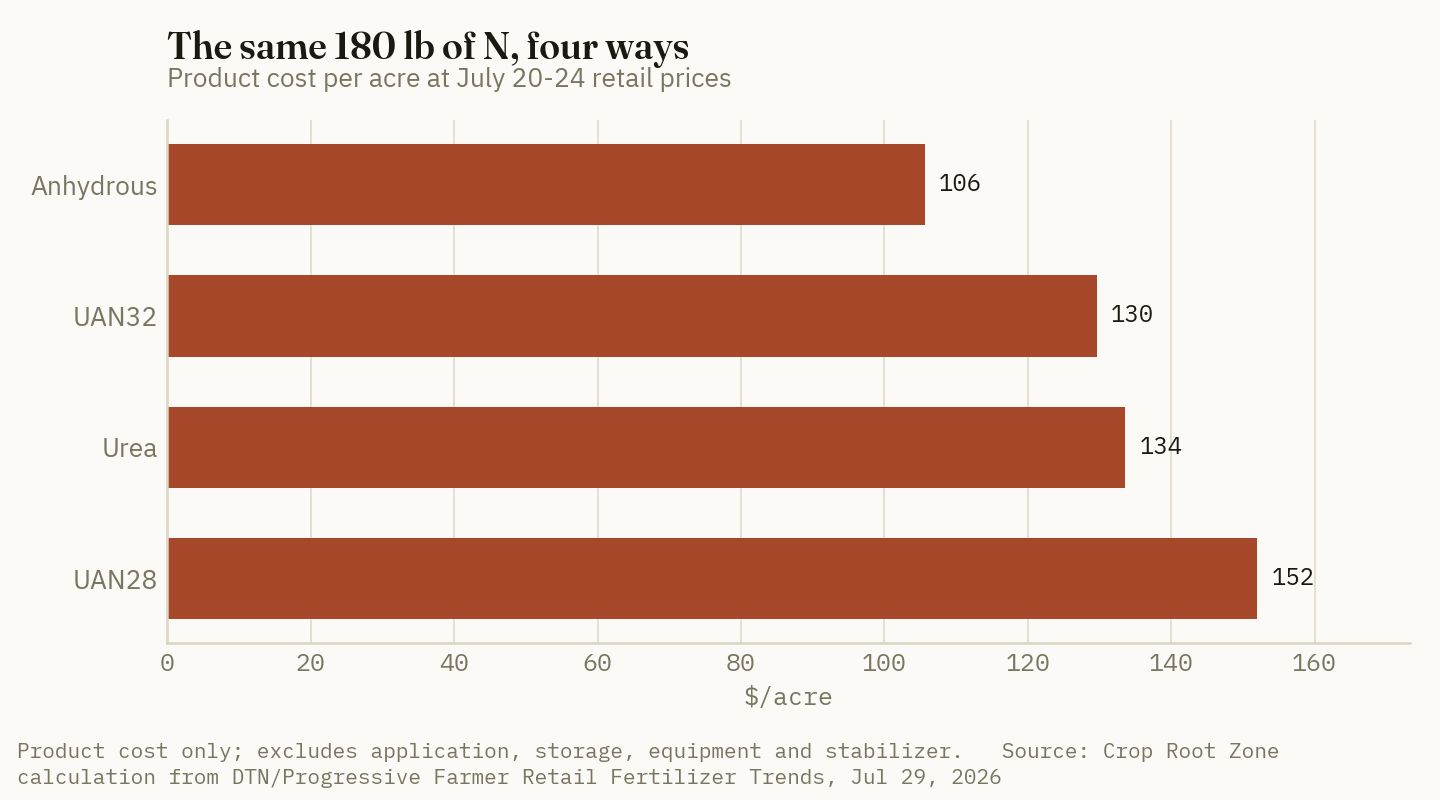
Three caveats keep that table from being a shopping list.
Application cost is not in it. Anhydrous requires a toolbar, a tank and an application pass that the liquid forms partly avoid. The gap between anhydrous's product cost and its delivered-to-the-root cost is the widest of the four, and it eats a meaningful share of the $24.
Timing flexibility is not in it either. UAN's value has always been partly the ability to split, to sidedress late, to run a Y-drop, and to tank-mix with a herbicide pass. None of that appears in a $/lb N table, and it is why UAN carried a premium in the first place.
Urea and UAN are not interchangeable on the same equipment. A grower set up for dry broadcast does not switch to liquid on a two-cent spread, and the reverse is equally true. The crossover is a marginal fact — it applies to tons not yet committed and to a 2027 program still being designed, not to a re-tooling.
Ground Truth: Two cents is too thin to move anyone's equipment, and it is not supposed to. Its real use is as a negotiating fact: it establishes that liquid no longer carries an inherent premium, which is the assumption most fall quotes are still built on. The UAN28/UAN32 spread is the one that is genuinely actionable this season, because it is six times larger and because the thing it buys — winter storage tolerance — can be bought once as steel and insulation instead of every year as price.
5. What to watch
- Whether UAN32 gets re-bid first. It is the cheapest liquid, the only nutrient below year-ago, and the one with the most seasonal demand still to return. If fall bookings firm anywhere in the complex, this is where it should show up first.
- Whether the UAN28/UAN32 spread persists past first frost. A spread genuinely about winter-storage risk should widen into autumn, not compress. If it compresses instead, the $0.13 was a seasonal supply artifact and the capital case for heated storage weakens with it.
- Whether urea's floor holds. Urea printed $1 higher last week at $683 and is +6% year-over-year — the form in this complex with the clearest import-replacement floor, and the benchmark against which the UAN crossover is measured. If urea firms while UAN32 does not, the two-cent discount widens without UAN32 doing anything at all.
References
- DTN/Progressive Farmer, "Fertilizer Prices Keep Sliding as UAN32 Leads 4 Nutrients in Significant Drops," Jul 29, 2026 — https://www.dtnpf.com/agriculture/web/ag/crops/article/2026/07/29/fertilizer-prices-keep-sliding-uan32
- DTN/Progressive Farmer, "Fertilizer Prices Continue Downward Trend," Jul 22, 2026 — https://www.dtnpf.com/agriculture/web/ag/crops/article/2026/07/22/fertilizer-prices-continue-downward
- Mississippi State University Extension Service, Fluid Fertilizers — https://extension.msstate.edu/publications/fluid-fertilizers
- U.S. International Trade Commission, "Urea Ammonium Nitrate Solutions from Russia and Trinidad and Tobago Do Not Injure U.S. Industry," Jul 18, 2022 — https://www.usitc.gov/press_room/news_release/2022/er0718ll1961.htm
- USDA NASS Crop Progress via DTN, "Corn Rated 63% Good to Excellent; Soybeans 63% Good to Excellent as of July 26," Jul 27, 2026 — https://www.dtnpf.com/agriculture/web/ag/news/article/2026/07/27/usda-crop-progress-corn-rated-63-63
Disclosures
Crop Root Zone is an independent publication. Nothing here is investment advice. Market calls, where included, reflect the editors' own read and are not a recommendation to buy or sell any security.
Nitrogen's Floor Is a Gas Price — and the Two Gas Prices That Set It Are 5.8x Apart
US ammonia's feedstock cost runs about $111/ton at EIA's Q3 Henry Hub forecast; Europe's runs about $640/ton at the current TTF. That gap is why retail nitrogen has fallen six straight weeks and still won't fall much further.
Retail anhydrous slipped under $1,000/ton in the second full week of July for the first time in 17 weeks, at $967, down 11% in a month (DTN/Progressive Farmer, Jul 22, 2026). UAN32 fell 15% in the same window. Six straight weeks of mostly lower retail nitrogen has produced the obvious question from every grower with fall application still to book: how much further does this go? The honest answer is that the question is not really about fertilizer. Nitrogen is congealed natural gas — roughly 33 MMBtu of it per short ton of ammonia — and the price of the marginal ton on the world market is set by the gas cost of the highest-cost producer still running. Right now the two gas benchmarks that bracket that cost curve are further apart than at almost any point outside an active energy crisis.
1. The two gas prices
What's new: EIA's July Short-Term Energy Outlook, published July 7, raised the 2026 Henry Hub forecast to an average $3.67/MMBtu, with $3.37/MMBtu in the third quarter and $3.57/MMBtu in the fourth (EIA, Short-Term Energy Outlook, Jul 7, 2026). That was an increase from the $3.60 average carried in the June edition. Meanwhile the European TTF front-month benchmark sat near €58.06/MWh on July 27, having pulled back more than 8% in a session from a four-month high as the pause in US–Iran hostilities eased supply fears (Trading Economics / ICE TTF, Jul 27, 2026).
Evidence: Those two numbers are quoted in different units, different currencies, and different energy denominators, which is exactly why the gap between them gets underestimated in ag commentary. Put on a common basis — €58.06/MWh at the July 29 EUR/USD rate of 1.1386, divided by 3.412 MMBtu per MWh — European gas costs about $19.38/MMBtu.
| Benchmark | Native quote | $/MMBtu | Date | |
|---|---|---|---|---|
| Henry Hub, Q3 2026 forecast | $3.37/MMBtu | 3.37 | EIA STEO, Jul 7 | ██ |
| Henry Hub, Q4 2026 forecast | $3.57/MMBtu | 3.57 | EIA STEO, Jul 7 | ██ |
| CF Industries realized, Q1 2026 | $4.57/MMBtu | 4.57 | Company reporting, Q1 2026 | ██ |
| TTF front-month | €58.06/MWh | 19.38* | Trading Economics, Jul 27 | ██████████ |
Source: EIA Short-Term Energy Outlook, Jul 7, 2026; Trading Economics ICE TTF, Jul 27, 2026; CF Industries Q1 2026 reporting. *Conversion at EUR/USD 1.1386 (Jul 29, 2026) and 3.412 MMBtu/MWh — our calculation, not a quoted assessment.
The ratio is 5.75 to 1. It is worth pausing on how unusual that is in a market where the underlying molecule is fungible and shippable as LNG. It persists because ammonia plants are not mobile, much of the European fleet is already depreciated, and a marginal European producer will run at a thin margin rather than absorb the fixed cost and technical risk of a cold restart later.
Ground Truth: A five-and-a-half-times feedstock gap is not a trading opportunity; it is a structural feature that North American growers have been quietly collecting a dividend on for four years. The practical implication is narrower than the headline: the floor under US nitrogen is an import-parity number set by European and North African economics, while the ceiling is whatever domestic producers can extract before imported tons arrive. Retail moves inside that band are demand and logistics. Moves outside it require one of the two gas prices to move.
2. What the gas price becomes, per ton
What's new: Run the feedstock through the standard conversion and the cost stack separates cleanly. Ammonia synthesis consumes roughly 33 MMBtu of natural gas per short ton of NH₃ in a modern steam-methane-reforming plant — a rule-of-thumb figure that varies by roughly ±10% with plant vintage and configuration, and one we treat as an engineering estimate rather than a quoted number.
Evidence: At that intensity, feedstock alone accounts for the following per short ton of ammonia:
| Gas basis | $/MMBtu | Feedstock $/st NH₃* | vs US Gulf Q3 | |
|---|---|---|---|---|
| Henry Hub Q3 2026 forecast | 3.37 | 111 | — | ██ |
| Henry Hub Q4 2026 forecast | 3.57 | 118 | +$7 | ██ |
| CF Industries realized Q1 2026 | 4.57 | 151 | +$40 | ██ |
| TTF front-month, Jul 27 | 19.38 | 640 | +$529 | ██████████ |
Source: gas benchmarks as above. *Feedstock cost only, at an assumed 33 MMBtu/short ton NH₃ — our calculation. Excludes power, labor, maintenance, capital charge, CO₂ compliance and logistics, all of which are material and none of which are in this column.
Two things fall out of that table immediately. First, the entire swing in US gas over the past year — from the $3.68/MMBtu CF Industries realized in Q1 2025 to the $4.57 it realized in Q1 2026 — is worth about $30/ton of ammonia at the plant gate. That is real money to a producer running millions of tons, and it is nearly invisible against a $967/ton retail anhydrous price. Second, the European producer's feedstock cost alone, at roughly $640/ton, is within striking distance of the entire retail delivered US price. Every dollar of European labor, maintenance, ETS carbon compliance and freight sits on top of that.
$529/ton
The feedstock-cost advantage a US Gulf ammonia plant holds over a European one at the current TTF, per short ton of ammonia — before a single dollar of carbon compliance is counted. (Our calculation from EIA STEO Jul 7, 2026 and ICE TTF Jul 27, 2026, at 33 MMBtu/st NH₃.)
3. Why the European fleet still sets an Illinois nitrogen bill
What's new: The intuitive read on that table is that Europe should simply stop making ammonia, and to a significant degree it has. Yara mothballed its Hull plant in the UK; Achema in Lithuania has halted intermittently since 2022; Western European operating rates were running near 81.3% against historical norms well above that (Argus Media and CRU/BC Insight reporting, 2026). The EU Emissions Trading System, elevated energy costs and import competition have combined to take capacity out permanently rather than cyclically.
Evidence: A shrinking high-cost fleet does not stop setting the marginal price. It sets it more violently. When Europe runs at 81% rather than 95%, the tons it does not make have to come from somewhere, and the somewhere is Egypt, Algeria, Trinidad, the Arab Gulf and increasingly the US Gulf itself. That import pull is what puts a floor under the export price a US producer can achieve, which is in turn what a US producer weighs against the domestic netback when deciding whether to load a barge for the Corn Belt or a vessel for Rotterdam.
This is the mechanism people skip past when they extrapolate six down weeks at retail into a collapse. The domestic price is not falling toward a cost-of-production floor near $111/ton of feedstock. It is falling toward an export-parity floor that is a European number — and the European number has been rising, not falling: the ICE TTF front month was up 29% month-to-date as of July 17 before the late-July pullback (Trading Economics, Jul 2026).
| Q1 2025 | Q1 2026 | Change | |
|---|---|---|---|
| CF Industries realized gas cost ($/MMBtu) | 3.68 | 4.57 | +24% |
| Implied feedstock cost ($/st NH₃)* | 121 | 151 | +$30 |
| DTN retail anhydrous, mid-July ($/ton) | 768** | 967 | +26% |
Source: CF Industries Q1 reporting; DTN/Progressive Farmer, Jul 22, 2026. *Our calculation at 33 MMBtu/st. **Implied from DTN's reported +26% year-over-year change on the July 2026 figure — a derived value, not a separately published quote.
A +24% move in feedstock alongside a +26% move in retail is not causation, and we are not claiming it is; the two series are separated by a year of inventory, a marketing season and a wholesale layer. It is a useful reminder that retail nitrogen roughly tracked its dominant input over the last year, which is what a market operating inside its cost band does — and what makes a further large leg down unlikely without a gas move underneath it.
Ground Truth: The six-week retail slide is a normalization off the spring peak, not the start of a repricing. For a buyer the distinction is entirely operational: normalization means the remaining downside is measured in tens of dollars per ton and is mostly seasonal, so waiting has a defined and modest payoff. A repricing would mean hundreds, and would justify deferring the whole fall program. Nothing in either gas benchmark supports the second story. Book fall anhydrous on a schedule, not on a forecast.
4. What would actually move the floor
What's new: Three things would shift the North American nitrogen floor, and none of them is domestic retail demand.
Evidence:
-
Henry Hub through $4.50 and staying there. EIA already revised 2026 up in the July STEO and has Q4 at $3.57 against Q3's $3.37 — a normal winter shape, not a signal. A sustained move to $4.50 and above adds roughly $37/ton of ammonia feedstock relative to the Q3 forecast, and it passes through readily because the entire domestic fleet faces it at once. Note the shape of the risk: EIA's own revision direction this summer has been up.
-
TTF resolving downward. European gas fell more than 8% in a session in late July on the US–Iran pause. A genuine de-escalation that pulls TTF back toward the €30s/MWh would cut European feedstock cost by roughly 40%, restart mothballed capacity, and lower the export-parity floor under US prices. This is the single highest-leverage variable for a US nitrogen buyer, and it has nothing whatsoever to do with agriculture.
-
New US Gulf ammonia capacity actually landing. Incremental Gulf tons change the domestic netback directly, by giving producers less reason to chase export parity in the first place.
Note what is not on that list: acreage, weather, and the retail price itself. Those set the timing of purchases within the band. They do not set the band.
Market read: CF (NYSE) — Hold. The Q1 gas-cost move from $3.68 to $4.57/MMBtu is roughly a $30/ton headwind that a business running gross margins near 40% absorbs comfortably, and the structural feedstock advantage over the European fleet is intact and enormous. But retail nitrogen falling six straight weeks is a revenue-side fact, and buying the structural story at the moment the price side is deflating means paying for a spread that is currently narrowing at one end.
5. What to watch
- EIA's August STEO, due early August, for whether the Q4 Henry Hub number moves off $3.57 — and in which direction the revision runs, given July's was upward.
- TTF after the US–Iran pause. The pullback from the four-month high is the variable with the most leverage over the US floor and the least coverage in ag press. €40/MWh and €70/MWh are different worlds for the 2027 nitrogen bill.
- Whether DTN's late-July retail print extends the run past six weeks. The Jul 22 print, covering the week of July 13–17, was the freshest available at the time of writing. The run's persistence matters more than any single week's magnitude.
- Q4 fill program terms, which are where producers reveal the netback they actually believe in, as distinct from the one they describe on an earnings call.
Ground Truth: The most important number in this piece for a grower is neither $3.37 nor $19.38 — it is that neither one is set by anything happening in agriculture. Nitrogen buyers spend nearly all of their market attention on fertilizer commentary and almost none on the two gas benchmarks that determine the band that commentary operates inside. Reversing that ratio is the cheapest available improvement to a fall procurement process, and it costs nothing but a browser tab.
References
- U.S. Energy Information Administration, Short-Term Energy Outlook, Jul 7, 2026 — https://www.eia.gov/outlooks/steo/
- Rigzone, "USA EIA Raises Henry Hub Price Forecast for 2026, 2027," Jul 15, 2026 — https://www.rigzone.com/news/usa_eia_raises_henry_hub_price_forecast_for_2026_2027-15-jul-2026-184139-article/
- Trading Economics, EU Natural Gas (ICE TTF), accessed Jul 29, 2026 — https://tradingeconomics.com/commodity/eu-natural-gas
- Trading Economics, Euro/US Dollar exchange rate, accessed Jul 29, 2026 — https://tradingeconomics.com/euro-area/currency
- DTN/Progressive Farmer, "Fertilizer Prices Continue Downward Trend," Jul 22, 2026 — https://www.dtnpf.com/agriculture/web/ag/crops/article/2026/07/22/fertilizer-prices-continue-downward
- Argus Media, "Falling gas price boosts Europe nitrogen margins," 2026 — https://www.argusmedia.com/en/news-and-insights/latest-market-news/2757766-falling-gas-price-boosts-europe-nitrogen-margins
- CRU / BC Insight, "European ammonia imports," Jan 26, 2026 — https://www.bcinsight.crugroup.com/2026/01/26/european-ammonia-imports/
- CF Industries Q1 2026 results, as reported in trade and financial coverage, 2026.
Disclosures
Crop Root Zone is an independent publication. Nothing here is investment advice. Market calls, where included, reflect the editors' own read and are not a recommendation to buy or sell any security.
USDA's $500 Million Fertilizer Program Buys Two-Thirds of One Ammonia Train
FIELDS caps awards at $150 million and requires a 50% private match, so no single project can exceed roughly $300 million — a quarter of what one 1.1-million-tonne ammonia train costs. And the nutrient with a 95% import gap is the one $500 million cannot touch.
Agriculture Secretary Brooke Rollins announced the Fertilizer Investment & Expansion for Long-Term Domestic Supply program on July 1: $500 million through USDA Rural Development's Rural Business-Cooperative Service, funded from the Commodity Credit Corporation, for construction and expansion of domestic fertilizer production. Awards run $15 million to $150 million. Applicants must bring a 50% private match. The window is 45 days and closes August 15, with awards targeted for September or October.
The money is not new. USDA is de-obligating funds from the previous administration's Fertilizer Production Expansion Program and combining them with additional CCC resources. Of 121 projects inherited from FPEP, 90 had no signed agreement and 8 were complete.
What matters for a fertilizer buyer is not the announcement. It is whether $500 million, structured this way, can move a ton of anything. The arithmetic says: a little, and not where the problem is.
1. The program terms, and what they bound
What's new: The two design choices that determine the program's ceiling are the award cap and the match requirement, and they compound.
Evidence:
| FIELDS term | Detail |
|---|---|
| Total funding | $500 million |
| Award range | $15 million – $150 million |
| Private match | 50%, committed before USDA participates |
| Authority | Commodity Credit Corporation |
| Administrator | USDA Rural Development, Rural Business-Cooperative Service |
| Eligible nutrients | Nitrogen, phosphate, potash, sulfur, other critical crop nutrients |
| Application window | 45 days; closes Aug 15, 2026, 11:59 p.m., via Grants.gov |
| Award announcement | Targeted September–October 2026 |
Source: USDA announcement of Jul 1, 2026, as reported by DTN/Progressive Farmer, Fertilizer Daily and DRG News, Jul 1, 2026.
USDA states six program priorities — Made in America, Independent and Competitive, Farmer Focused, Innovative, Energy Dominant and Secure, and capable of delivering measurable production increases. Rollins framed the rationale in a single line: "Food security is national security."
USDA's own announcement is also reported to carry an anti-consolidation eligibility screen — that an applicant, including corporate affiliates, must not hold a domestic market share equal to or greater than the fourth-largest holder in the relevant nutrient. That restriction did not appear in DTN's coverage or in two trade write-ups of the same release, so any applicant should work from the notice of funding availability rather than from press summaries. If it holds as described, it excludes the largest domestic producers in each nutrient from the program entirely, and that changes materially who the $500 million can reach.
2. What fertilizer capacity actually costs
What's new: Set the program's maximum possible project against the going rate for nitrogen capacity on the US Gulf, where two world-scale plants have just been built and a third has a published cost estimate.
Evidence:
| Project | Capacity | Capital | |
|---|---|---|---|
| Beaumont New Ammonia (Woodside, acquired from OCI) | 1.1 mn t/yr | $2,350 mn | ██████████ |
| Beaumont Phase 2 (second train, FID slated 2026) | 1.1 mn t/yr | $1,200–1,400 mn | ██████ |
| Largest possible FIELDS project (max award + match) | — | $300 mn | █ |
| Largest possible FIELDS award | — | $150 mn | ▌ |
Source: Woodside Energy project disclosures and trade reporting on the Beaumont New Ammonia acquisition and Phase 2 cost estimate; FIELDS terms per USDA, Jul 1, 2026. Bars scaled to the Beaumont acquisition value.
The largest project FIELDS can underwrite, with the maximum award fully matched, is roughly a quarter of the cost of one greenfield ammonia train. The entire program, if every dollar were matched and pooled into a single hypothetical project, would fund about 70 to 80% of one such train — and the program cannot pool, because the cap is per award.
$300 million
The largest total project cost FIELDS can support — a $150 million maximum award plus its required 50% match. One 1.1-million-tonne ammonia train costs $1.2–1.4 billion. (USDA program terms, Jul 1, 2026; Woodside Phase 2 cost estimate)
This is not a criticism of the cap. It is a statement about what kind of program this is. A $300 million project envelope buys brownfield debottlenecking at an existing plant, a granulation or blending line, a sulfur or micronutrient facility, a mid-scale phosphate upgrade — real things, none of which are a new nitrogen complex.
Ground Truth: FIELDS is priced like a plant-construction program and sized like a debottlenecking program. Judge it in September on tons per federal dollar in the actual award list, not on the $500 million headline — and expect those tons to come from expansions at existing sites rather than from anything greenfield. The useful comparison is not "$500 million versus the fertilizer bill." It is "$500 million versus the $2.3 billion of private Gulf ammonia capacity that came online in the last nine months without it."
3. The FPEP record this replaces
What's new: FIELDS is the second attempt at this. The first one's numbers are public and they set a defensible prior.
Evidence: FPEP committed up to $900 million through the CCC with awards from $1 million to $100 million. Two documented award rounds:
| FPEP round | Awarded | Projects | Note |
|---|---|---|---|
| August 2024 | $35 mn | 7 | One project added 195,000 t/yr of capacity |
| October 2024 | $120 mn | 6 | Projects in AR, CA, IL, SD, WA, WI |
Source: DTN/Progressive Farmer coverage of USDA FPEP awards, Aug 29, 2024 and Oct 30, 2024.
USDA has stated that FPEP projects together with other fertilizer projects are expected to produce more than 2 million tons of new capacity covering 30 million acres. That figure bundles FPEP with projects the program did not fund, so it is not a clean measure of what the grants caused — an important distinction when the same framing gets reused for FIELDS.
Against imports, 2 million tons is a small number. Roughly 39.4 million tons of fertilizer entered the United States in 2025, with another 12.4 million tons in the first quarter of 2026 alone. Two million tons of domestic capacity is about 5% of a year's imports, and it took a $900 million authorization and four years to get an estimate that includes projects built without it.
The execution record is the sharper point. Ninety of 121 inherited FPEP projects lacked signed agreements and eight were finished. Rollins characterized some of the de-obligated spending as having gone to "worms and flowerpots and kombucha." Whatever one makes of the characterization, the 8-of-121 completion count is the operative fact, and FIELDS' 50% match and shovel-ready screen are visibly designed as the correction.
4. The dependence is in potash, and this program cannot reach it
What's new: The import gap by nutrient is wildly uneven, and the nutrient with the largest gap is the one least susceptible to a $300 million project.
Evidence:
| Nutrient | % imported, 2021 | % imported, 2025 | |
|---|---|---|---|
| Potash | 93 | 95 | ██████████ |
| Phosphate | 9 | 16 | ██ |
| Nitrogen | 12 | 13 | █ |
Source: USDA data as reported by Investigate Midwest, Jun 3, 2026. Bars scaled to potash.
Nitrogen is 87% domestically supplied and just received 2.3 million tonnes a year of new Gulf capacity from Gulf Coast Ammonia and Beaumont — privately financed, at a scale FIELDS cannot approach. Phosphate's dependence nearly doubled in four years but from a low base. Potash sits at 95% imported and rising, and the United States has essentially one commercial-scale domestic producer of consequence.
A potash mine is not a $300 million project. It is a multi-billion-dollar, decade-long development with orebody risk, shaft or solution-mining capital, and a rail and port chain attached. There is no version of a $150 million grant that changes the potash import share, and no realistic applicant pool that could absorb one.
Ground Truth: Every FIELDS dollar that goes to nitrogen is aimed at the nutrient with the smallest import gap and the most private capital already committed. Every dollar that could address the real 95% dependence is two orders of magnitude too small to try. The program's honest best case is speed and de-risking on projects that were largely happening anyway — which is exactly what a mandatory 50% private match selects for. That is a defensible use of $500 million. It is not a supply-security policy, and a grower should not price fall 2027 potash as though it were one.
Market read: CF — Hold. If the anti-consolidation screen holds as reported, the largest domestic nitrogen producers are excluded from applying, and the capacity FIELDS can plausibly fund is too small and too brownfield to alter the competitive picture in nitrogen either way. The program is close to a non-event for the incumbents' economics.
5. What to watch between now and October
The award list itself, in tons. The single most informative number will be aggregate announced capacity divided by federal dollars awarded. FPEP's one disclosed project-level figure — 195,000 t/yr — is the benchmark to beat. If the September–October list produces comparable tons per dollar, FIELDS will have added something on the order of 1 to 2 million tons of announced capacity against roughly 39 million tons of annual imports.
The nutrient mix of the awards. A list weighted to nitrogen would confirm that the program follows applicant readiness rather than import exposure. A list with meaningful sulfur and phosphate content would be the more useful outcome, given that sulfur is currently the most disrupted input in the entire fertilizer stack and phosphate's import share is the one moving fastest in the wrong direction.
Whether announced projects reach signed agreements. This is the failure mode FPEP demonstrated at scale. Announcement is not obligation, obligation is not construction, and construction is not tons. On the FPEP record, the conversion rate from the first to the last was 8 in 121.
The gap between award and operation. Even a well-chosen brownfield expansion awarded in October 2026 is a 2028 or 2029 tonnage event. Nothing in this program touches the fall 2026 fertilizer bill, the 2027 prepay decision, or the sulfur-driven cost push currently working through the ammonium sulfate and thiosulfate complex.
References
- USDA, "Secretary Rollins Announces $500 Million for Fertilizer Investment and Expansion Program to Strengthen America's Fertilizer Supply Chain," Jul 1, 2026 — https://www.usda.gov/about-usda/news/press-releases/2026/07/01/secretary-rollins-announces-500-million-fertilizer-investment-and-expansion-program-strengthen
- DTN/Progressive Farmer, USDA Redirects $500 Million to Expand Domestic Fertilizer Capacity, Jul 1, 2026 — https://www.dtnpf.com/agriculture/web/ag/crops/article/2026/07/01/usda-redirects-500-million-expand
- Fertilizer Daily, USDA launches $500 million FIELDS program to expand U.S. fertilizer production, Jul 1, 2026 — https://www.fertilizerdaily.com/20260701-usda-launches-500-million-fields-program-to-expand-u-s-fertilizer-production/
- DRG News, USDA announces $500 million for Fertilizer Investment & Expansion Program, Jul 1, 2026 — https://drgnews.com/2026/07/01/usda-announces-500-million-for-fertilizer-investment-expansion-program-to-strengthen-americas-fertilizer-supply-chain/
- DTN/Progressive Farmer, USDA Awards Grants to Expand Domestic Fertilizer Production, Aug 29, 2024, and USDA Awards $120M to 6 Fertilizer Production Projects, Oct 30, 2024 — https://www.dtnpf.com/agriculture/web/ag/crops/article/2024/10/30/usda-awards-120m-6-fertilizer
- Investigate Midwest, Foreign suppliers play a key role in US fertilizer markets, Jun 3, 2026 — https://investigatemidwest.org/2026/06/03/foreign-suppliers-play-a-key-role-in-us-fertilizer-markets/
- Ammonia Energy Association and Woodside Energy project disclosures on Beaumont New Ammonia capacity and cost — https://ammoniaenergy.org/organization/woodside-energy/
Disclosures
Crop Root Zone is an independent publication. Nothing here is investment advice. Market calls, where included, reflect the editors' own read and are not a recommendation to buy or sell any security.
Priced in Bushels, Anhydrous Is the Only Nutrient That Got More Expensive This Year
Corn is up 14.7% and fertilizer has fallen six weeks, yet a standard N-P-K program costs 42.0 bushels an acre against 40.8 a year ago. Seven of eight nutrients got cheaper in bushels. The one everyone calls the cheapest nitrogen in the country did not.
Nearby corn futures traded at 451.7 cents per bushel on July 30, up 7.3% on the month and 14.7% on the year (Trading Economics, Jul 30, 2026). Retail fertilizer has fallen for six consecutive weeks. Both of those facts point the same direction, and both are true. And yet a conventional 180-60-60 corn fertility program priced at this week's retail costs 42.0 bushels per acre — against 40.8 bushels a year ago. The bill went up in the only currency a farm actually has.
1. Reprice the fertilizer bill in bushels
What's new: Measured in bushels of corn rather than dollars, seven of the eight nutrients DTN tracks are cheaper than a year ago and one is not.
Evidence: Divide each nutrient's retail price by the corn price on the same date. The result — bushels of corn per ton of product — is the number that governs whether an input decision is affordable, because it is denominated in the thing the farm produces.
| Nutrient | Jul 2026 $/ton | bu/ton now | bu/ton a year ago* | Change |
|---|---|---|---|---|
| Anhydrous | 962 | 213.0 | 193.8 | +19.2 |
| MAP | 958 | 212.1 | 223.1 | −11.0 |
| DAP | 913 | 202.1 | 205.1 | −3.0 |
| 10-34-0 | 718 | 158.9 | 170.3 | −11.4 |
| Urea | 683 | 151.2 | 163.5 | −12.3 |
| Potash | 494 | 109.4 | 122.9 | −13.5 |
| UAN28 | 473 | 104.7 | 106.2 | −1.5 |
| UAN32 | 461 | 102.1 | 125.8 | −23.7 |
Crop Root Zone calculation. Nutrient prices: DTN/Progressive Farmer Retail Fertilizer Trends,
Jul 29, 2026 (week of Jul 20–24), delivered-to-farm retail. Corn: nearby CBOT futures per
Trading Economics, $4.5173/bu on Jul 30, 2026, and $3.940/bu a year earlier implied from the same
series' +14.65% year-over-year figure. Year-ago nutrient prices marked * are implied from DTN's
published whole-percent year-over-year changes and therefore carry rounding error of roughly
±0.5%.
Ranked by the change, the picture is unambiguous.
| Nutrient | Change in bu/ton vs. year ago | ||
|---|---|---|---|
| UAN32 | −23.7 | ██████████ |
cheaper |
| Potash | −13.5 | ██████ |
cheaper |
| Urea | −12.3 | █████ |
cheaper |
| 10-34-0 | −11.4 | █████ |
cheaper |
| MAP | −11.0 | █████ |
cheaper |
| DAP | −3.0 | █ |
cheaper |
| UAN28 | −1.5 | █ |
cheaper |
| Anhydrous | +19.2 | ████████ |
more expensive |
Source: Crop Root Zone calculation as above. Bars scaled to the largest absolute change (23.7 bu).
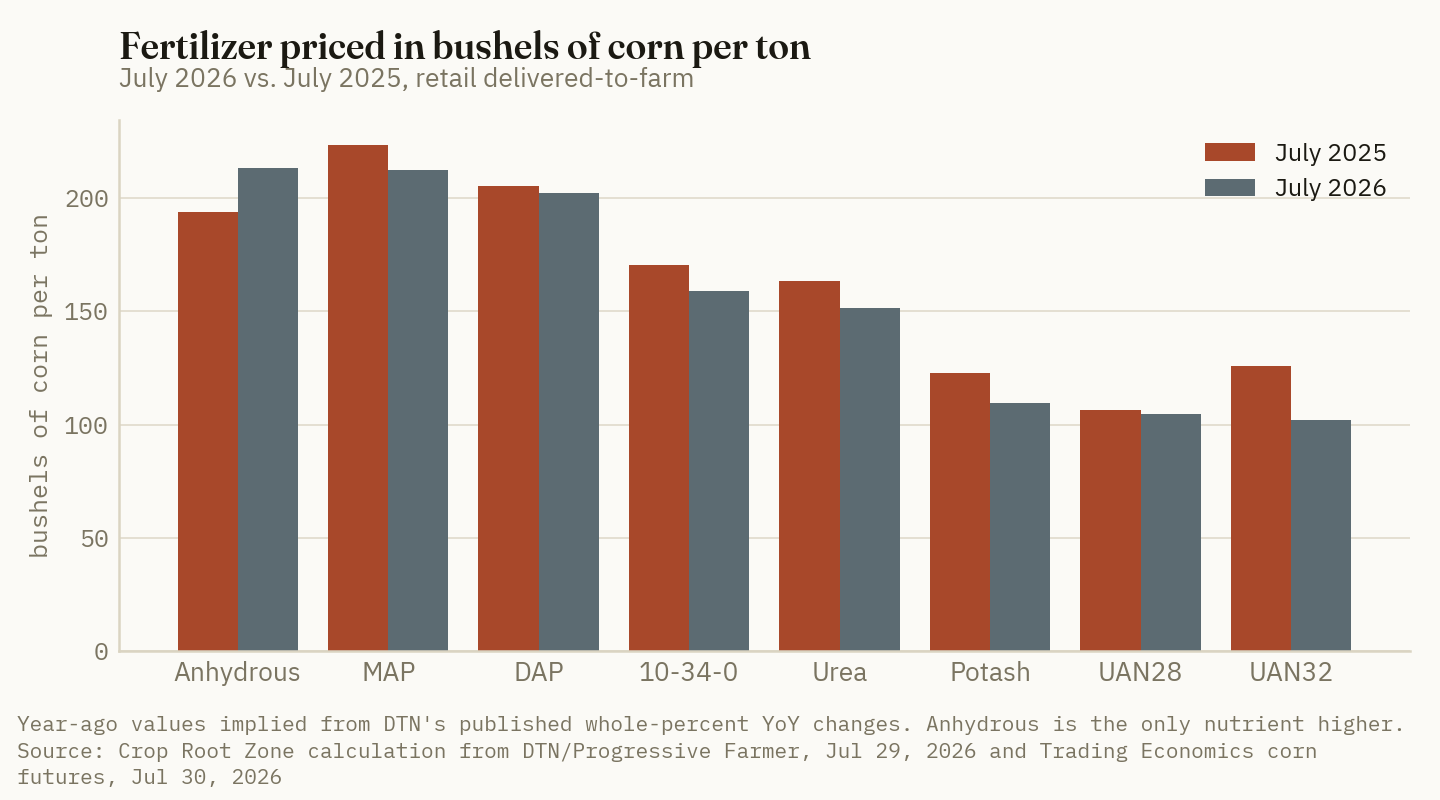
Ground Truth: Anhydrous being both the cheapest nitrogen per pound of N and the only nutrient that lost ground against corn this year is not a contradiction — it is the whole point. Cheapness is a statement about the alternatives; affordability is a statement about the crop. Anhydrous won the first argument and lost the second, because it started 2025 from a much lower base and rose 26% while corn rose 15%. A grower who reads "cheapest nitrogen in the country" as "nitrogen is affordable again" has swapped one comparison for the other without noticing.
2. The full program, in the unit that matters
What's new: A standard corn fertility program now costs 42.0 bushels per acre, up from 40.8 a year ago — despite a 14.7% corn rally and six weeks of falling fertilizer prices.
Evidence: Build a conventional 180 lb N, 60 lb P₂O₅, 60 lb K₂O program and price it three ways: at today's retail, a month ago, and a year ago.
| Component | Product | Rate | Tons/acre | $/acre now | $/acre a month ago* | $/acre a year ago* |
|---|---|---|---|---|---|---|
| Nitrogen | Anhydrous 82-0-0 | 180 lb N | 0.110 | 105.60 | 118.69 | 83.83 |
| Phosphate | DAP 18-46-0 | 60 lb P₂O₅ | 0.065 | 59.53 | 58.94 | 52.68 |
| Potash | 0-0-60 | 60 lb K₂O | 0.050 | 24.70 | 24.22 | 24.22 |
| Total | $189.83 | $201.85 | $160.73 | |||
| Corn price | $4.5173 | $4.2100* | $3.9400* | |||
| Cost in bushels/acre | 42.0 | 47.9 | 40.8 |
Crop Root Zone calculation. Nutrient prices from DTN/Progressive Farmer, Jul 29, 2026; month-ago and year-ago values implied from DTN's published whole-percent MoM and YoY changes. Corn from Trading Economics nearby futures, Jul 30, 2026, with prior levels implied from the same series' +7.29% monthly and +14.65% annual changes. DAP's incidental 23.5 lb of N per acre is not credited against the anhydrous rate — including it would reduce the total by roughly $3/acre in every column and would not change the comparison.
42.0 bu/acre
What a conventional 180-60-60 corn fertility program costs at July 20–24 retail prices and July 30 corn — up from 40.8 bushels a year ago, and down from 47.9 a month ago. (Crop Root Zone calculation from DTN/Progressive Farmer, Jul 29, 2026 and Trading Economics, Jul 30, 2026)
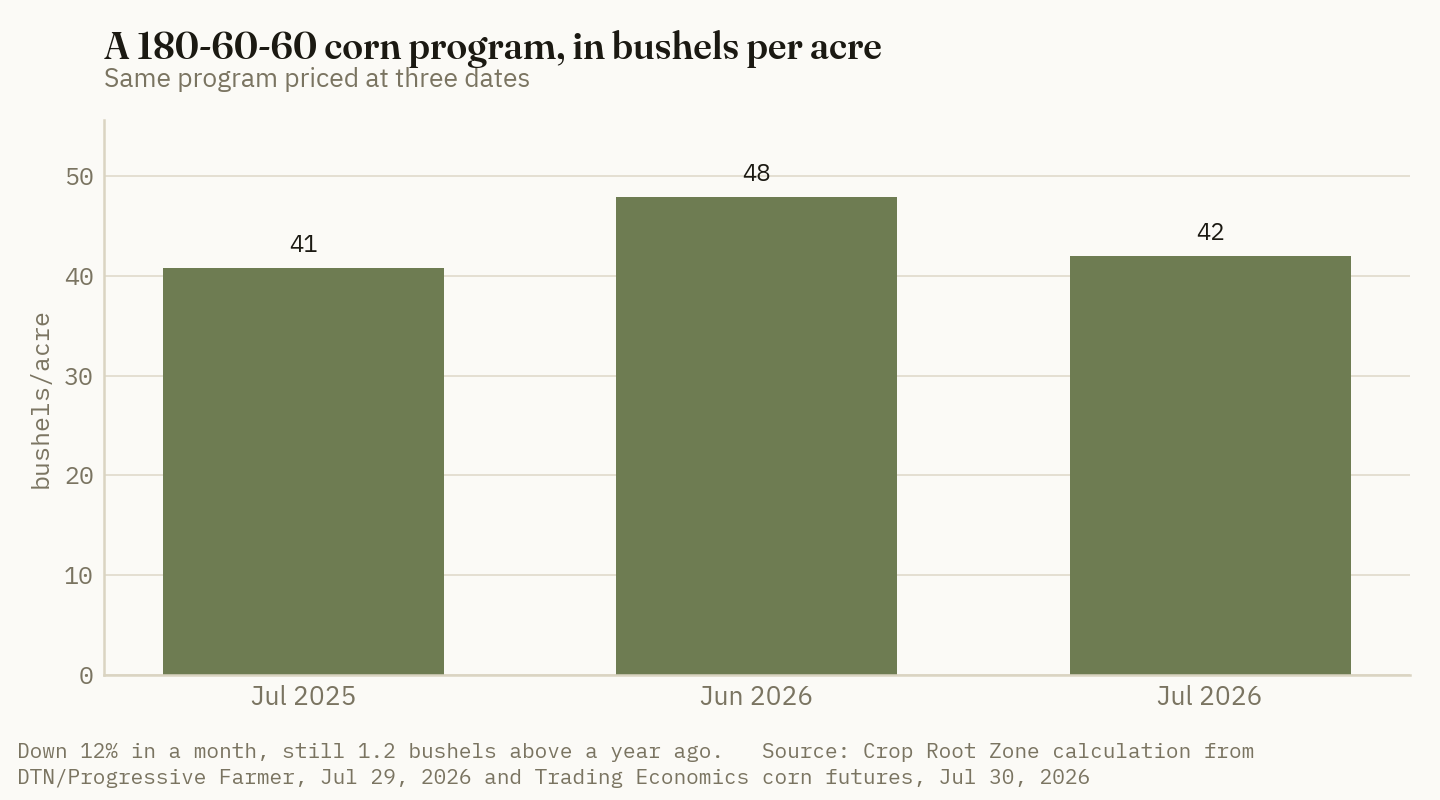
Two conclusions sit inside that row, and they point opposite ways.
The month was extraordinary. 47.9 bushels to 42.0 in four weeks is a 12% improvement in the input burden — the single best month this ratio has had in 2026, driven from both ends at once as fertilizer fell and corn rallied. Nobody should minimize it.
The year was not. Against July 2025 the program still costs 1.2 more bushels per acre. On a 180 bu/acre yield expectation the fertility bill has gone from 22.7% of the crop to 23.3% of it. The six-week fertilizer decline that has dominated the trade press has not yet returned the ratio to where it was a year ago, and it has been helped by a 15% corn rally the whole way.
Ground Truth: The correct framing for a 2027 budget conversation is not "fertilizer came down," it is "fertilizer came down from a spike, and the spike is not fully unwound." A planning number built off the month-over-month improvement will be roughly 6 bushels an acre too optimistic. A planning number built off the year-over-year ratio — 42 bushels, not 36 — survives contact with a fall quote sheet. If corn gives back its July rally without fertilizer giving back more, the ratio deteriorates from here without a single fertilizer price rising.
3. Where the ratio is honest and where it is not
What's new: The bushels-per-ton framing is the right unit for this decision, but it has three specific failure modes worth naming before anyone budgets off it.
Evidence and limits:
It uses a futures price, not your price. The corn figure above is nearby CBOT futures. A farm realizes a cash price that differs by local basis, and it sells new-crop bushels against a deferred contract rather than the nearby. In a market where the nearby is bid up on old-crop tightness, the ratio computed on the nearby understates the real bushel cost of inputs for a 2026 harvest bushel. Recompute it against the contract you actually intend to sell.
It assumes the yield. Bushels per acre is bushels per ton multiplied by tons per acre — and tons per acre is set by a yield goal that is a decision, not a fact. USDA rated corn 63% good-to-excellent as of July 26, down three points on the week, with much of the belt needing rain into early August (USDA NASS via DTN, Jul 27, 2026). A program budgeted at 42 bu/acre against 180 bu/acre becomes a program costing 26% of a 160 bu crop rather than 23% of a 180 bu one, and nothing about the fertilizer price changed.
It ignores everything else on the budget. Fertility is one line. Seed, chemicals, machinery, land and interest are the others, and several of them do not move with corn at all. A ratio that improves on the fertility line while cash rent is fixed and interest is fixed is a smaller improvement to the farm than to the line.
| What the ratio does | What it does not do |
|---|---|
| Puts the input bill in the unit the farm produces | Account for basis or the contract month you sell |
| Strips out the "prices fell!" framing that ignores grain | Fix a yield assumption you get wrong |
| Compares nutrients on a common, decision-relevant basis | Cover the rest of the cost structure |
| Shows which nutrients genuinely got affordable | Say anything about rate — only about price |
Ground Truth: The ratio's real value is diagnostic rather than predictive. It answers "did this input get more or less affordable" cleanly, and it refuses to be fooled by a price decline that happens alongside a grain decline. It cannot tell you what to plant. Used the other way — as a forecast — it is exactly as reliable as the yield you plugged into it, which in the last week of July is not very.
4. What it changes for 2027 planning
Three practical consequences.
Budget nitrogen off the year, not the month. The anhydrous line is the one that moved wrong. At 213 bu/ton it is still 19 bushels above where it sat last July, and it is the largest single component of the program. Anyone rolling forward last year's per-acre N number with a haircut for "prices came down" will be short.
The phosphate and potash lines are the quiet good news — and they are turning. Potash at 109.4 bu/ton is 13.5 bushels cheaper than a year ago, the second-best improvement in the table. But DAP printed +1% month-over-month and potash +2% in the same July 29 survey. The improvement in the P and K rows is a year-over-year fact that the most recent month is starting to erode.
The corn side is carrying more of the ratio than the fertilizer side. Of the improvement in the program's bushel cost over the past month, the corn rally did a meaningful share of the work. That is a fragile source of improvement. A fertilizer price that falls stays fallen until someone re-bids it; a corn rally on a dry forecast unwinds on a wet one — which is precisely what happened to the July 30 session, where corn slipped below $4.50 on improved Midwest weather before recovering (Trading Economics, Jul 30, 2026).
5. What to watch
- The next two DTN surveys against the corn board. The ratio improves only if fertilizer falls faster than corn. Two flat fertilizer weeks against a corn setback would push 42.0 back toward 45 with no fertilizer price moving at all.
- Anhydrous specifically. It is the only nutrient of the eight on the wrong side of the year-over-year comparison and the biggest line in the program. It is also the one whose decline just decelerated to $5/week.
- August weather and the yield denominator. Corn at 63% good-to-excellent and falling, with dryness forecast into early August, is the input into every per-acre figure above. The bushel cost of a fertility program is a fraction, and the denominator is still being written.
References
- DTN/Progressive Farmer, "Fertilizer Prices Keep Sliding as UAN32 Leads 4 Nutrients in Significant Drops," Jul 29, 2026 — https://www.dtnpf.com/agriculture/web/ag/crops/article/2026/07/29/fertilizer-prices-keep-sliding-uan32
- Trading Economics, corn futures series, accessed Jul 30, 2026 — https://tradingeconomics.com/commodity/corn
- USDA NASS Crop Progress via DTN, "Corn Rated 63% Good to Excellent; Soybeans 63% Good to Excellent as of July 26," Jul 27, 2026 — https://www.dtnpf.com/agriculture/web/ag/news/article/2026/07/27/usda-crop-progress-corn-rated-63-63
- DTN/Progressive Farmer, "Fertilizer Prices Continue Downward Trend," Jul 22, 2026 — https://www.dtnpf.com/agriculture/web/ag/crops/article/2026/07/22/fertilizer-prices-continue-downward
Disclosures
Crop Root Zone is an independent publication. Nothing here is investment advice. Market calls, where included, reflect the editors' own read and are not a recommendation to buy or sell any security.
The Wheat You Seed in September Is a Soybean Decision — and Beans Just Hit a Two-Year High
Purdue puts wheat/double-crop beans at $216/acre contribution margin against $116 for continuous corn. The system's fertility bill is 11% smaller than corn's but weighted to phosphate and potash — the two nutrients that just turned higher.
Winter wheat harvest reached 81% complete as of July 26 (USDA NASS via DTN, Jul 27, 2026), which for most of the double-crop belt means this year's soybean planting decision was made weeks ago and is now a standing crop. The decision actually in front of growers is the wheat acre that goes in the ground in September and October — and it is not a wheat decision. In a double-crop system, seeding wheat in the fall commits the following summer's soybean acre before a single bushel of wheat has been priced. Soybeans traded at $11.80/bu on July 30, up 22.7% year-over-year and near their highest levels since May 2024 (Trading Economics, Jul 30, 2026). That is the number the September decision is really being made against.
1. The two-crop stack, at current board prices
What's new: Both legs of the wheat/double-crop soybean system are priced better than they have been in two years, at the same time.
Evidence: Wheat came off a more-than-two-year high of $7.06/bu on July 22 and settled around $6.50–6.64 in the following week, with September wheat at $6.60 on July 29 (Trading Economics and Barchart, Jul 22–29, 2026). Soybeans are at $11.80. Neither leg is at a distressed price.
| Crop | Assumed yield* | Price basis | Gross $/acre |
|---|---|---|---|
| Winter wheat | 75 bu* | $6.50/bu, CBOT SRW late Jul | 487.50 |
| Double-crop soybeans | 36 bu | $11.80/bu, nearby | 424.80 |
| Two-crop total | $912.30 | ||
| Full-season soybeans | 58 bu* | $11.80/bu | 684.40 |
| Corn | 180 bu* | $4.5173/bu, nearby | 813.11 |
*Yields marked with an asterisk are Crop Root Zone planning assumptions, not observations or forecasts — substitute your own APH. The 36 bu double-crop soybean figure is Purdue's published 2026 budget expectation for low-productivity soil (Purdue 2026 Crop Cost and Return Guide). Grain prices: Trading Economics, Jul 29–30, 2026. Gross revenue only — this table deliberately excludes costs, which is why it is not a comparison of profitability. See section 2.
Gross revenue is the wrong number to decide on and the right number to start from, because it shows the structural feature of the system: two crops share one acre-year, and the sum can exceed what a single high-value crop produces on the same ground. What it hides is that the system also carries two sets of costs, two field-operation seasons and two weather exposures.
2. The published margin comparison
What's new: On Purdue's 2026 budgets, the wheat/double-crop soybean rotation carries roughly double the contribution margin of continuous corn on average-productivity soil.
Evidence: Purdue's 2026 Crop Cost and Return Guide puts the contribution margin for wheat/double-crop soybeans on average-productivity soil at $216/acre, against $116/acre for continuous corn (Purdue University, 2026 Purdue Crop Cost and Return Guide). Illinois's spring 2026 budget revision puts stand-alone soybean returns in a $30–67/acre band depending on region and soil productivity, from southern Illinois at the low end to central high-productivity soils at the high end (farmdoc daily, "Spring Revision to 2026 Illinois Crop Budgets," May 2026).
| System | Contribution margin, $/acre | ||
|---|---|---|---|
| Wheat / double-crop soybeans | 216 | ██████████ |
|
| Continuous corn | 116 | █████ |
Source: Purdue University, 2026 Purdue Crop Cost and Return Guide, average-productivity soil. Contribution margin is revenue less variable costs; it does not cover fixed costs, land or overhead, and the two systems do not carry identical fixed-cost burdens.
There is a supply-side signal running alongside this. USDA cut more than a million acres from its wheat Prospective Plantings estimate, with most of those acres moving to soybeans — the kind of substitution that suggests the wheat acre has been under competitive pressure, not that the double-crop system has been.
Ground Truth: A $100/acre contribution-margin gap is large enough to matter and soft enough to disappear, and the thing that determines which is the double-crop bean's planting date. The Purdue margin assumes the second crop actually gets planted on time. In a wet June the wheat comes off late, the bean goes in late, the yield expectation falls from 36 bushels toward the mid-20s, and roughly half the advantage over continuous corn evaporates on weather the grower did not control. Treat the $216 as the outcome of a good execution, not as the expected value of the system.
3. The largest single lever is wheat harvest moisture
What's new: The highest-return decision in a double-crop system is not a seed, chemical or fertility choice. It is whether to combine wheat wet.
Evidence: Harvesting wheat at 20–22% moisture and planting immediately produced soybean yield increases of 8 to 12 bu/acre compared with planting after wheat harvested at 13–15% moisture (Bayer Crop Science, Double-Cropping Soybeans After Wheat). Every day lost after wheat harvest reduces the vegetative growth the bean gets before it goes reproductive, which is why Ohio State recommends targeting a 180,000 plant/acre harvest stand for soybeans planted in early July — a higher population than a full-season stand, to compensate for a shorter plant.
At $11.80 soybeans, that 8–12 bushel window is worth $94 to $142 per acre.
$94–$142/acre
The value of the 8–12 bu double-crop soybean yield gain from harvesting wheat at 20–22% moisture instead of waiting for 13–15%, priced at July 30 soybeans. (Yield range: Bayer Crop Science; price: Trading Economics, Jul 30, 2026; product of the two is a Crop Root Zone calculation)
Against that sits a drying bill. Taking 75 bu/acre of wheat from roughly 21% down to a storable 13.5% is about seven and a half points of moisture removal. At commercial drying charges that typically run in the low single-digit cents per bushel per point, that is an estimated $15–25/acre — a figure this publication is flagging as an estimate because current commercial wheat drying charges are locally negotiated and not publicly benchmarked in the way grain prices are. Even at the top of that range, the trade is roughly $20 spent to capture $94–142.
| Decision | Cost | Benefit | Net* |
|---|---|---|---|
| Combine wheat at 20–22%, dry, plant same day | −$15 to −$25 (est.) | +$94 to +$142 | +$69 to +$127 |
| Wait for 13–15% field-dry wheat | $0 | $0 | $0 |
*Crop Root Zone calculation combining the cited yield range with July 30 soybean prices and an estimated drying cost band. Excludes the risk that waiting also costs wheat quality or field access, which would widen the gap further in favor of the top row.
Ground Truth: Most growers in a double-crop system will spend more time in the winter optimizing a seed trait or a starter package worth $5–15/acre than they will spend arranging the dryer capacity and the labor that make a same-day plant possible — which is worth five to ten times as much. The binding constraint on that trade is almost never the economics. It is whether the dryer, the trucks and a second planter crew are available on the same day the combine rolls, and that is a logistics problem you solve in February, not in June.
4. The fertility bill: less nitrogen, more potash
What's new: The double-crop system's replacement-fertility cost is roughly 11% below continuous corn's — but its composition is weighted toward exactly the two nutrients that turned higher in the most recent retail survey.
Evidence: Take grain nutrient removal across both crops and price the replacement at July 20–24 retail.
| System | N applied | P₂O₅ removed | K₂O removed |
|---|---|---|---|
| Wheat 75 bu + DC soybeans 36 bu | ~100 lb* | 66.3 lb | 72.9 lb |
| Corn 180 bu | 180 lb | 66.6 lb | 48.6 lb |
Crop Root Zone calculation using commonly cited grain nutrient-removal coefficients (wheat 0.50
lb P₂O₅ and 0.30 lb K₂O per bu; soybeans 0.80 and 1.40; corn 0.37 and 0.27). Published
coefficients vary by a few tenths between references — the comparison between systems is the
point, not the absolute. * The 100 lb N is applied nitrogen on the wheat crop only; the
double-crop soybean is assumed to receive none, as is conventional.
Priced out:
| Nutrient line | Wheat + DC beans | Corn 180 bu |
|---|---|---|
| Nitrogen | $74.24 (urea) | $105.60 (anhydrous) |
| Phosphate | $65.79 (DAP) | $66.10 (DAP) |
| Potash | $30.02 | $20.01 |
| Total replacement | $170.05 | $191.71 |
| Nitrogen as a share of the bill | 44% | 55% |
Crop Root Zone calculation. Product prices: DTN/Progressive Farmer Retail Fertilizer Trends, Jul 29, 2026 (week of Jul 20–24), delivered-to-farm retail. Assumes full grain-removal replacement, no soil-test drawdown or build, and no credit for the incidental nitrogen in DAP.
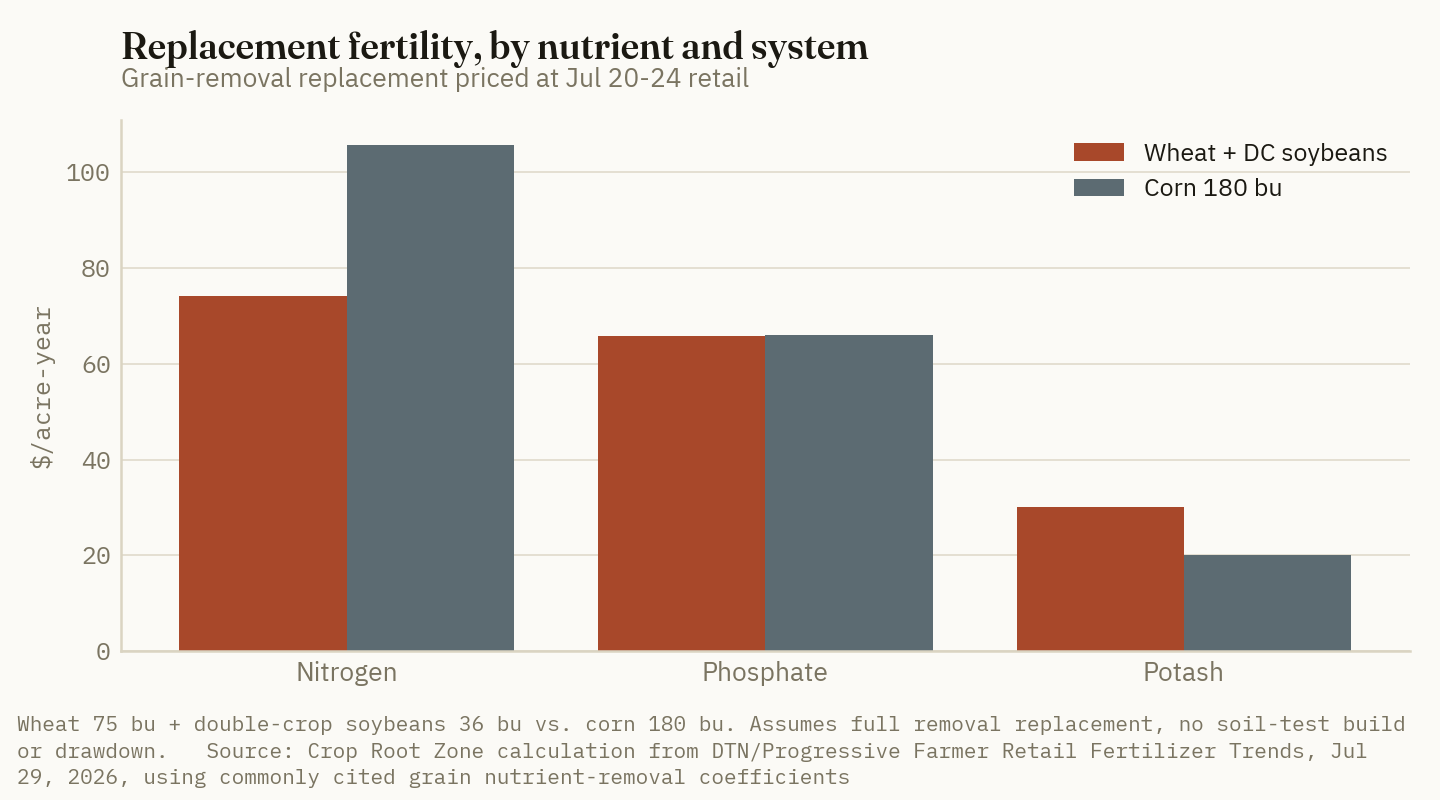
The composition is the story. Corn's fertility bill is 55% nitrogen, and nitrogen is the nutrient that fell 11% month-over-month in the July 29 survey. The double-crop system's bill is 44% nitrogen and carries 50% more potash removal — and potash printed +2% month-over-month and +2% year-over-year, with DAP +1% MoM, in that same survey.
Ground Truth: The nitrogen relief that dominated the trade press this summer was worth materially less to a wheat/double-crop bean operation than to a corn operation, and the P and K turn now working against it is worth materially more. That is a genuine narrowing of the rotation's cost advantage that has nothing to do with either crop's price and will not appear in any yield or price forecast. If the P and K firming continues, the double-crop system's input edge over corn compresses even if fertilizer as a whole is described as "falling."
5. What to watch before the drill goes in the ground
- Whether wheat holds above $6. Wheat has come off a two-year high at $7.06 to $6.50–6.64 in a week. The double-crop case does not require a strong wheat price — the beans carry it — but a wheat leg below $6 turns the system's first crop into an enabler that has to be subsidized by the second.
- The soybean price the September decision is actually made against. Beans at $11.80 and +22.7% year-over-year make the double-crop bean look like the best-priced acre in the rotation. That price will move before the bean is planted eleven months later. Price a portion of it.
- The phosphate and potash trend. Two consecutive higher prints in DAP and potash would take the double-crop system's fertility advantage from 11% toward single digits, and it is the cheapest of the three things on this list to hedge against — by booking the P and K rather than the N.
- Wheat seeding intentions. USDA's Prospective Plantings already showed more than a million acres leaving wheat for soybeans. If that continues, the double-crop acre shrinks with the wheat acre, regardless of how good the system's own economics look.
References
- USDA NASS Crop Progress via DTN, "Corn Rated 63% Good to Excellent; Soybeans 63% Good to Excellent as of July 26," Jul 27, 2026 — https://www.dtnpf.com/agriculture/web/ag/news/article/2026/07/27/usda-crop-progress-corn-rated-63-63
- Purdue University, 2026 Purdue Crop Cost and Return Guide — https://ag.purdue.edu/commercialag/home/paer-article/2026-purdue-crop-cost-and-return-guide
- farmdoc daily (University of Illinois), "Spring Revision to 2026 Illinois Crop Budgets," May 2026 — https://farmdocdaily.illinois.edu/2026/05/spring-revision-to-2026-illinois-crop-budgets.html
- Bayer Crop Science, Double-Cropping Soybeans After Wheat — https://www.cropscience.bayer.us/articles/bayer/double-cropping-soybeans-after-wheat
- DTN/Progressive Farmer, "Fertilizer Prices Keep Sliding as UAN32 Leads 4 Nutrients in Significant Drops," Jul 29, 2026 — https://www.dtnpf.com/agriculture/web/ag/crops/article/2026/07/29/fertilizer-prices-keep-sliding-uan32
- Trading Economics, soybean, corn and wheat futures series, accessed Jul 29–30, 2026 — https://tradingeconomics.com/commodity/soybeans
Disclosures
Crop Root Zone is an independent publication. Nothing here is investment advice. Market calls, where included, reflect the editors' own read and are not a recommendation to buy or sell any security.
Beans Made a Contract High on a Purchase Agreement, Not a Balance Sheet
November soybeans hit a contract high at $12.43¾ on Chinese buying that exists because of a government-to-government commitment. We separate the part of that price a grower can bank from the part that is counterparty risk, and price the rotation both ways.
November soybeans closed at $12.43¾ on July 23, a contract high, while December corn closed at $4.87½, a two-month high (Pro Farmer, After the Bell, Jul 23, 2026). By July 29 the nearby soybean contract was at $11.88/bu, up 6.37% on the month and 22.75% on the year, with nearby corn at $4.55, up 10.17% on the month (Trading Economics, Jul 29, 2026). Those are good numbers in a year that has not produced many. The complication is where they came from. The soybean bid is not the product of a short crop or a shrunken carryout — it is the product of a purchase commitment negotiated between two governments, and a commitment is a different kind of asset than a demand curve.
1. What actually moved the price
What's new: China has been buying US soybeans steadily since resuming purchases around the start of the 2026-27 marketing year. Private exporters reported sales of 5.0 million bushels and 9.7 million bushels to China for 2026-27 delivery, plus a further 17.3 million bushels split 29% current-year and 71% new-crop (USDA daily export sales reporting, as relayed by Farm Progress, Jul 20, 2026). The week ending July 9 was among the largest weeks for new-crop US soybean sales in months, led by China and unknown destinations, helped by US prices being more competitive against Brazil (Brownfield Ag News, Jul 2026).
Evidence: The volumes sit inside a framework, not a market. The trade agreement negotiated last fall commits China to purchasing at least 25 million tonnes of US soybeans annually through 2028, within a broader commitment of roughly $30 billion of US agricultural products per year for three years plus $17 billion in other agricultural goods (Investigate Midwest, Jul 1, 2026; Brownfield Ag News, Jul 2026). Market analyst Jim McCormick characterized the near-term structure as roughly 12 million tonnes of new-crop beans against 25 million tonnes for the following year (Brownfield Ag News, Jul 2026).
There is corroborating physical behavior on the Chinese side, and it matters more than the headline number. Sinograin scheduled an auction of 500,000 tonnes of imported soybeans — its largest sale since January — to clear storage capacity ahead of incoming US supplies (Trading Economics market commentary, Jul 29, 2026). A state reserve making room is a stronger signal than a signed page.
| Contract | Close | Date | Note |
|---|---|---|---|
| November 2026 soybeans | 12.43¾ | Jul 23, 2026 | Contract high |
| December 2026 corn | 4.87½ | Jul 23, 2026 | Two-month high |
| Nearby soybeans | 11.88 | Jul 29, 2026 | −1.99% on the day |
| Nearby corn | 4.55 | Jul 29, 2026 | −0.82% on the day |
Source: Pro Farmer, After the Bell, Jul 23, 2026; Trading Economics, Jul 29, 2026. Nearby and new-crop contracts are different delivery months and are not directly comparable to one another.
Ground Truth: The distinction that matters here is not bullish-versus-bearish, it is commercial-versus-contractual. A commercial bid is the sum of many independent buyers who each have their own reason. A contractual bid is one buyer with an obligation, and obligations are renegotiable in a way that crush margins are not. That does not make the price fake — the bushels are moving and the money is real. It makes the price less diversified, and a less diversified price deserves a faster hedge, not a slower one.
2. The ratio moved, and it moved toward beans
What's new: At the July 23 closes, the new-crop soybean-corn ratio — November beans divided by December corn — stood at 2.55. Earlier in the 2026 season the ratio had been running near 2.40, just under a long-run average around 2.45, which gave no clear edge to either crop (Farm Progress, 2026).
Evidence: A move from 2.40 to 2.55 is not a rounding error in rotation math. It is the difference between a coin flip and a lean.
| New-crop ratio (Nov beans ÷ Dec corn) | Value | Read | |
|---|---|---|---|
| Long-run average | 2.45 | ████████ |
Neutral |
| Earlier in the 2026 season | 2.40 | ████████ |
Slight corn edge |
| Jul 23, 2026 closes | 2.55 | ██████████ |
Bean lean |
Source: ratio calculated by Crop Root Zone from Pro Farmer's Jul 23, 2026 closes; long-run and earlier-2026 reference values per Farm Progress, 2026.
Two cautions before anyone rearranges a rotation on the strength of that. First, this is the ratio for the crop that is already in the ground — it prices the 2026 harvest, not the 2027 planting decision. The genuine 2027 signal has to be read off the deferred board, and we are not going to quote deferred contracts we have not independently sourced. Second, the ratio is a revenue signal and nothing else. It ignores the cost side entirely, and the cost side is where the rotation decision actually gets made.
3. The cost side is where beans win — and it just got less generous
What's new: The standing argument for soybeans in an expensive-fertilizer year is that they buy no nitrogen. That argument is at its weakest in months right now, because nitrogen is the cheapest it has been in months.
Evidence: Retail anhydrous averaged $967/ton in the second full week of July, down 11% on the month and back under $1,000 for the first time in 17 weeks, working out to $0.59/lb N — the cheapest nitrogen in the country by a wide margin, against urea at $0.74/lb N and UAN32 at $0.73 (DTN/Progressive Farmer, Jul 22, 2026).
Run the nitrogen line for a 180 bu/acre corn yield goal at a 1.0 lb N per bushel planning convention:
| Nitrogen source | $/lb N | 180 lb N/acre | vs anhydrous | |
|---|---|---|---|---|
| Anhydrous | 0.59 | 106 | — | ███████ |
| UAN32 | 0.73 | 131 | +$25 | █████████ |
| Urea | 0.74 | 133 | +$27 | █████████ |
| UAN28 | 0.86 | 155 | +$49 | ██████████ |
| Soybeans (no applied N) | — | 0 | −$106 |
Source: $/lb N figures from DTN/Progressive Farmer, Jul 22, 2026 (week of Jul 13–17). Per-acre figures are our calculation at 180 lb N/acre and are illustrative — an actual rate comes from a soil test and a yield history, not from a rule of thumb.
The soybean nitrogen advantage is roughly $106/acre against anhydrous at current retail. Real, but noticeably smaller than it was at the spring peak, when anhydrous carried a materially higher price and the same 180 lb N cost proportionally more. Falling nitrogen is quietly a pro-corn development in the rotation math, and it is arriving in exactly the weeks the bean price is rallying. The two forces pull in opposite directions, which is why this year's rotation call is genuinely close rather than obvious — and why treating the ratio as the whole answer is a mistake.
$106/acre
The nitrogen bill soybeans avoid at current anhydrous prices on a 180 lb N/acre corn program — down sharply from the spring, and shrinking with every additional down week in retail nitrogen. (Our calculation from DTN/Progressive Farmer, Jul 22, 2026.)
4. How to treat a policy-sourced bid in a pricing program
What's new: The practical question is not whether to believe the Chinese commitment. It is how much of the crop to price against it, and how fast.
Evidence: Four features of this particular bid should shape that answer.
- It is concentrated. One buyer, one agreement, one counterparty government. Concentration is pleasant while it is buying; it is precisely why prices move quickly when it stops.
- It is front-loaded into new crop. The reported splits — 71% of one 17.3 million-bushel sale for 2026-27, and the bulk of recent flash sales for new-crop delivery — mean the commitment is being expressed in the contract a grower is trying to price right now, not in a comfortably distant year.
- It has physical corroboration. Sinograin clearing 500,000 tonnes of reserve stocks to make room is what a buyer does when it intends to take delivery. It is the most reassuring single datum in the picture.
- It remains price-sensitive anyway. Part of the July buying was attributed to US competitiveness against Brazil. Commitment or not, origin economics still set the pace.
Put together, that argues for pricing more of the new crop than a grower normally would at a contract high, and pricing it sooner. The usual reason to slow-walk sales into a rally is that a broad commercial bid tends to persist and improve as more buyers arrive. A concentrated contractual bid has a different shape: it is more likely to hold flat until it doesn't.
Ground Truth: Sell into a policy rally faster than you would sell into a demand rally. The bull case in a commercial market is that more buyers show up; here the buyer is already at the table with a signed number, and there is no queue behind it. That truncates the right tail of the distribution without doing anything at all to the left one. An asymmetry like that is the exact situation forward pricing exists to capture — and a contract high produced this way is not a reason to hold out for a better one.
5. What to watch
- Weekly export sales pace against the 25 million tonne annual commitment. The commitment is an annual figure; the weekly pace reveals whether it is being met on schedule or quietly backloaded. Backloading is the early warning that matters.
- Whether unknown destinations keep appearing alongside China. Genuine third-party demand is what would convert this from a contractual bid into a commercial one, and it is the most bullish thing that could plausibly happen to this price.
- US–Brazil price competitiveness. July's buying was partly a price story. If Brazil undercuts, the pace slows regardless of what is written down.
- Retail nitrogen's run. Each additional down week in anhydrous shrinks soybeans' cost-side advantage and pulls the 2027 rotation back toward corn. These two stories are almost always covered separately. They belong in the same spreadsheet.
References
- Pro Farmer, "After the Bell: Corn and soybeans edge higher," Jul 23, 2026 — https://www.profarmer.com/news/after-bell/after-bell-corn-and-soybeans-edge-higher
- Trading Economics, Soybeans, accessed Jul 29, 2026 — https://tradingeconomics.com/commodity/soybeans
- Trading Economics, Corn, accessed Jul 29, 2026 — https://tradingeconomics.com/commodity/corn
- Farm Progress, "USDA Exports: 3 more flash sales announced," Jul 20, 2026 — https://www.farmprogress.com/marketing/flash-sales
- Brownfield Ag News, "China commitments offer support for soybean futures," 2026 — https://www.brownfieldagnews.com/news/china-commitments-offer-support-for-soybean-futures/
- Brownfield Ag News, "China drives new crop U.S. soybean export sales," 2026 — https://www.brownfieldagnews.com/news/china-drives-new-crop-u-s-soybean-export-sales/
- Investigate Midwest, "China resumes US soybean purchases under trade deal with Trump, but future for farmers remains 'daunting'," Jul 1, 2026 — https://investigatemidwest.org/2026/07/01/china-resumes-us-soybean-purchases-under-trade-deal-with-trump-but-future-for-farmers-remains-daunting/
- DTN/Progressive Farmer, "Fertilizer Prices Continue Downward Trend," Jul 22, 2026 — https://www.dtnpf.com/agriculture/web/ag/crops/article/2026/07/22/fertilizer-prices-continue-downward
- Farm Progress, "Decide now: Grain prices approach projected 2026 peaks," 2026 — https://www.farmprogress.com/marketing/decide-now-grain-prices-approach-projected-2026-peaks
Disclosures
Crop Root Zone is an independent publication. Nothing here is investment advice. Market calls, where included, reflect the editors' own read and are not a recommendation to buy or sell any security.
Corn Lost Four Points in the Week That Sets the Yield — and the Market Had Already Paid for It
Corn conditions fell to 63% good-to-excellent, ten points below last year, while December corn rallied 13.5% in a month. A bushel now buys 7.7 pounds of nitrogen, up from 6.1 in June — but still less than the 8.3 it bought a year ago.
USDA's Crop Progress report, released July 27, put the corn crop at 63% good-to-excellent for the week ending July 26 — down four points in a week and ten points below the same week last year. Soybeans fell three points to 63%. Topsoil moisture is now rated short or very short across 47% of the 48 states surveyed, against 26% a year ago. The ratings broke in the exact week that corn moves through late pollination into grain fill, which is the week the number is worth the most. December corn closed the same session at $4.56 a bushel, up 13.5% from a month ago.
Both of those things are true, and the second one is the reason the first one is less actionable than it looks.
1. What the report actually said
What's new: The deterioration is broad, and it is concentrated at the top of the distribution. Corn rated excellent fell from 16% to 13% in a week; the very poor and poor categories together rose from 9% to 12%. That is the signature of a crop losing its best acres, not one where marginal ground is finally giving up.
Evidence: The full national breakdown across the 18 corn states, which planted 91% of 2025 acreage:
| Corn condition (18 states) | Very poor | Poor | Fair | Good | Excellent | G/E |
|---|---|---|---|---|---|---|
| Week ending Jul 26, 2026 | 3 | 9 | 25 | 50 | 13 | 63 |
| Previous week (Jul 19) | 2 | 7 | 24 | 51 | 16 | 67 |
| Previous year (Jul 26, 2025) | 2 | 5 | 20 | 53 | 20 | 73 |
Source: USDA NASS, Crop Progress, released Jul 27, 2026.
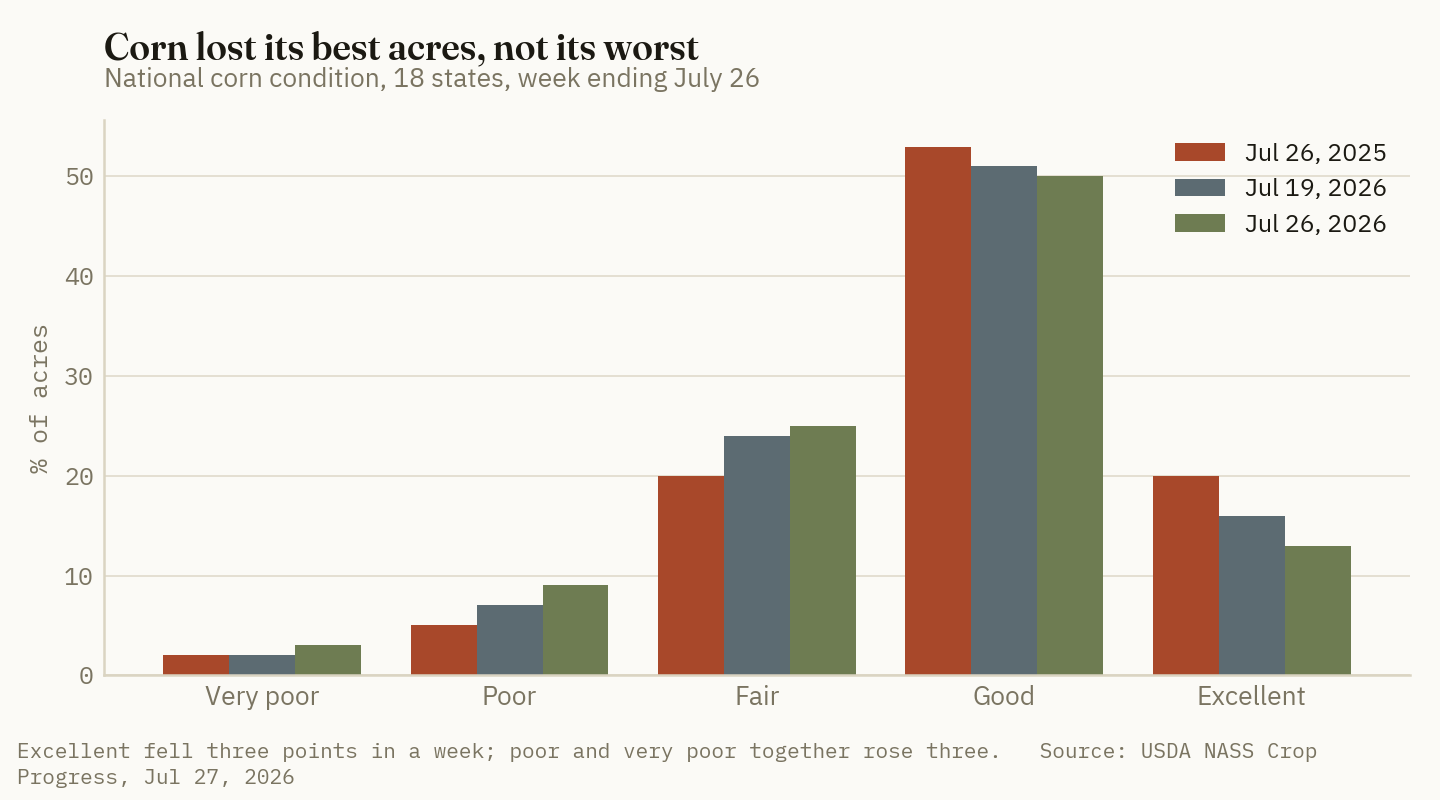
Soybeans moved the same direction with less force — 2/7/28/52/11, for 63% good-to-excellent against 66% the prior week and 70% a year ago. Spring wheat, the one crop that did not deteriorate, held at 53% good-to-excellent and is now four points better than last year, a useful reminder that this is a Corn Belt moisture story rather than a national one.
The moisture table is the cleanest read on why:
| Topsoil moisture (48 states) | Very short | Short | Adequate | Surplus |
|---|---|---|---|---|
| Week ending Jul 26, 2026 | 15 | 32 | 49 | 4 |
| Previous week | 12 | 29 | 54 | 5 |
| Previous year | 7 | 19 | 63 | 11 |
Source: USDA NASS, Crop Progress, released Jul 27, 2026.
Very short more than doubled year over year. Short-or-worse went from 26% of the country to 47%, and three points of that happened in the last seven days.
2. The development pace is the part most reads will miss
What's new: The crop is running ahead of normal while its ratings fall. Corn silking reached 78% against a 2021–25 average of 74% and 73% a year ago. Corn in the dough stage hit 25% against a 22% average. Soybeans setting pods reached 47% against a 39% average — eight points ahead of normal, and eight points ahead of last year at the same date.
Evidence:
| Stage (18 states) | Jul 26, 2026 | Jul 19, 2026 | Jul 26, 2025 | 5-yr avg |
|---|---|---|---|---|
| Corn silking | 78 | 59 | 73 | 74 |
| Corn dough | 25 | 13 | 24 | 22 |
| Soybeans blooming | 80 | 66 | 74 | 74 |
| Soybeans setting pods | 47 | 32 | 39 | 39 |
Source: USDA NASS, Crop Progress, released Jul 27, 2026.
A crop that is early is usually a crop that got planted on time into warm soil, which is a good thing. A crop that is early and losing condition in short moisture is a different animal: heat is pulling it through its reproductive stages faster than it can fill them. Silking jumped 19 points in a single week. Pod set jumped 15. Those are not the increments of a crop taking its time.
That distinction matters for which USDA report the damage shows up in. Kernel count is set at and just after pollination, and an early-August survey can measure it — objective yield plots count ears and kernel rows in the field. Kernel depth and test weight are set over the following six weeks of grain fill and cannot be measured yet by anyone. If the moisture deficit persists through August, the mechanism doing the damage is the one USDA's first survey is least able to see.
Ground Truth: Expect the August Crop Production report to cut yield by less than the ratings decline implies, and expect the cuts to keep coming in September, October and the January final. A four-point condition break in late July, on a crop this far ahead of schedule and this short of topsoil moisture, is a grain-fill story wearing a pollination story's clothes. Trade the August number as an opening bid, not a settlement.
3. The market got there first
What's new: December corn is at $4.56, up 13.51% in a month and 17.23% on the year. Soybeans are at $12.10, up 9.10% on the month and 23.21% on the year, after touching $12.50 on July 24 — a two-year high. The condition break did not start this move. The move started before the ratings did.
Evidence: What the month has been worth on a per-acre basis, before any yield change at all:
| Yield assumption | Price ~Jun 28 | Price Jul 28 | Revenue Δ/acre | |
|---|---|---|---|---|
| Corn | 180 bu/ac | $4.02* | $4.56 | +$98 |
| Soybeans | 55 bu/ac | $11.09* | $12.10 | +$55 |
Source: Trading Economics front-month corn and soybean prices, accessed Jul 28, 2026. *Prior-month prices derived from the reported month-over-month percentage change, not separately quoted prints.
Set that against what a yield loss is worth. Five bushels off a 180-bushel corn crop at $4.56 is $22.82 an acre. The month's price move is worth more than four times that. For a grower with unsold new-crop bushels, the rally has already more than paid for a moderate yield disappointment — and it has done so while the disappointment is still hypothetical.
There is a real caveat attached, and it is not the crop. Trading Economics attributes part of the recent pullback from a five-week high of $4.64 to weaker crude oil after US–Iran de-escalation, which trims ethanol and biodiesel demand expectations. The energy complex has been the swing input to both corn and soybean pricing for a year. A grain rally that is partly an energy rally does not have to survive a further crude break just because the corn crop stays dry.
63%
National corn good-to-excellent for the week ending July 26 — down four points in a week, ten points below a year ago, and the lowest reading of the 2026 season. (USDA NASS Crop Progress, Jul 27, 2026)
Market read: ADM — Hold. A smaller but better-priced corn crop is roughly neutral for a processor that earns on volume and spreads rather than flat price; the soybean move to a two-year high is the more relevant variable, and it cuts both ways through the crush.
4. The terms of trade improved — but read the whole series
This is the number that belongs to this publication's beat, and it is the one that should drive an actual decision. Nitrogen is priced per pound; corn is priced per bushel. The ratio between them — how many pounds of nitrogen a bushel of corn buys — is what determines whether next year's rate decision is a comfortable one or an argument.
Anhydrous ammonia averaged $967/ton in DTN's July 22 survey, 11% below a month earlier and under $1,000 for the first time in 17 weeks. At 82% N, that is $0.59 per pound of nitrogen.
| Corn ($/bu) | Anhydrous ($/lb N) | lb N per bushel | ||
|---|---|---|---|---|
| Jul 2025 | 3.89* | 0.468* | 8.3 | ██████████ |
| Jun 2026 | 4.02* | 0.663* | 6.1 | ███████ |
| Jul 2026 | 4.56 | 0.590 | 7.7 | █████████ |
Source: Corn — Trading Economics, Jul 28, 2026. Anhydrous — DTN/Progressive Farmer Retail Fertilizer Trends, Jul 22, 2026 (survey week of Jul 13–17). *Prior-period values derived from the reported month-over-month and year-over-year percentage changes rather than separately quoted prints; treat them as approximations of the level, not as prints.
The one-month improvement is large: a bushel bought 6.1 pounds of nitrogen in late June and buys 7.7 today, a 27% swing in the grower's favor in four weeks. Both legs moved the right way at once, which is unusual — normally corn rallies because something went wrong, and the thing that went wrong pushes input costs up with it.
But the full series says something less cheerful. A bushel bought 8.3 pounds of nitrogen a year ago. The last month has recovered roughly two-thirds of a deterioration that took twelve months to build. Anhydrous is still 26% more expensive than it was last July while corn is up 17%. The terms of trade are better than June and worse than 2025, and a grower who anchors on the June low will conclude the wrong thing about how good this is.
Ground Truth: The improvement is real but it is not yet a prepay signal. Anhydrous has fallen six straight weeks and the wholesale complex that leads it fell first and harder — retail is a lagging leg, and lagging legs do not stop lagging because the ratio got comfortable. The case for waiting is that retail N still has room to converge downward toward a wholesale market that has already repriced. The case for acting is entirely about the corn side: if the crop problem resolves and corn gives back the month's 13.5%, today's 7.7 pounds per bushel drops back to roughly 6.8 without anhydrous moving a cent. That is the risk actually being run here, and it is a corn risk, not a fertilizer risk.
5. What to watch, in order
The August Crop Production report is the first yield estimate of the season built on farmer surveys and objective field measurement rather than a trend assumption. It is the largest scheduled information event between now and harvest, and on this crop it will be a partial answer at best.
The next two Crop Progress reports. One four-point drop is a data point; three consecutive declines through the first half of August, with topsoil moisture staying short, is a trend that reaches grain fill. Watch the excellent category specifically — it moved first this week, and it is the least noisy of the five.
Retail nitrogen's seventh week. DTN's next print is expected around July 29. Six straight lower weeks with the wholesale complex still soft argues for a seventh. A flat or higher print would be the first real evidence retail has found its floor, and it would change the prepay calculus more than another down week would.
Crude oil. The cleanest non-agricultural read on whether this grain rally holds. Both the corn and soybean moves carry an energy-demand component; if that component unwinds, the crop has to carry the price on its own, and a 63% crop is not obviously good enough to do that.
One sunk cost is worth stating plainly to close. The 2026 fertilizer bill was spent months ago, and nothing in the July 27 Crop Progress report changes a dollar of it. What the last four weeks changed is the revenue side of 2026 and the input side of 2027 — both favorably, and so far both by more than the ratings damage has cost.
References
- USDA NASS, Crop Progress, released Jul 27, 2026 (week ending Jul 26, 2026) — https://esmis.nal.usda.gov/publication/crop-progress
- USDA NASS, Crop Progress, releases of Jul 6, Jul 13 and Jul 20, 2026 — https://esmis.nal.usda.gov/publication/crop-progress
- Trading Economics, corn commodity price and forecast page, accessed Jul 28, 2026 — https://tradingeconomics.com/commodity/corn
- Trading Economics, soybeans commodity price page, accessed Jul 28, 2026 — https://tradingeconomics.com/commodity/soybeans
- DTN/Progressive Farmer, Fertilizer Prices Continue Downward Trend, Jul 22, 2026 (retail survey week of Jul 13–17) — https://www.dtnpf.com/agriculture/web/ag/crops/article/2026/07/22/fertilizer-prices-continue-downward
Disclosures
Crop Root Zone is an independent publication. Nothing here is investment advice. Market calls, where included, reflect the editors' own read and are not a recommendation to buy or sell any security.
Corn's Biggest Customer Can't Say No: What a $0.54 Rally Does to a Feedlot That's Already Underwater
Cattle on feed is up 2% and June marketings were the lowest for the month since 1996. Feedlot breakevens now exceed $250/cwt against a record $246.91 fed steer — so the corn rally lands on equity, not on demand, and the corn market loses its usual shock absorber going into August.
USDA put 11.4 million head on feed in 1,000-plus-head lots on July 1, up 2% from a year ago, with June marketings of 1.66 million head — the lowest June in a series that starts in 1996. Purdue's Michael Langemeier, writing in farmdoc daily on July 10, projects feedlot net returns from mid-2026 through mid-2027 in a range from negative $100 a head to breakeven, against breakeven costs he expects to exceed $250/cwt. The five-market average fed steer is at a record $246.91.
Corn just rallied 13.5% in a month. Every cent of that lands on a customer that is already losing money and cannot buy fewer cattle to escape it.
1. The corn market's largest domestic use is also its least price-sensitive right now
What's new: USDA's July WASDE pegged 2026/27 feed and residual use at 6.1 billion bushels and cut new-crop ending stocks by 170 million bushels to 1.79 billion, citing stronger than expected feed demand in the current marketing year. Feed is doing the work on the demand side of the corn balance sheet, and it is doing it while the animals eating the corn are unprofitable.
Evidence: The July 1 Cattle on Feed report says the pipeline is full and slowing at the same time:
| Cattle on Feed, Jul 1 2026 | Level | vs year ago |
|---|---|---|
| On feed, 1,000+ head lots | 11.4 mil head | +2% |
| On feed, all feedlots | 13.2 mil head | +2% |
| June placements | 1.43 mil head | −2% |
| June marketings | 1.66 mil head | −3% |
| Steers on feed | 7.12 mil head | +3% |
| Heifers on feed | 4.25 mil head | <+1% |
Source: USDA NASS, Cattle on Feed, released Jul 24, 2026 (inventory as of Jul 1).
That combination — inventory up, placements and marketings both down — describes cattle sitting in the yard longer, not more cattle entering. Placements are falling because the calf crop behind them is small. The corn those animals eat is committed at the moment the calf is placed, and it is eaten on a biological schedule that a futures rally does not accelerate or delay.
Ground Truth: The corn market's usual demand-side brake is disabled this year. In a normal rally, high corn prices pull feedlot bids for feeders down, placements slow, and feed demand rations itself — that negative feedback is part of why corn rallies fail. In 2026 the number of animals is set by a calf crop born two years ago, not by the price of corn. Feed demand will absorb this rally without shrinking. That removes a shock absorber from the corn market precisely as it goes into an August yield report on a 63%-rated crop.
2. What the rally actually costs a pen
What's new: Langemeier's sensitivity work gives a clean coefficient: a $0.10 per bushel increase in corn raises the feeding cost of gain by $0.99 per hundredweight, and changes in corn prices explain about two-thirds of the variation in cost of gain. Corn has moved roughly $0.54 a bushel in a month.
Evidence: Run the coefficient forward. That coefficient implies about 5.5 pounds of corn per pound of gain — a plausible conversion for a high-concentrate finishing ration, which is a useful check that the number behaves sensibly before it is leaned on.
| Value | Basis | |
|---|---|---|
| Corn move, Jun 28 → Jul 28 | +$0.54/bu | Trading Economics, +13.51% MoM |
| Cost-of-gain sensitivity | +$0.99/cwt per $0.10/bu | farmdoc daily, Jul 10, 2026 |
| Cost-of-gain impact | +$5.35/cwt of gain | derived |
| Gain per head (750 → 1,300 lb) | 5.5 cwt | assumption, stated |
| Impact per head | ≈ +$29 | derived |
Source: Michael Langemeier, "Trends in Cattle Finishing Breakeven Prices and Net Returns," farmdoc daily (16):121, Jul 10, 2026; corn move from Trading Economics, accessed Jul 28, 2026. Per-head figures are derived from the published sensitivity, not separately reported.
Twenty-nine dollars a head is not catastrophic in isolation. It matters because of where it lands. Feeding cost of gain has run $101 to $104 per cwt through 2026, and Langemeier expects $100 to $105 for the balance of the year. A $5.35 addition is roughly 5% of the entire cost of putting weight on an animal, arriving in four weeks, into a projected return range whose best case is zero.
−$100 to $0
Projected feedlot net return per head, second half 2026 through first half 2027, against breakevens expected to exceed $250/cwt. (farmdoc daily (16):121, Jul 10, 2026)
The same sensitivity work makes clear how little room a feedlot has to manage around this. Ranked by what a $5.35-per-cwt corn shock would require to offset it:
| Lever | Sensitivity | Needed to offset +$5.35/cwt |
|---|---|---|
| Feed conversion | +0.10 conversion = +$2.08/cwt | improve conversion by ~0.26 |
| Roughage cost | +$5/ton alfalfa = +$0.54/cwt | alfalfa $49/ton cheaper |
| Corn price | +$0.10/bu = +$0.99/cwt | corn back to $4.02 |
Source: Michael Langemeier, farmdoc daily (16):121, Jul 10, 2026. Offset column is derived from the published sensitivities.
Improving feed conversion by a quarter of a point is not a decision; it is a multi-year genetics-and-management outcome, and a hot, dry August works against it. Roughage would have to fall by nearly $50 a ton, which is not on offer in a year of short moisture. The only lever with real magnitude is the corn price itself, and that is the one the feedlot does not control. Distillers grains and other co-products are the genuine partial hedge — they are priced off corn but not identically — and their share of the ration is bounded by sulfur and fat limits well below the level that would neutralize a move of this size.
3. Breakevens went up a staircase and never came back down
What's new: The breakeven series is the clearest picture in the cattle complex of what 2022–26 did to the cost structure of finishing an animal.
Evidence:
| Period | Breakeven ($/cwt) | |
|---|---|---|
| 2023 average | 174 | ███████ |
| 2024 average | 192 | ████████ |
| 2025 average | 205 | ████████ |
| Q1 2026 | 248 | ██████████ |
| Q2 2026 | ~242 | ██████████ |
| H2 2026 – H1 2027 (proj.) | >250 | ██████████ |
Source: Michael Langemeier, farmdoc daily (16):121, Jul 10, 2026. Q2 and forward figures are the author's estimates and projections rather than settled averages.
Breakevens rose 44% in three years. Against that, the record $246.91 five-market fed steer buys $3,209 on a 1,300-pound animal, while a $250 breakeven costs $3,250. The record price is a losing price. That is the whole story of the 2026 cattle market in one subtraction, and it is why "record cattle prices" and "feedlots losing money" appear in the same week's headlines without contradiction.
The 2025 comparison sharpens it. Net returns averaged roughly $250 a head across 2025, and between January and October 2025 ran $143 to $541 a head with a $312 average. Then December 2025 through March 2026 turned to outright losses, April recovered to +$204 and May to +$297, and the forward projection is negative. This is a business that made a decade's money in ten months and is now handing part of it back.
4. Where the cheap corn actually went
What's new: Feedlots got a genuine corn break earlier this year — harvest-delivery corn futures fell roughly 20% over a stretch of late June, with soybean meal off 7.5%. Feeding cost of gain barely moved. That is not an accounting error; it is the market working exactly as theory says it should.
Evidence: The transfer shows up in the feeder-to-fed cattle price ratio, which measures what a feedlot pays for an incoming animal relative to what it sells the finished one for.
| Feeder-to-fed price ratio | Value |
|---|---|
| Long-run average, Jan 2016 – present | 1.242 |
| Nov 2025 – Mar 2026 | 1.42 – 1.54 |
| Apr – May 2026 | 1.35 |
Source: Michael Langemeier, farmdoc daily (16):121, Jul 10, 2026.
A ratio well above its long-run average means the feeder calf is expensive relative to the fed animal it becomes. When corn gets cheaper, a feedlot can afford to bid more for a calf — and in a market where calves are genuinely scarce, it must, because the pen has to be filled and someone else will bid. The corn saving gets competed away into the calf price before it ever reaches the feedlot's income statement.
Ground Truth: Cheap corn in a tight-cattle year is a cow-calf subsidy, not a feedlot subsidy. The scarce factor captures the surplus, and in 2026 the scarce factor is the calf, not the corn. The practical implication runs the other way too, and it is the one worth holding onto: because the transfer already happened on the way down, a corn rally on the way back up does not get handed back. Feeder prices are set by calf supply, and calf supply does not fall because December corn went to $4.56. The feedlot ate the benefit going down only partially and eats the cost coming up in full.
5. What this means for a grain operation
Three practical reads, in descending order of confidence.
Feed demand is not the thing that breaks a corn rally this year. If you are marketing 2026 corn and watching for the demand destruction that normally caps a weather rally, look at ethanol and exports, not at feed. The feed number is being set by an animal inventory that is already placed and already up 2%. Ethanol is the genuinely price-sensitive leg, and it is currently more exposed to crude oil than to corn.
Basis in cattle country is the place this shows up first. Feedlots facing negative projected returns and a rising ration cost have every incentive to buy hand-to-mouth and lean on cheaper co-products. Local corn basis around feeding regions is where a grain seller will see feedlot financial stress before it appears in any national statistic.
The 2027 placement number is the one to watch, not the 2026 one. A year of negative finishing returns will eventually reduce what feedlots will bid for calves, which slows placements, which is the mechanism that finally does ration feed demand. That is a 2027 story at the earliest. USDA's July cattle report already reads as a herd stabilizing rather than one still contracting; if that holds, the calf-supply constraint loosens on roughly the same timeline. Nothing about it helps the corn balance sheet between now and January.
References
- USDA NASS, Cattle on Feed, released Jul 24, 2026 (inventory as of Jul 1, 2026) — https://esmis.nal.usda.gov/sites/default/release-files/795993/cofd0726.pdf
- Michael Langemeier, "Trends in Cattle Finishing Breakeven Prices and Net Returns," farmdoc daily (16):121, Department of Agricultural and Consumer Economics, University of Illinois, Jul 10, 2026 — https://farmdocdaily.illinois.edu/2026/07/trends-in-cattle-finishing-breakeven-prices-and-net-returns.html
- USDA WASDE, Jul 10, 2026, as reported by DTN/Progressive Farmer, USDA Lowers New-Crop Corn Ending Stocks, Forecasts Record-Large US Soybean Crop, Jul 10, 2026 — https://www.dtnpf.com/agriculture/web/ag/news/article/2026/07/10/usda-releases-july-crop-production-3
- Trading Economics, corn commodity price page, accessed Jul 28, 2026 — https://tradingeconomics.com/commodity/corn
- USDA ERS, Livestock, Dairy, and Poultry Outlook, LDP-M-385, July 2026 — https://www.ers.usda.gov/media/29361/ldp-m-385.pdf
Disclosures
Crop Root Zone is an independent publication. Nothing here is investment advice. Market calls, where included, reflect the editors' own read and are not a recommendation to buy or sell any security.
Diesel Went Up 73 Cents in Three Weeks. Your Delivered Fertilizer Price Hasn't Caught Up Yet.
On-highway diesel ran $4.58 to $5.31 between July 6 and July 27 while wholesale nutrient prices fell — so the delivered ton and the quoted ton are now moving in opposite directions, and only one of them appears in the retail survey.
The national average on-highway diesel price was $4.58 per gallon on July 6. Three weeks later, on July 27, it was $5.31 (U.S. Energy Information Administration, weekly series). That is a 73-cent move, up 16%, and it broke a nine-week decline. USDA's Grain Transportation Report caught the middle of it: the week ending July 22 posted $5.134 per gallon, up 33.8 cents in a single week and 132.2 cents above the same week a year earlier — the largest weekly jump since early May (USDA Grain Transportation Report, Jul 23, 2026). Over the same three weeks the nutrient complex was doing the opposite: DTN's retail survey has anhydrous down $5 and UAN28 down $7 in the most recent week alone (DTN/Progressive Farmer, Jul 29, 2026). Two costs inside the same delivered ton, moving in opposite directions, and only one of them gets surveyed.
1. What a truck actually costs to run right now
What's new: The American Transportation Research Institute's 2026 operational cost report puts the industry-average cost of operating a Class 8 truck at $2.336 per mile — 3.4% higher than the prior year and the highest per-mile figure in the report's history. Excluding fuel, costs rose 4.2% to $1.854 per mile (ATRI, An Analysis of the Operational Costs of Trucking: 2026 Update).
Evidence: The composition matters more than the headline, because the components are not moving together.
| Cost line | Direction | Note |
|---|---|---|
| Fuel | ~$0.482/mile in the survey year | Stable then — not stable now |
| Repair & maintenance | +8.6% | Largest single-category increase |
| Tolls | +13.2% to $0.043/mile | Northeast $0.079, West $0.021 |
| Driver benefits | Up | +4.5% in Q1 2026 |
| Insurance | Up | +6.4% in Q1 2026 |
| Permits & licenses | Flat | The only category that did not rise |
Source: ATRI, 2026 Analysis of the Operational Costs of Trucking, July 2026, including its Q1 2026 early-indicator figures.
The survey year's fuel line of roughly $0.482 per mile was struck when diesel was materially cheaper than it is today. At $5.31 diesel and a working 6.5 mpg for a loaded Class 8, fuel alone runs about $0.817 per mile — which is why the delivered-cost question in late July is not the question ATRI's headline answers.
$2.336/mile
Industry-average all-in Class 8 operating cost — the highest in the report's history, and struck before the July diesel move. (ATRI, 2026 Analysis of the Operational Costs of Trucking)
2. Running it through a real load
What's new: Convert per-mile into per-ton and the number stops being abstract.
Evidence: Take a standard dry-fertilizer hopper haul — 25 tons of product, terminal to farm, 100 loaded miles, deadheading back, so 200 total miles billed against 25 tons of freight. At 6.5 mpg that is 30.8 gallons.
| Diesel price | Fuel cost, 200 mi | Fuel $/ton of product | Δ vs Jul 6 |
|---|---|---|---|
| $4.58 (Jul 6) | 140.92 | 5.64 | — |
| $4.80 (Jul 13) | 147.69 | 5.91 | +0.27 |
| $5.13 (Jul 20) | 157.85 | 6.31 | +0.67 |
| $5.31 (Jul 27) | 163.38 | 6.54 | +0.90 |
Source: diesel prices from EIA weekly on-highway series, Jul 6-27, 2026. Load, mileage, fuel-economy and deadhead assumptions are Crop Root Zone's own; the $/ton column is a worked illustration, not a survey figure.
Ninety cents a ton on a 100-mile haul. Stretch it to 250 miles each way — not unusual for a farm buying off a river terminal rather than a local retailer — and the same three weeks add roughly $2.25 per ton.
| Haul length (loaded) | Fuel $/ton at $4.58 | at $5.31 | Δ | |
|---|---|---|---|---|
| 50 mi | 2.82 | 3.27 | +0.45 | ██ |
| 100 mi | 5.64 | 6.54 | +0.90 | ████ |
| 175 mi | 9.87 | 11.44 | +1.57 | ███████ |
| 250 mi | 14.10 | 16.35 | +2.25 | ██████████ |
Source: Crop Root Zone calculation from EIA weekly diesel prices, Jul 6 and Jul 27, 2026; 25-ton load, 6.5 mpg, round-trip miles billed. Bars scaled to the largest delta.
Ground Truth: The three-week diesel move is worth roughly what one week of the retail nitrogen decline was worth — and unlike the nitrogen decline it applies to every ton, including the phosphate and potash tons that are printing higher. A grower reading "fertilizer prices continue lower" off the retail survey while sourcing from a distant terminal has been handed a headline about one line item while a second line item moved the other way. The two are not the same size, but they are the same order of magnitude, and only one is in the survey.
3. Why this shows up late, and unevenly
What's new: Freight cost does not reach the farm gate on the same clock as nutrient cost, because the two travel through different contracts.
Evidence: Retail fertilizer is typically quoted delivered, with freight embedded. Where a fuel surcharge exists, it is usually indexed to a lagging published diesel average — most commonly the EIA weekly national or regional number, applied on a one-week or one-month lag, in bracketed steps rather than continuously. Three consequences follow, and none are visible in a price survey:
- The lag is structural. A surcharge indexed to last week's EIA print is, by construction, always chasing. In a 73-cent three-week move, the surcharge collected in week three reflects week two's price.
- The brackets quantize it. Surcharge tables move in steps — commonly 5 or 6 cents of diesel per step. A 73-cent move crosses a dozen or more steps, but it crosses them at boundaries rather than smoothly, so pass-through arrives in visible jumps that read as price increases rather than fuel adjustments.
- Distance sorts the winners. The grower 40 miles from a blender absorbs roughly a third of what the grower 175 miles from a river terminal absorbs. Regional retail spreads widen during a fuel spike for reasons that have nothing to do with nutrient supply.
The same fuel move is hitting the water and rail legs upstream. USDA reported 691,198 tons of grain moved by barge in the week ending July 18 on 453 downbound barges, in a market where the July shuttle secondary railcar market sat $100 below tariff per car while non-shuttle cars traded $300 above tariff (USDA Grain Transportation Report, Jul 23, 2026). Non-shuttle is where most fertilizer moves.
Ground Truth: That $300-above-tariff non-shuttle bid is the more interesting number in the report, and it is the one nobody quotes. Shuttle service — high-volume, unit-train, grain-shaped — is trading at a discount. Non-shuttle single-car and manifest service, which is how fertilizer actually reaches an inland terminal, is trading at a premium. The spread says the flexible, small-lot rail capacity fertilizer depends on is scarcer than the bulk capacity grain depends on, and cheaper diesel will not fix it.
4. The decision this actually changes
What's new: For most operations the answer to a fuel spike is not to change supplier. It is to change timing and lot size — and both have a calculable value.
Evidence: Two levers, sized against the numbers above.
Lot size. The per-ton figures above assume a full 25-ton load. A half-load carries the same fuel bill across half the tons. On a 100-mile haul at $5.31 diesel that is $6.54/ton at full load and $13.08/ton at half — a $6.54 penalty for splitting a delivery, which is more than seven times the entire three-week diesel move. The fuel spike is real. Splitting loads is worse.
Timing. Diesel's run reversed a nine-week decline, and the July 6 low of $4.58 was the bottom of it. Whether $5.31 is a new level or an overshoot is not knowable from a three-week series. What is knowable is the asymmetry: the cost of taking delivery early is storage and working capital; the cost of taking delivery into a spike is the spike.
| Consideration | Favors delivery now | Favors waiting |
|---|---|---|
| Diesel at $5.31, +132 cents YoY | ✓ if it retraces | |
| Nine-week decline just broken | ✓ trend now up | |
| Nutrient side: N decelerating, P/K rising | ✓ | |
| Non-shuttle rail $300 over tariff | ✓ capacity tight | |
| Fall application window compressing | ✓ | |
| Storage and working-capital cost | ✓ |
Source: EIA weekly diesel, Jul 6-27, 2026; USDA Grain Transportation Report, Jul 23, 2026; DTN/Progressive Farmer, Jul 29, 2026.
Ground Truth: Four of the six lines point one way, and the two that don't both rest on the same bet — that a three-week, 16% fuel move retraces before the fall application window closes. The freight-side case for positioning product early is currently stronger than the nutrient-side case, which reverses the position most buyers have held all summer. The grower who has been waiting out the nitrogen slide should notice that the reason to wait weakened at exactly the moment the reason to move got stronger.
5. What to watch
The diesel series is weekly and public, which makes it the rare input where a farm buyer and a fertilizer retailer see the same number at the same time. Three things would change the read:
- A retrace below $4.90. That puts the July run back inside ordinary summer volatility and makes the surcharge question academic. Nothing in a three-week series says whether it happens.
- A further leg above $5.50. There, the per-ton freight move on a long haul starts to rival a full month of nutrient price change, and delivered quotes begin to diverge visibly from published retail averages.
- The non-shuttle railcar spread. If the $300-over-tariff premium widens into fall, the rail leg rather than the truck leg becomes the binding constraint on inland positioning — and that one is immune to the diesel price entirely.
References
- U.S. Energy Information Administration, Weekly Retail On-Highway Diesel Prices, July 6, 13, 20 and 27, 2026. https://www.eia.gov/petroleum/gasdiesel/
- USDA Agricultural Marketing Service, Grain Transportation Report, Jul 23, 2026 (week ending Jul 22).
- American Transportation Research Institute, An Analysis of the Operational Costs of Trucking: 2026 Update, Jul 2026. https://truckingresearch.org/2026/07/new-atri-report-details-accelerating-costs-and-low-profitability-despite-cuts/
- Bulk Transporter, "ATRI: Trucking expenses hit record $2.336 per mile," Jul 2026. https://www.bulktransporter.com/fleet-management/news/55391667/atri-trucking-expenses-hit-record-2336-per-mile
- DTN/Progressive Farmer, "Fertilizer Prices Keep Sliding as UAN32 Leads 4 Nutrients in Significant Drops," Jul 29, 2026. https://www.dtnpf.com/agriculture/web/ag/crops/article/2026/07/29/fertilizer-prices-keep-sliding-uan32
Disclosures
Crop Root Zone is an independent publication. Nothing here is investment advice. Market calls, where included, reflect the editors' own read and are not a recommendation to buy or sell any security.
The July Diesel Spike Added $21 an Acre to a Rice Flood — and Nobody Sent a Bill
Pumping cost is pure fuel cost, so it moves the day diesel moves. At $5.31 diesel a well-irrigated rice acre now costs $188 to water, and the last three inches of that flood cost $23 — which is the number that should decide whether they go on.
Irrigation is the one major field cost with no lag in it. There is no contract, no surcharge table, no quarterly settlement — a pump burns fuel at today's price, and when diesel moves, the cost of water moves the same day and by the same percentage. Between July 6 and July 27 the national on-highway diesel average went from $4.58 to $5.31 per gallon, a 16% move that broke a nine-week decline (U.S. Energy Information Administration, weekly series). Every irrigated acre in the country got 16% more expensive to water in three weeks, and no invoice announced it. Published pumping budgets make it possible to say exactly how much.
1. The budgets are linear, which means they can be priced at today's diesel
What's new: Southern Ag Today published a fuel-price sensitivity for irrigation pumping on July 20, covering surface and well systems across a $1.50-$6.00 per gallon diesel range (Deliberto, Michael, and Stacia Davis-Conger, Southern Ag Today 6(30.1), Jul 20, 2026).
Evidence: Their scenarios are strictly proportional to fuel price — pumping cost is fuel cost, and nothing else in the budget varies with it. The published endpoints confirm it: surface rice at 24 acre-inches runs $44.19/acre at $1.50 diesel and $176.74/acre at $6.00, a ratio of exactly 4.0 against a fuel-price ratio of exactly 4.0. The authors' own mid-range checkpoints land on the same line: $88.38/acre at $3.00 and $147.30/acre at $5.00.
That proportionality is useful, because it means the published table can be evaluated at the actual weekly diesel prints instead of at round numbers nobody paid.
| System / crop | Acre-inches | Jul 6 $4.58 |
Jul 13 $4.80 |
Jul 20 $5.13 |
Jul 27 $5.31 |
Δ 3 wks |
|---|---|---|---|---|---|---|
| Surface, row crop | 10.5 | 59.02 | 61.86 | 66.11 | 68.43 | +9.41 |
| Well, row crop | 10.5 | 70.83 | 74.24 | 79.34 | 82.12 | +11.29 |
| Surface, rice | 24 | 134.93 | 141.41 | 151.13 | 156.43 | +21.50 |
| Well, rice | 24 | 161.86 | 169.63 | 181.29 | 187.66 | +25.80 |
Source: cost-per-dollar-of-diesel coefficients derived from Deliberto & Davis-Conger, Southern Ag Today 6(30.1), Jul 20, 2026 (100 hp/2,500 GPM surface; 120 hp/2,500 GPM well); diesel prices from EIA weekly on-highway series. Dollar figures at each weekly price are Crop Root Zone's calculation from the published linear relationship, not published values.
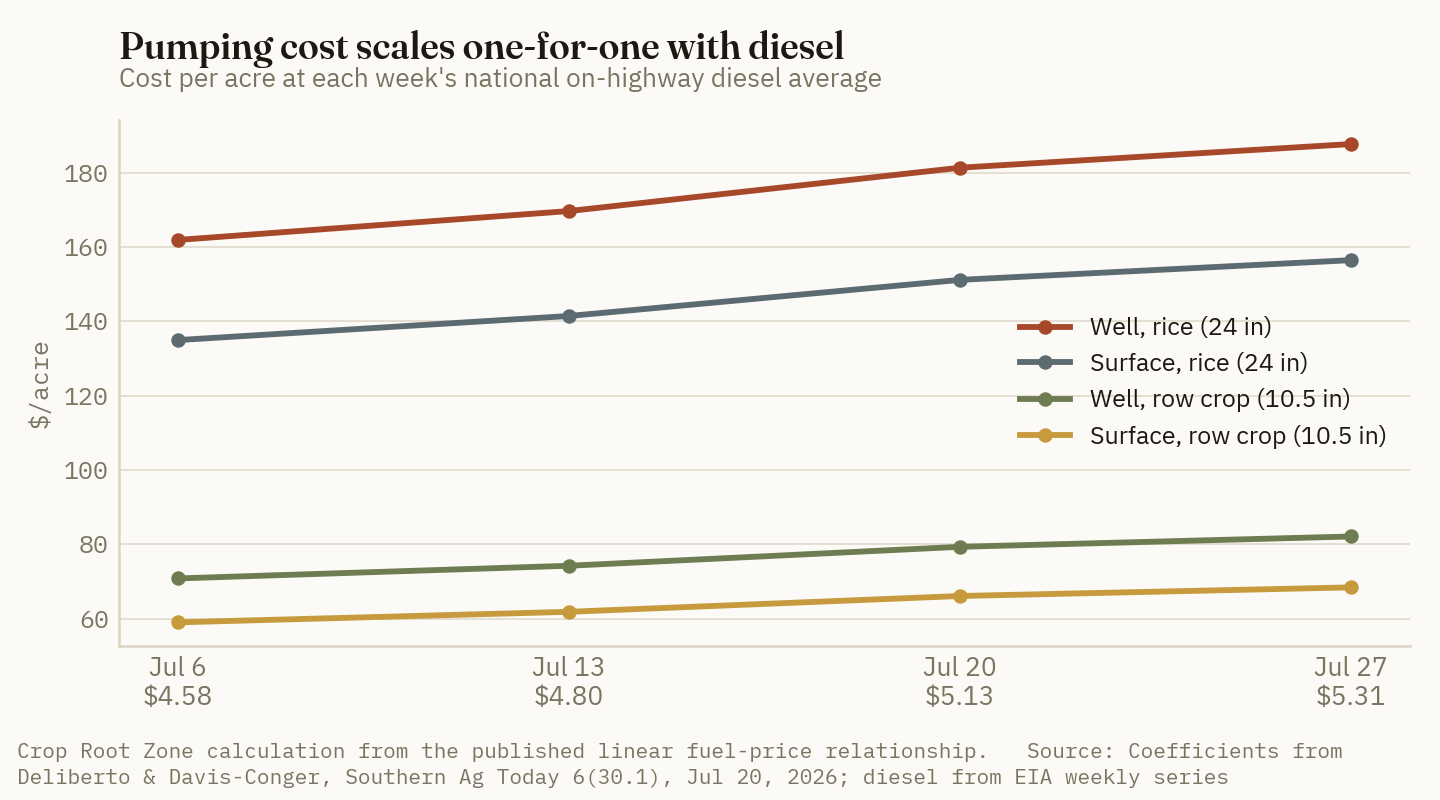
2. What three weeks actually cost
What's new: The spread between systems is as large as the move itself.
Evidence:
| System / crop | Added cost, Jul 6 → Jul 27 | |
|---|---|---|
| Well, rice (24 in) | +$25.80/acre | ██████████ |
| Surface, rice (24 in) | +$21.50/acre | ████████ |
| Well, row crop (10.5 in) | +$11.29/acre | ████ |
| Surface, row crop (10.5 in) | +$9.41/acre | ████ |
Source: Crop Root Zone calculation from Southern Ag Today coefficients (Jul 20, 2026) and EIA weekly diesel prices, Jul 6 and Jul 27, 2026. Bars scaled to the largest delta.
On a 1,200-acre rice operation pumping from wells, three weeks of diesel added roughly $31,000 to the season's pumping bill. Nothing about the crop, the schedule, or the equipment changed.
Ground Truth: Irrigation is the largest field cost that never appears in a price survey, never gets quoted, and never triggers a purchasing decision — which is exactly why it absorbs shocks silently. A grower who spent July watching the fertilizer market fall $5 a ton was, over the same weeks, absorbing a $21-26 per acre increase on the rice ground. Measured per acre rather than per ton, the fuel move was the larger event of the month by a wide margin, and it was the one nobody was tracking.
3. The marginal acre-inch is the decision
What's new: Season totals are the wrong unit for the decision actually in front of an irrigator in August. The right unit is the cost of the next pass.
Evidence: Divide through:
| System | $/acre-inch at $4.58 | at $5.31 | Cost of the last 3 inches at $5.31 |
|---|---|---|---|
| Surface | 5.62 | 6.52 | $19.56/acre |
| Well | 6.75 | 7.82 | $23.46/acre |
Source: Crop Root Zone calculation from Southern Ag Today coefficients (Jul 20, 2026) and EIA weekly diesel prices. Per-acre-inch figures follow directly from the published per-acre budgets divided by the stated application depths.
$7.82
What one acre-inch of well-pumped water costs at $5.31 diesel — up from $6.75 three weeks earlier. (Crop Root Zone calculation from Southern Ag Today, Jul 20, 2026 and EIA weekly diesel)
Three more inches on a well system is $23.46 an acre. Priced against corn near $4.40 a bushel, that pass has to buy about 5.3 bushels to break even; on rice, the equivalent threshold scales with the crop price and the depth applied. That is not an obviously easy hurdle late in the season, and it is not an obviously hard one either — which is the point. It is a calculation, and at $4.58 diesel it was a materially different calculation than at $5.31.
Ground Truth: The last irrigation of the season is the one most likely to be applied out of habit and least likely to be justified by yield response, and it is now the most expensive one to get wrong. Late-season water on a crop that has already made its yield is a $20-23 per acre decision that returns nothing, and the fuel move just widened the penalty by 16% without changing anyone's agronomic instinct. If there is one place to spend an hour with a soil-moisture probe this month rather than a spreadsheet, it is here.
4. How the water bill compares to the fertility bill
What's new: Pumping is routinely filed under "overhead" while fertility is scrutinized line by line. At current prices that allocation of attention is backwards on irrigated ground.
Evidence: Build a representative corn fertility program at DTN's July 29 retail prints — anhydrous ammonia at $0.59/lb N, DAP at $913/ton ($0.992/lb P₂O₅), potash at $494/ton ($0.412/lb K₂O) — for a 180 bu/acre goal at 180 lb N, 60 lb P₂O₅ and 60 lb K₂O:
| Line item | Rate | $/acre |
|---|---|---|
| Nitrogen (anhydrous) | 180 lb N | 106.20 |
| Phosphate (DAP) | 60 lb P₂O₅ | 59.52 |
| Potash | 60 lb K₂O | 24.72 |
| Total N-P-K | 190.44 | |
| Pumping, surface, 10.5 in @ $5.31 diesel | 68.43 | |
| Pumping, well, 10.5 in @ $5.31 diesel | 82.12 |
Source: nutrient prices from DTN/Progressive Farmer, Jul 29, 2026 (week of Jul 20-24); pumping figures calculated from Southern Ag Today coefficients (Jul 20, 2026) at the EIA Jul 27 diesel price. Rates, yield goal and totals are Crop Root Zone's own illustration.
| Cost element | $/acre | |
|---|---|---|
| N-P-K fertility | 190.44 | ██████████ |
| Pumping, well (10.5 in) | 82.12 | ████ |
| Pumping, surface (10.5 in) | 68.43 | ████ |
| Three-week diesel move, well | 11.29 | █ |
Source: as above. Bars scaled to the fertility total.
On row-crop ground, pumping runs roughly 36 to 43% of the N-P-K bill. On the 24-inch rice systems in §1, the well-fed pumping bill of $187.66/acre is nearly the size of an entire corn fertility program — for water alone. And unlike the fertility bill, none of it can be prepaid, hedged, forward-contracted or bought on a fall fill program. It is spent at spot, in July and August, at whatever diesel costs that week.
Ground Truth: Every risk-management tool the industry has built for fertilizer — prepay, fill programs, forward contracts, storage — exists because nutrient prices move and growers wanted to fix them. Nothing equivalent exists for pumping fuel, despite it being 36-43% the size on row-crop ground and larger than that on rice. A grower with a sophisticated fertilizer purchasing strategy and no fuel position is hedged on the smaller, slower-moving half of the input bill and fully exposed on the faster one. The instruments to fix that are ordinary and available; the habit of using them is not.
5. The electric case, which has been dormant for years
What's new: Southern Ag Today's own breakeven puts electricity at $0.40/kWh as the point of indifference against $5.00 diesel, against commercial rates the authors describe as generally $0.15-$0.20/kWh.
Evidence: Scaled to the July 27 diesel print of $5.31, the indifference point moves to roughly $0.425/kWh. At a $0.18/kWh commercial rate, electric pumping runs about 42% of diesel cost.
| System / crop | Diesel at $5.31 | Electric equivalent* | Annual saving |
|---|---|---|---|
| Surface, row crop | 68.43 | ~29.0 | ~$39/acre |
| Well, row crop | 82.12 | ~34.8 | ~$47/acre |
| Surface, rice | 156.43 | ~66.3 | ~$90/acre |
| Well, rice | 187.66 | ~79.5 | ~$108/acre |
Source: diesel figures calculated from Southern Ag Today coefficients (Jul 20, 2026) at the EIA Jul 27 diesel price. *Electric equivalents are Crop Root Zone estimates, derived by scaling the authors' stated $0.40/kWh-at-$5.00-diesel indifference point to $5.31 diesel and applying a $0.18/kWh commercial rate. They are a modeled ratio, not a metered result, and actual electric cost depends on the rate schedule, demand charges, and pump efficiency at a specific site.
The caveat in that footnote is not decoration. Agricultural electric rates carry demand charges that a flat per-kWh comparison ignores, and a summer-peaking irrigation load is precisely the load a demand charge is designed to price. The honest version of the table above is that it establishes the energy saving and leaves the rate structure question open — which is a site-by-site utility conversation, not a national number.
What is national is the capital side. Converting a diesel well to electric requires a service drop, a panel, a motor and, frequently, a line extension the utility will price in the tens of thousands. Against a modeled $47/acre saving on row-crop ground, a $60,000 conversion serving 300 acres pays back in roughly four seasons at $5.31 diesel — and in roughly five at $4.58.
Ground Truth: A one-season fuel spike does not justify a capital conversion, and anyone selling one on that basis is selling the spike. What the July move does is smaller and more useful: it moves the payback period on an electric conversion from "borderline" to "ordinary," at a moment when the alternative use of that capital — machinery — is being priced by a tariffed replacement market. The conversion decision should be made on a multi-year diesel view, but the queue position with the utility should be requested now, because line-extension lead times are measured in seasons and cost nothing to hold.
6. What to watch
- Whether diesel holds above $5. The July run broke a nine-week decline; three weeks is not a trend. Every 10 cents of diesel is worth roughly $0.29/acre on a 10.5-inch surface irrigation and $0.71/acre on a 24-inch well-fed flood.
- Late-season rainfall. The cheapest acre-inch is the one that falls for free, and at $7.82 the value of a timely rain on a well-irrigated field is now measurably higher than it was in June.
- Utility line-extension quotes. These are the binding constraint on electric conversion, they are quoted per project rather than per acre, and they do not move with diesel at all.
References
- Deliberto, Michael, and Stacia Davis-Conger. "Fuel Pricing Impacts Irrigation Pumping Costs Across All Systems." Southern Ag Today 6(30.1), Jul 20, 2026. https://southernagtoday.org/2026/07/20/fuel-pricing-impacts-irrigation-pumping-costs-across-all-systems/
- U.S. Energy Information Administration, Weekly Retail On-Highway Diesel Prices, July 6, 13, 20 and 27, 2026. https://www.eia.gov/petroleum/gasdiesel/
- USDA Agricultural Marketing Service, Grain Transportation Report, Jul 23, 2026 (week ending Jul 22, diesel $5.134/gal).
- Kansas State University Research and Extension, MF2360, Comparing Irrigation Energy Costs. https://bookstore.ksre.ksu.edu/download/comparing-irrigation-energy-costs_MF2360
Disclosures
Crop Root Zone is an independent publication. Nothing here is investment advice. Market calls, where included, reflect the editors' own read and are not a recommendation to buy or sell any security.
Your Trade-In Is Appreciating and Your Replacement Is Tariffed. The Fleet Math Just Inverted.
Auction values rose 12.5% in Q1 while Deere guides North American ag equipment down another 15–20% and carries a projected $1.2 billion tariff bill. We show why the trade differential — not the list price — is now the number that decides whether an application rig stays another season.
A thirty-year-old John Deere 6500 three-wheel sprayer with 2,486 hours sold for $65,000 at a North Carolina auction in April — a record for the model (AgWeb, 2026). Machinery auction values as a whole rose 12.5% in the first quarter of 2026 against the same quarter of 2025, with tractors, planters and sprayers all showing contracting supply at auction. In the same market, Deere is guiding the North American ag equipment market down another 15% to 20% in 2026, AGCO expects the region's large agricultural sales down 15% from already-low 2025 levels, and Deere's projected tariff burden for 2026 is $1.2 billion against $600 million absorbed in fiscal 2025 (farmdoc daily, Feb 27, 2026). Those facts are usually reported as one story — "the machinery downturn" — and they are not one story. For anyone running an application fleet, they are two forces pulling the replacement decision in opposite directions, and the net effect is not what the headlines suggest.
1. The new-equipment side: a third year down, with a tariff on top
What's new: New unit sales have now fallen for two consecutive years across the categories that matter most to a row-crop operation, and the dealer channel confirms it.
Evidence: The University of Illinois farmdoc daily review of the machinery market, published February 27, 2026, laid out the run:
| Category | 2024 units | 2024 change | 2025 units | 2025 change |
|---|---|---|---|---|
| Tractors | 217,279 | −13.16% | 195,857 | −9.86% |
| Combines | 5,556 | −24.40% | 3,579 | −35.58% |
Source: farmdoc daily, University of Illinois, "The U.S. Farm Machinery & Equipment Market: Sales, Inventories, and Tariff Headwinds," Feb 27, 2026.
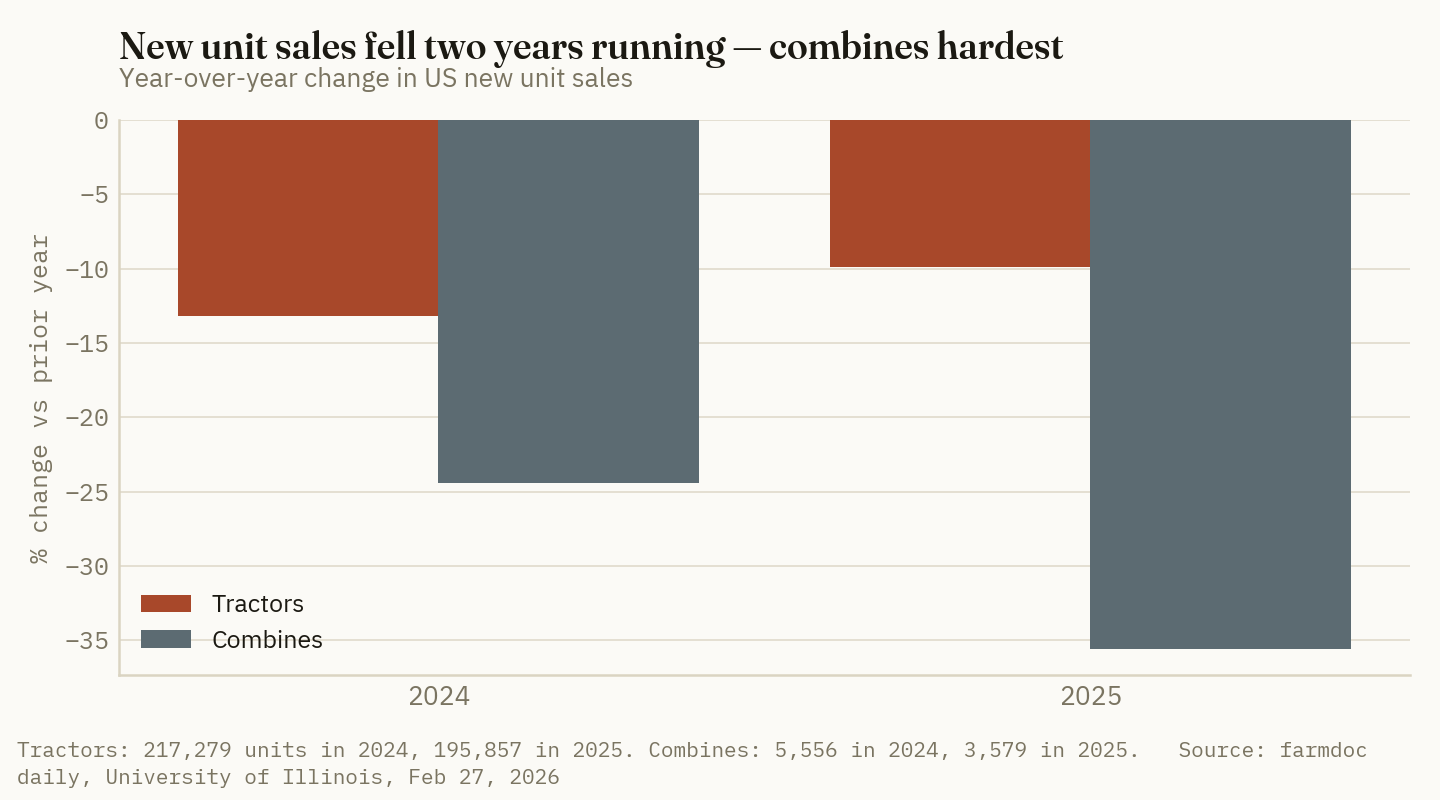
The dealer channel tells the same story from the other end: 67.5% of surveyed dealers reported new equipment sales declines of 2% or more in 2025 versus 2024, and the Creighton University Farm Equipment Sales Index stood at 16.7 in February 2026, down from 18.8 the prior month and below growth-neutral for 30 consecutive months — a run that began in October 2023 (farmdoc daily, Feb 27, 2026).
Underneath that demand collapse, the cost of building the machine went up. Tariff absorption by the three major manufacturers:
| Manufacturer | Tariff cost | Period | |
|---|---|---|---|
| Deere & Co. | $600M | Fiscal 2025 | █████ |
| Deere & Co. | $1,200M | Projected 2026 | ██████████ |
| AGCO | $40M | 2025 | █ |
| AGCO | $110M | Expected 2026 | █ |
Source: farmdoc daily, Feb 27, 2026. CNH's agriculture segment EBIT fell from $1.47 billion in 2024 to $772 million in 2025, with tariff costs a contributing factor.
Ground Truth: A doubling tariff bill inside a collapsing sales year is not a cost a manufacturer can fully pass through — but it is not one it eats quietly either. What it does is remove the discount. In a normal down cycle, a 15–20% volume decline is exactly when a buyer expects incentive money, rebate programs and aggressive trade allowances. A simultaneous tariff step is what keeps those from arriving. The practical read for a buyer waiting out the cycle for a deal: the volume signal says the deal is coming, and the cost signal says it isn't. Historically the volume signal wins eventually. It has not won yet.
2. The used side: values are going the other way
What's new: While new sales fell, auction values rose. Machinery auction values were up 12.5% in the first quarter of 2026 compared with the first quarter of 2025 (AgWeb, 2026).
Evidence: The mechanism is straightforward and worth stating plainly, because it is the whole basis of the decision: two years of weak new sales means two years of trade-ins that never happened, which means the used market is short of exactly the machines that would normally be flowing into it. Auction supply of tractors, planters and sprayers is contracting. The result is prices that make no sense against the age of the iron:
$65,000
Paid at auction in April 2026 for a thirty-year-old John Deere 6500 three-wheel sprayer with 2,486 hours — a record for the model. (AgWeb, 2026.)
A 2009 Stinger 6500 bale wagon with 53,000 miles brought $140,000 in the same month, the highest auction price on a pre-2010 model in fifteen years (AgWeb, 2026). These are not representative averages and we are not presenting them as one — they are top-end sales that illustrate where the scarcity is concentrated. The broad number is the 12.5%.
One development worth watching on the other side of the ledger: a wave of farm estate auctions is expected in coming months, a consequence of two years of low profitability and high operating expense in grain agriculture (AgWeb, 2026). Estate dispersals are the single largest potential source of new used supply, and if that wave lands in volume, the 12.5% appreciation is the thing that reverses first.
3. Working the three options honestly
What's new: Set the two forces side by side and the fleet decision reduces to three options, whose relative standing has genuinely changed.
Evidence: The critical point is that the trade differential — the cash a buyer puts on top of the trade — is being widened from both ends at once. The used machine going out is appreciating, which narrows it. The new machine coming in is carrying a doubled tariff into a year with no incentive money, which widens it more.
| Option | What the current market does to it | Direction |
|---|---|---|
| Keep and repair | Trade value is at a cyclical high, so the opportunity cost of not selling is unusually high — but parts and shop labor are also inflated, and a rig that needs a major component is a different case from one that needs maintenance | Mixed |
| Trade for new | Trade allowance is strong; list price carries a doubled tariff and thin incentive support | Worse |
| Sell outright, hire application | Captures the appreciated asset value in cash, converts a fixed cost to a variable one, and removes the timeliness control that is the entire reason most operations own an applicator in the first place | Better on cash, worse on control |
| Buy used instead of new | The classic downturn play; currently the most expensive it has been relative to new in years, because the discount that normally makes it work has evaporated | Worse |
Source: our synthesis of farmdoc daily, Feb 27, 2026 and AgWeb, 2026. Directional assessment, not a quoted market view.
The option that has quietly improved the most is the one nobody puts in a capital plan: sell the machine and do nothing else. An operation with an underused second applicator — the backup rig, the older floater kept for peak-week overlap — is holding an asset that has appreciated 12.5% in a year into a market short of exactly that machine, while carrying insurance, shed space and a maintenance obligation on it. That is a clean sale, not a fleet decision.
Ground Truth: The instinct in a machinery downturn is to wait for the deal, and the instinct is wrong this cycle. Waiting works when weak demand produces discounting; it fails when weak demand coincides with a cost shock that removes the discount. The asymmetry runs the other way: the sell side of the transaction is at a cyclical high right now, and the estate-auction wave is a visible, dated threat to it. If a machine is going to be sold in the next three years, the market is telling you to sell it in the next twelve months. If a machine is going to be bought, the market is telling you to wait — and to expect to keep waiting.
4. What this means for an application program specifically
What's new: Application equipment sits in a different position from tillage or harvest iron, because the number of passes it makes is being set by the fertilizer program, and the fertilizer program is changing.
Evidence: The economics of an applicator are a function of acres covered per season and the timeliness value of covering them in the right window. Two current developments raise both:
- Split and in-season nitrogen adds passes relative to a single fall application, and does so in windows where custom capacity is most contended.
- Sulfur's repricing has pushed sulfur from a rounding error to a line item that gets its own placement decision, which for some operations means an additional application rather than a blend.
Both push toward more passes in tighter windows. That is the case for ownership, and it is a genuine one — but it cuts against the cash argument above, and an operation should be honest about which of the two it is actually optimizing. The failure mode we see most often is an operation that keeps a rig on timeliness grounds and then runs it across a fraction of the acres that justify it.
Market read: DE (NYSE) — Hold. The company has called 2026 the bottom of the cycle and its production and precision ag net sales fell from $5.230 billion in Q2 2025 to $4.503 billion in Q2 2026 — a genuine trough print. But a projected $1.2 billion tariff bill against $600 million a year earlier is a cost step that lands before any volume recovery does, and "the bottom" is a claim management has an obvious interest in making. The used market's strength is the more reliable signal in this complex and it accrues to sellers of iron, not builders of it.
5. What to watch
- Whether the estate-auction wave materializes in volume this fall. It is the only visible mechanism that would meaningfully reverse used-equipment appreciation, and it would do so quickly.
- Q4 dealer incentive programs. If manufacturers start buying volume with allowances despite tariffs, the trade differential narrows and the wait-for-a-deal case becomes real. If they hold list, it doesn't.
- The Creighton index crossing growth-neutral, which would end a run standing at 30 consecutive months as of February 2026.
- Custom application capacity commitments for fall. In a market where owning is expensive and hiring is the improving option, the constraint moves to whether the custom capacity is actually available in your window — and that gets booked earlier every year.
References
- farmdoc daily, University of Illinois, "The U.S. Farm Machinery & Equipment Market: Sales, Inventories, and Tariff Headwinds," Feb 27, 2026 — https://farmdocdaily.illinois.edu/2026/02/the-u-s-farm-machinery-equipment-market-sales-inventories-and-tariff-headwinds.html
- AgWeb, "Record-Breaking Auction Prices Signal Scarcity in Top-End Used Machinery," 2026 — https://www.agweb.com/news/machinery/record-breaking-auction-prices-signal-scarcity-top-end-used-machinery
- AgWeb, "From Skyfall to Stable Growth: Why Used Equipment Sales Are Poised for a Breakout Into 2026" — https://www.agweb.com/news/machinery/used-machinery/skyfall-stable-growth-why-used-equipment-sales-are-poised-breakout-
- Manufacturing Dive, "Deere, CNH and Agco brace for low North American sales in 2026 outlooks" — https://www.manufacturingdive.com/news/deere-cnh-agco-brace-low-north-american-sales-2026-outlook-tariff/812961/
- Ag Navigator, "John Deere reports more challenges to large ag business with Q2 2026 results," May 21, 2026 — https://www.agnavigator.com/Article/2026/05/21/john-deeres-q2-results-highlight-more-challenges-to-large-ag-business/
- Ag Navigator, "'2026 marks the bottom of the current cycle,' John Deere predicts rebound is around the corner," Feb 19, 2026 — https://www.agnavigator.com/Article/2026/02/19/2026-marks-the-bottom-of-the-current-cycle-john-deere-predicts-rebound-is-around-the-corner/
Disclosures
Crop Root Zone is an independent publication. Nothing here is investment advice. Market calls, where included, reflect the editors' own read and are not a recommendation to buy or sell any security.
The Drying Bill Nobody Budgets: In a Wet Fall It Costs More Than the Nitrogen Did
At the Midwest's last posted propane price, taking 200 bu/acre corn from 25% to 15% moisture runs about $98/acre — against a $106/acre anhydrous bill for the same crop. Propane stocks are 29% above the five-year average, which is the one thing working in a grower's favor.
Corn was rated 63% good-to-excellent as of July 26, down four points on the week, with 78% of the crop in the top 18 states silking against a five-year average of 74% and 25% at dough stage against an average of 22% (USDA Crop Progress, via DTN/Progressive Farmer, Jul 27, 2026). A crop that is ahead of pace and losing condition ratings is a crop whose harvest timing is genuinely uncertain, and harvest timing is the single largest input into a cost most operations budget at zero: drying. In a dry, drawn-out fall, that cost is a rounding error. In a wet one, at 200 bu/acre, it is comparable to the nitrogen bill for the same acre — and unlike the nitrogen bill, it is never negotiated, never prepaid, and never shopped.
1. Where the propane price actually stands
What's new: The honest answer for late July is that nobody has a current posted retail number, and that is a structural feature rather than a research failure. EIA pauses its weekly heating oil and propane survey from April through September, with the national weekly series resuming in October 2026. The most recent posted weekly residential propane prices are therefore from the week ending March 30, 2026: $2.67/gal nationally and $2.07/gal in the Midwest (EIA Weekly Heating Oil and Propane Update, week ending Mar 30, 2026).
Evidence: The supply picture behind those numbers has moved in the grower's favor since. US propane inventories were roughly 29% above their five-year average in early July 2026, and EIA's outlook has stocks peaking in October ahead of the heating season and staying above the five-year average through late 2026 (EIA Short-Term Energy Outlook and propane commentary, 2026).
| Basis | $/gal | As of | Freshness |
|---|---|---|---|
| Residential propane, US average | 2.67 | Week ending Mar 30, 2026 | Last posted weekly — EIA survey paused Apr–Sep |
| Residential propane, Midwest (PADD 2) | 2.07 | Week ending Mar 30, 2026 | Last posted weekly |
| Illustrative scenario — low | 1.75 | — | Our scenario, not a quote |
| Illustrative scenario — high | 3.00 | — | Our scenario, not a quote |
Source: EIA Weekly Heating Oil and Propane Update, week ending Mar 30, 2026. Scenario rows are ours and are labeled as such. Note that a residential price is not a farm-tank contract price — a delivered agricultural contract typically prices below residential, which makes the figures below conservative.
That October inventory build is the number to track. A build that finishes October above the five-year average tends to dampen autumn price increases; a below-average build lifts them. This year's build is running well ahead, which is the strongest argument available that fall propane will not be the problem it has been in some past harvests.
Ground Truth: The propane setup going into this harvest is the most favorable part of the entire cost picture, and almost nobody is treating it as an opportunity. Stocks 29% above the five-year average in July, with an October peak forecast above average, is precisely the condition under which a supplier will write a summer-fill or fall contract at a discount to keep the tank turning. The window to convert a favorable supply statistic into a contracted price closes when the first wet load hits the pit — after that, you are a price taker with a full dryer.
2. The arithmetic, per bushel per point
What's new: The engineering is stable and well-documented, which makes the cost almost entirely a function of the propane price and the number of points removed.
Evidence: High-temperature drying systems use an average of about 0.018 gallons of propane per point of moisture per bushel, with a working range of 0.010 to 0.025 depending on dryer type, condition and management (University of Minnesota Extension). Electricity for fans and handling adds roughly a further cent per point per bushel at typical farm rates.
Run that at three propane prices, using 0.018 gal/point/bu plus $0.012/point/bu for electricity and handling:
| Propane $/gal | Fuel $/pt/bu | Total $/pt/bu* | 5 points | 8 points | 10 points |
|---|---|---|---|---|---|
| 1.75 (scenario) | 0.032 | 0.044 | $0.22 | $0.35 | $0.44 |
| 2.07 (Midwest, Mar 30) | 0.037 | 0.049 | $0.25 | $0.39 | $0.49 |
| 3.00 (scenario) | 0.054 | 0.066 | $0.33 | $0.53 | $0.66 |
Source: propane consumption rate per University of Minnesota Extension; propane price per EIA, week ending Mar 30, 2026. *Total column is our calculation at 0.018 gal/pt/bu plus $0.012/pt/bu for electricity and handling; it excludes dryer depreciation, shrink and labor. Scenario rows are illustrative and are not quoted prices.
Two independent checks say this is the right neighborhood. Commercial drying is generally quoted at $0.03–0.06 per bushel per point depending on propane price and dryer type, and a commonly cited figure puts the cost of removing ten points of corn moisture at about 42 cents per bushel (Ferrellgas; Iowa State University Ag Decision Maker). Our $0.49 at $2.07/gal sits just above that, which is what you would expect from adding an electricity line most quick estimates leave out.
The physical version is easier to feel than the arithmetic: corn coming in at 23% moisture requires roughly 150 gallons of propane per 1,000 bushels to reach 15%, while corn at 18% requires only about 75 gallons for the same 1,000 bushels to 15% (University of Minnesota Extension). Five points of field drydown halves the fuel bill.
$0.49/bu
The all-in cost of taking corn from 25% to 15% moisture at the Midwest's last posted propane price — fuel and electricity only, before shrink, labor or dryer depreciation. (Our calculation from EIA, week ending Mar 30, 2026, and University of Minnesota Extension consumption rates.)
3. Set it beside the fertilizer bill
What's new: The reason this cost gets ignored is that it is quoted per bushel per point — a unit small enough to feel trivial. Converted to the unit every other input is budgeted in, it stops feeling trivial.
Evidence: At 200 bu/acre corn and the $2.07/gal Midwest anchor:
| Points removed | Field condition | $/bu | $/acre at 200 bu | |
|---|---|---|---|---|
| 3 (18% → 15%) | Good drydown | 0.15 | 29 | ███ |
| 5 (20% → 15%) | Normal | 0.25 | 49 | █████ |
| 8 (23% → 15%) | Wet | 0.39 | 78 | ████████ |
| 10 (25% → 15%) | Very wet / early harvest | 0.49 | 98 | ██████████ |
Source: our calculation as above, at 200 bu/acre. Compare: anhydrous nitrogen at $0.59/lb N and a 180 lb N/acre program is roughly $106/acre (DTN/Progressive Farmer, Jul 22, 2026, rate assumption ours).
A very wet harvest puts the drying bill at roughly 92% of the nitrogen bill for the same acre. The comparison is not perfect — the nitrogen figure uses a planning rate, and drying costs fall on the bushels rather than the acres — but the order of magnitude is the point, and the order of magnitude is that these are the same size.
The gap between the 3-point and 10-point rows is $69/acre, and it is decided almost entirely by weather and by when the combine rolls. That is the largest single-input swing in a fall budget that nobody forecasts.
And there is a second cost stacked on top that is easy to forget: shrink. Removing moisture removes weight, and the bushels sold are fewer than the bushels harvested. Shrink is a separate deduction from the energy cost above, and quoting a drying charge without it understates the true cost of wet corn.
Ground Truth: Grain drying is the only major cost in the operation that is committed by a decision made in the cab with a moisture meter, not at a desk with a budget. That is why it escapes management attention — there is no invoice to approve, no supplier to call, and no obvious moment at which anyone chose to spend $98/acre. The fix is not clever: it is deciding, before harvest, the moisture threshold at which you start, and pricing the propane for that threshold rather than hoping for the 3-point year. Everything else in this piece is arithmetic in support of that one operational habit.
4. The levers that actually exist
What's new: Four of them, in rough order of how much they move the number.
Evidence:
- Start later. Field drydown is free. Every point the crop loses standing is a point you do not buy, and the 3-point-versus-8-point difference is $49/acre at 200 bu. The cost is field loss and harvest-window risk, which in a year with declining condition ratings is a real cost, not a theoretical one. This is a genuine trade, not a free lunch.
- Contract the propane now. With stocks 29% above the five-year average in July and an above-average October peak forecast, this is the most favorable contracting setup in several years. A supplier facing a full tank in a well-supplied market is a supplier willing to talk.
- Dryer management. The 0.010-to-0.025 gal/point/bu range is a 2.5x spread driven by dryer type, condition and operation. An operation at the wrong end of that range is paying more than double what one at the good end pays for identical drying. Burner tuning and airflow checks before harvest are among the highest-return hours available in September.
- Commercial versus on-farm. Commercial drying at $0.03–0.06/bu/point brackets the on-farm energy cost, meaning the comparison is genuinely close on fuel alone — the decision turns on dryer capital, labor, throughput at the pit, and whether your window is constrained by drying capacity or by combine capacity.
5. What to watch
- The October propane inventory peak against the five-year average. It is the single best available predictor of autumn propane pricing, and it prints before most drying decisions are locked.
- EIA's weekly propane survey resuming in October 2026, which restores a current posted price after a six-month gap.
- Crop condition and maturity through August. Corn at 63% good-to-excellent and running ahead of the five-year pace on silking and dough is a combination that can resolve into either an early, dry harvest or an early, wet one. Which one it is determines whether this line item is $29/acre or $98/acre.
- Your own dryer's actual gallons per point. Almost nobody measures it, the published range spans 2.5x, and it is the one variable on this list you fully control.
References
- U.S. Energy Information Administration, Weekly Heating Oil and Propane Update, week ending Mar 30, 2026 — https://www.eia.gov/petroleum/heatingoilpropane/
- U.S. Energy Information Administration, Short-Term Energy Outlook, 2026 — https://www.eia.gov/outlooks/steo/
- Propane Insider, "EIA Forecast Signals Strong Propane Supply — and Possible Relief for Customers," 2026 — https://propaneinsider.com/news/eia-forecast-signals-strong-propane-supply-and-possible-relief-for-customers
- University of Minnesota Extension, "Energy costs for corn drying and cooling" — https://extension.umn.edu/corn-harvest/energy-costs-corn-drying-and-cooling
- Iowa State University Ag Decision Maker, "Estimating the Cost for Drying Corn" — https://www.extension.iastate.edu/agdm/crops/html/a2-31.html
- Ferrellgas, "Corn drying costs & how to efficiently dry grain" — https://www.ferrellgas.com/tank-talk/blog-articles/corn-drying-costs-how-to-efficiently-dry-grain/
- DTN/Progressive Farmer, "USDA Crop Progress: Corn Rated 63% Good to Excellent; Soybeans 63% Good to Excellent as of July 26," Jul 27, 2026 — https://www.dtnpf.com/agriculture/web/ag/news/article/2026/07/27/usda-crop-progress-corn-rated-63-63
- DTN/Progressive Farmer, "Fertilizer Prices Continue Downward Trend," Jul 22, 2026 — https://www.dtnpf.com/agriculture/web/ag/crops/article/2026/07/22/fertilizer-prices-continue-downward
Disclosures
Crop Root Zone is an independent publication. Nothing here is investment advice. Market calls, where included, reflect the editors' own read and are not a recommendation to buy or sell any security.
Phosphorus Enhancers Have 503 Field Trials Behind Them. Only 116 Were Run Where They Could Work.
The published meta-analysis says +2.1% yield across everything and +4.6% where a response was plausible — and the peer-reviewed rebuttal in the same journal says that framing is exactly backwards. With DAP at $913, the difference decides whether the product pencils.
Phosphate has not participated in this summer's fertilizer decline. DAP printed $913 per ton in the week of July 20-24, up $2 on the week, up 1% on the month and up 13% year over year; MAP held $958, up 9% year over year (DTN/Progressive Farmer, Jul 29, 2026). Over the same period anhydrous ammonia fell 11% on the month. When one nutrient holds while the others fall, the products that promise to stretch it get a second hearing — which is why phosphorus fertilizer enhancers, a category most agronomists stopped arguing about years ago, are back in front of growers. The good news for anyone evaluating them is that this is one of the few input categories with a large, published, peer-reviewed evidence base and a published rebuttal to it. The two together tell you more than either does alone.
1. What the evidence base actually says
What's new: The anchor study is a meta-analysis of 503 field evaluations of AVAIL, a maleic-itaconic copolymer marketed as a phosphorus fertilizer enhancer, published in Agronomy Journal (Hopkins, B.G., K.J. Fernelius, N.C. Hansen and D.L. Eggett, "AVAIL Phosphorus Fertilizer Enhancer: Meta-Analysis of 503 Field Evaluations," Agron. J. 110:389-398, 2018).
Evidence: The reported results, in the authors' own stratification:
| Data subset | Mean yield response | What the subset is |
|---|---|---|
| All 503 observations | +2.1% | Every trial in the dataset; statistically significant, P < 0.0001 |
| "Likely to respond" sites | +4.6% | Low soil-test P, extreme pH, low P rate |
| Peer-reviewed / thesis sources only | +5.8% | Excludes non-refereed trial reports |
Source: Hopkins et al., Agronomy Journal 110:389-398, 2018.
Three numbers, all positive, all published, all statistically significant. Taken alone that reads as a settled case. It isn't, and the reason is the fourth number.
Only 116 of the 503 observations were conducted under conditions where a phosphorus response would be expected at all — low soil-test P, strongly acid or alkaline pH, and a low P fertilizer rate. The other 387 were run on ground where conventional phosphate itself would not have moved yield.
116 of 503
The share of trials in the anchor meta-analysis run under conditions where any phosphorus product — enhanced or conventional — could plausibly have raised yield. (Hopkins et al., Agronomy Journal 110:389-398, 2018)
2. The rebuttal, and why it is the most useful document in the file
What's new: Agronomy Journal published a formal comment on the meta-analysis in the same volume — Chien, S.H., G.W. Rehm, J.H. Grove, D. Edmeades and R. McBride, "Comments on 'AVAIL phosphorus fertilizer enhancer: Meta-analysis of 503 field evaluations'" (Agron. J., 2018). It is not a press release from a competitor. It is a peer-reviewed critique in the journal that published the original.
Evidence: The critique's central argument is a soil-fertility one: previous summaries of AVAIL field research had not adequately accounted for standard soil fertility principles, and a large share of the trial base was conducted where no phosphorus response was expected under any product. That objection cuts in a specific direction, and it is worth being precise about which.
If 387 of 503 trials were run on ground incapable of showing a P response, then the "all data" figure of +2.1% is not a conservative, broadly applicable estimate. It is a number diluted toward zero by trials that could only ever have returned zero — which means, mathematically, the +2.1% understates the effect where the effect can exist. That is the authors' own argument for stratifying, and it is sound as far as it goes.
But the same fact cuts the other way on the question a grower actually asks. A dataset in which 77% of trials were run outside the product's plausible operating window is not primarily evidence about efficacy. It is evidence about how the product has historically been sold — broadly, across ground where the agronomic rationale did not apply.
Ground Truth: The meta-analysis and its rebuttal are not really in conflict about the agronomy. Both say the same thing: this chemistry can move yield on low-testing, pH-extreme, low-rate ground and does approximately nothing elsewhere. What they disagree about is which number belongs on the label. The practical consequence is that the +2.1% figure should never be used for a purchase decision in either direction — it is an average across two populations that should never have been averaged. Use +4.6% if your field qualifies and zero if it doesn't, and spend the effort on determining which of those you have rather than on debating the meta-analysis.
3. What it costs to be wrong, at $913 phosphate
What's new: The economics are unusually clean to compute, because the product is a per-ton treatment on a fertilizer whose price is published weekly.
Evidence: Build a representative corn P program at current prices. DAP at $913/ton is $0.4565/lb of product; at 46% P₂O₅ that is $0.992 per lb of P₂O₅. A 60 lb P₂O₅/acre rate therefore requires about 130 lb of DAP per acre and costs roughly $59.50/acre in phosphate alone.
| Program element | Rate | Cost basis | $/acre |
|---|---|---|---|
| DAP, 60 lb P₂O₅ | 130 lb/ac | $913/ton (DTN, Jul 29, 2026) | 59.50 |
| Enhancer treatment | per treated ton | $8-12/ton of DAP* | 0.52-0.78 |
| Treated P program | 60.02-60.28 |
Source: DAP price from DTN/Progressive Farmer, Jul 29, 2026. *Treatment cost is a representative published range for polymer P-enhancer products applied at label rate on a per-ton-of-fertilizer basis; treat it as an estimate, since these are negotiated per-retailer and are not publicly assessed.
Now the return side, at $4.40 corn on a 180 bu/acre base:
| Response assumption | Yield gain | Value at $4.40 | Net over treatment cost |
|---|---|---|---|
| Non-responsive site (0%) | 0.0 bu | $0.00 | −$0.65 |
| All-data average (+2.1%) | 3.8 bu | $16.63 | +$15.98 |
| Responsive site (+4.6%) | 8.3 bu | $36.46 | +$35.81 |
| Peer-reviewed subset (+5.8%) | 10.4 bu | $45.94 | +$45.29 |
Source: response percentages from Hopkins et al., Agron. J. 110:389-398, 2018; DAP price from DTN, Jul 29, 2026. Yield base, corn price and net calculations are Crop Root Zone's own and are illustrative.
| Scenario | Net $/acre | |
|---|---|---|
| Responsive, peer-reviewed subset | +45.29 | ██████████ |
| Responsive site | +35.81 | ████████ |
| All-data average | +15.98 | ████ |
| Non-responsive site | −0.65 | `` |
Source: as above. Bars scaled to the largest net.
Ground Truth: This is the rare input where the downside is genuinely trivial and that fact is the trap. At well under a dollar an acre, a treatment that does nothing costs almost nothing — which is precisely why 387 of 503 trials got run on ground where it could not work, and why the product spreads across whole-farm programs without anyone auditing the result. A 65-cent-per-acre mistake repeated across 3,000 acres for eight years is $15,600 and no one ever notices it, because it never shows up as a loss. The discipline this category demands is not skepticism about the chemistry. It is the willingness to spend real money on soil testing so the treatment goes only where the +4.6% lives.
4. Which ground qualifies
What's new: The meta-analysis is unusually specific about the response conditions, which makes the targeting rule short.
Evidence: Likelihood of response rises with low soil-test phosphorus, low P application rate, and extreme soil pH in either direction. Each of these has a straightforward mechanism: the enhancer chemistry is aimed at reducing fixation of applied P by calcium in alkaline soils and by iron and aluminum in acid soils. Where soil-test P is already high, the crop is not P-limited and nothing about fixation matters to yield. Where the rate is high, enough survives fixation regardless.
| Field condition | Response likelihood | Reason |
|---|---|---|
| Soil-test P low, pH < 5.5 or > 7.5 | Highest | P fixation active and crop is P-limited |
| Soil-test P low, pH near neutral | Moderate | Crop P-limited, fixation less severe |
| Soil-test P high, any pH | Effectively none | Crop is not P-limited |
| High P rate applied | Low | Sufficient P survives fixation |
Source: response conditions as characterized in Hopkins et al., Agron. J. 110:389-398, 2018.
The practical screen is a soil test you probably already have. If soil-test P sits in the build or maintenance range and pH is between 6.0 and 7.0, the published evidence says the expected return is approximately zero and the decision is finished. If P is in the low or very low category and pH is outside that band, the field is in the 116, not the 387.
Ground Truth: Phosphate holding at $913 while nitrogen falls does not make an enhancer work better — it makes the P₂O₅ it protects worth more, which raises the value of the same percentage response. That is a real effect and it is smaller than it sounds: at +4.6% on responsive ground the return is driven by the corn price, not the DAP price, because the payoff is bushels rather than saved fertilizer. Anyone pitching this product as a hedge against expensive phosphate has the mechanism backwards. It is a yield product on deficient ground, not a savings product on expensive fertilizer.
5. What would change the assessment
- A rate-reduction trial. The strongest version of the enhancer case would be evidence that a treated program at a lower P rate matches an untreated program at full rate. That is a fertilizer-savings claim rather than a yield claim, and it is the claim the 503-trial dataset was not designed to test.
- Independent replication at current prices. Most of the trial base predates the current phosphate price regime. The agronomy does not care what DAP costs, but the economics of the decision to test do.
- Soil-test P distribution. The share of US row-crop acres actually testing low in P determines the size of this market. If that share is rising as growers cut P rates against $913 DAP, the addressable acreage for the product grows for reasons that have nothing to do with the product.
References
- Hopkins, B.G., K.J. Fernelius, N.C. Hansen and D.L. Eggett. "AVAIL Phosphorus Fertilizer Enhancer: Meta-Analysis of 503 Field Evaluations." Agronomy Journal 110:389-398, 2018. https://acsess.onlinelibrary.wiley.com/doi/10.2134/agronj2017.07.0385
- Chien, S.H., G.W. Rehm, J.H. Grove, D. Edmeades and R. McBride. "Comments on 'AVAIL phosphorus fertilizer enhancer: Meta-analysis of 503 field evaluations' by B.G. Hopkins et al." Agronomy Journal, 2018. https://acsess.onlinelibrary.wiley.com/doi/10.2134/agronj2018.03.0161
- DTN/Progressive Farmer, "Fertilizer Prices Keep Sliding as UAN32 Leads 4 Nutrients in Significant Drops," Jul 29, 2026 (week of Jul 20-24). https://www.dtnpf.com/agriculture/web/ag/crops/article/2026/07/29/fertilizer-prices-keep-sliding-uan32
- Badger Crop Network, "Phosphorus Fertilizer Enhancement Products – What Do We Know?" https://badgercropnetwork.com/phosphorus-fertilizer-enhancement-products-what-do-we-know/
- Doydora, S., et al. "Phosphate solubilization from adsorbents and precipitates by different AVAIL polymers." Soil Science Society of America Journal, 2020. https://acsess.onlinelibrary.wiley.com/doi/10.1002/saj2.20168
Disclosures
Crop Root Zone is an independent publication. Nothing here is investment advice. Market calls, where included, reflect the editors' own read and are not a recommendation to buy or sell any security.
Digestate Is Worth $32 per Thousand Gallons. That Sets the Hauling Ceiling at 3.2 Cents.
The renewable-gas buildout is producing a nutrient stream as a byproduct, and priced at current N-P-K it splits into near-equal thirds — but the economics are decided entirely by distance, not by the nutrients.
The United States now has 242 farms operating active anaerobic digesters, roughly 78% of them dairies, with about 70 complete-mix systems and 50 covered-lagoon systems among them (U.S. EPA AgSTAR, Livestock Anaerobic Digester Database, mid-2026). Almost all of the dairy systems separate their effluent into solid and liquid fractions: the liquid is land-applied as an organic fertilizer, the solids go to bedding, on-farm application, or sale as a soil amendment (U.S. EPA AgSTAR). Those digesters were built to make renewable natural gas. The nutrient stream is what comes out the other end, and it is growing on a schedule set by energy policy rather than by fertilizer demand. Priced honestly against the current nutrient complex, it turns out to be worth more than most operators assume and to travel far less well than most business plans assume.
1. What a thousand gallons actually contains
What's new: The nutrient content of liquid dairy effluent is well characterized, and the gap between total and plant-available nutrients is the whole agronomic story.
Evidence: Representative liquid dairy manure figures, per 1,000 gallons:
| Nutrient | Total | Plant-available, year 1 | Capture rate |
|---|---|---|---|
| Nitrogen (N) | 33 lb | 18 lb | 55% |
| Phosphate (P₂O₅) | 13 lb | 10 lb | 77% |
| Potash (K₂O) | 31 lb | 28 lb | 90% |
Source: representative liquid dairy manure analysis as summarized by Dairy Herd Management and university extension nutrient-management guidance; actual values vary substantially by farm with diet, bedding, storage and dilution, and a laboratory analysis of the specific stream is required for nutrient management planning.
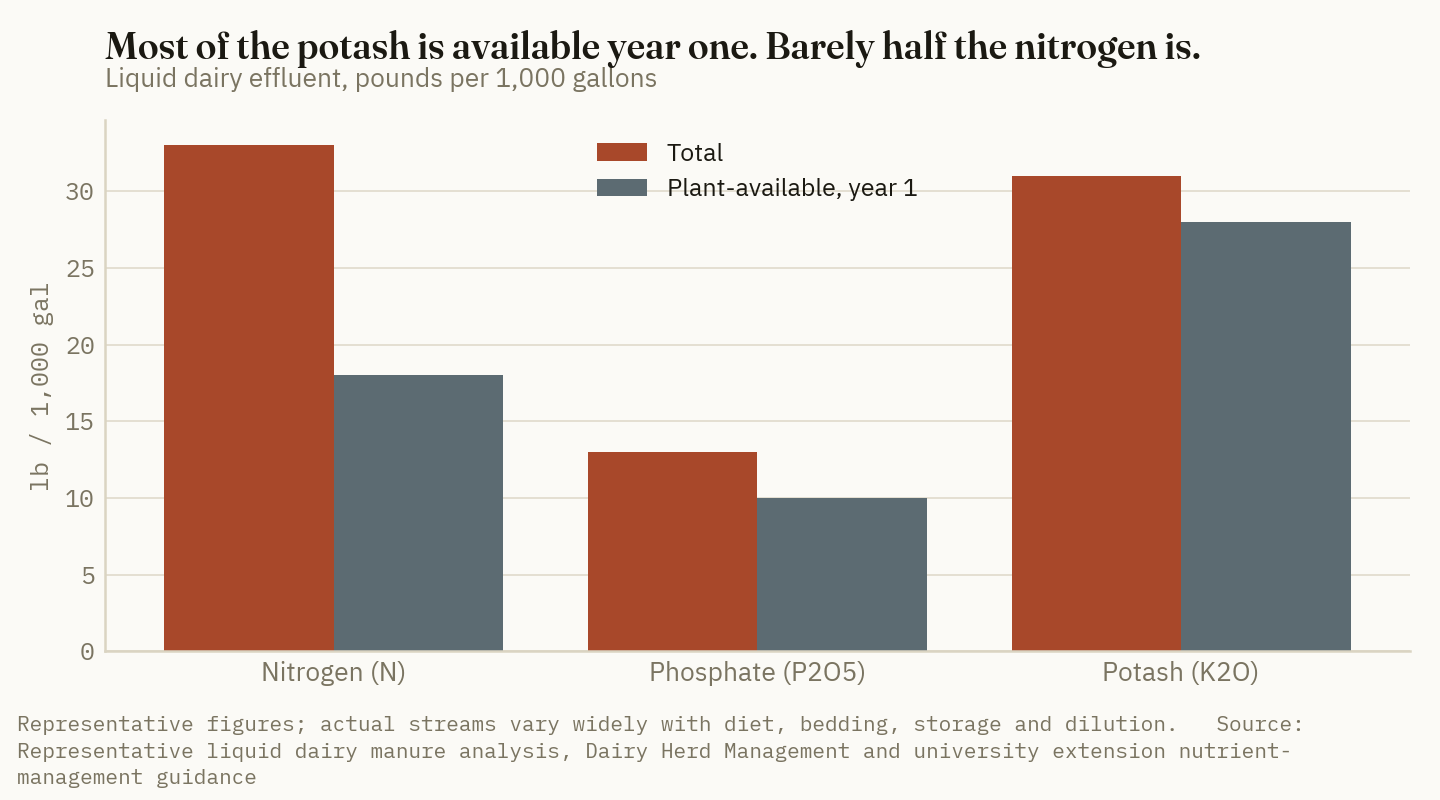
Nitrogen is the leaky one: barely half of what is present is available to this year's crop, with the balance in organic forms that mineralize over subsequent seasons. Potash is nearly all available immediately, because potassium in manure is largely in soluble mineral form and never was organic.
Anaerobic digestion changes that balance, and in a direction that matters. Digestion mineralizes organic nitrogen into ammonium while conserving total nitrogen and phosphorus, so digested effluent carries a higher ammonium-N fraction than raw manure — the Danish Biogas Institute has reported roughly 25% more available NH₄-N, alongside higher pH (as summarized in Extension Farm Energy, "Transformation and Agronomic Use of Nutrients From Digester Effluent"). Raw liquid dairy manure typically carries 10-12 lb of ammonium-N per 1,000 gallons; digestion shifts more of the total into that pool.
That is a genuine agronomic gain and it arrives with a genuine penalty attached. Ammonium at elevated pH is exactly the form that volatilizes. Modeling work summarized in the peer-reviewed literature puts the sensitivity at roughly 1.0% of applied NH₄-N lost per 1 K of temperature increase and about 1.6% per 0.1 unit of pH increase (Möller & Müller, Engineering in Life Sciences, 2012, and subsequent reviews).
Ground Truth: Digestion moves nitrogen from a slow, safe organic pool into a fast, volatile mineral pool. That is an upgrade only if the application method keeps it in the ground — injection or immediate incorporation. Surface-applied on a warm afternoon, the digester has converted a fertilizer the crop would have gotten next year into a fertilizer nobody gets at all. The nutrient advantage of digestate over raw manure is real and it is entirely contingent on equipment the digester project did not pay for.
2. What it is worth at today's prices
What's new: Nutrient value is usually quoted for manure at whatever fertilizer prices prevailed when the extension bulletin was written. At the current nutrient complex the answer is specific, and the composition of the answer is surprising.
Evidence: Value the plant-available fraction against DTN's July 29 retail prints — anhydrous ammonia at $0.59/lb N, DAP at $913/ton (46% P₂O₅, or $0.992/lb P₂O₅), potash at $494/ton (60% K₂O, or $0.412/lb K₂O):
| Nutrient | Plant-available/1,000 gal | Unit value | Value | |
|---|---|---|---|---|
| Potash (K₂O) | 28 lb | $0.412/lb | $11.53 | ██████████ |
| Nitrogen (N) | 18 lb | $0.590/lb | $10.62 | █████████ |
| Phosphate (P₂O₅) | 10 lb | $0.992/lb | $9.92 | █████████ |
| Total | $32.07 |
Source: nutrient concentrations from representative liquid dairy manure analysis (see §1); unit values derived from DTN/Progressive Farmer retail prices, Jul 29, 2026 (week of Jul 20-24). Per-thousand-gallon valuation is Crop Root Zone's calculation.
On a total-nutrient rather than plant-available basis the same 1,000 gallons carries about $45.13 of nutrients, so first-year capture is roughly 71% of the theoretical value with the remainder released over following seasons.
The striking result is the split. Nitrogen, phosphate and potash contribute $10.62, $9.92 and $11.53 respectively — near-equal thirds. Manure is discussed almost universally as a nitrogen source, and at current prices it is no more a nitrogen product than a potash product. That is a consequence of this particular price environment: anhydrous at $0.59/lb N is the cheapest nitrogen in the country, which suppresses the N leg of the valuation, while DAP at +13% year over year props up the P leg.
$32.07
Plant-available nutrient value in 1,000 gallons of liquid dairy effluent at July 2026 retail nutrient prices — split almost evenly across N, P and K. (Crop Root Zone calculation from DTN/Progressive Farmer, Jul 29, 2026)
3. The number that actually governs the business: 3.2 cents
What's new: A per-gallon value implies a per-gallon transport ceiling, and it is the tightest constraint in the category.
Evidence: $32.07 per 1,000 gallons is $0.0321 per gallon. That is the entire economic value of the material at the point of application. Every cent per gallon of pumping, loading, hauling and spreading comes out of it, and at 3.2 cents the budget is exhausted.
| If total handling costs… | Share of nutrient value consumed | Net to the operation |
|---|---|---|
| $0.010/gal | 31% | $22.07/1,000 gal |
| $0.015/gal | 47% | $17.07/1,000 gal |
| $0.020/gal | 62% | $12.07/1,000 gal |
| $0.025/gal | 78% | $7.07/1,000 gal |
| $0.032/gal | 100% | $0.00 — breakeven |
Source: Crop Root Zone calculation from the $32.07/1,000 gal nutrient valuation above. Handling-cost column is illustrative across a plausible range, not a sourced rate schedule; actual custom pumping and hauling rates are negotiated locally and rise steeply with distance.
A 6,000-gallon tanker carries about $192 of plant-available nutrients. That is the gross revenue available to justify a truck, a driver, a loading crew, fuel and a spreading pass — and diesel just went from $4.58 to $5.31 a gallon over three weeks (EIA weekly series, Jul 6-27, 2026), which raises the cost side of that ledger without touching the value side.
Ground Truth: Digestate does not have a nutrient problem, a regulatory problem, or an agronomy problem. It has a water problem. Roughly 96% of what gets hauled is water, and water at 3.2 cents a gallon of embedded value cannot pay for its own transport beyond a few miles. This is why every serious digestate business plan converges on the same two answers — either concentrate the nutrients before they move, or don't move them. Any plan that proposes trucking raw liquid digestate to a distant customer is not a fertilizer business; it is a waste-disposal business being described optimistically.
4. Which is why the solids and the recovery systems get the attention
What's new: The industry's own response to the water problem is to stop selling water.
Evidence: Nearly all US dairy digestion systems now run solid-liquid separation, and the fractions go to different markets: the liquid is land-applied locally as organic fertilizer, while the solid fraction is applied on-farm, sold as fertilizer or soil amendment, or used as bedding (U.S. EPA AgSTAR). Beyond simple separation, phosphorus recovery systems can capture 75 to 85% of the fine solids and phosphorus in the manure stream, producing a concentrated solid that can be marketed off-farm (U.S. EPA AgSTAR project documentation).
| Stream | Where the nutrients go | Where it can travel |
|---|---|---|
| Raw liquid digestate | Balanced N-P-K, dilute | A few miles |
| Separated liquid | N and K rich, P depleted | Still local — same water problem |
| Separated solids | P and organic matter | Regional |
| Recovered P concentrate (75-85% of P) | Phosphate, concentrated | Genuinely marketable |
Source: stream characterization and P-recovery capture rates from U.S. EPA AgSTAR.
The economic logic is visible in that last column. Phosphorus is the nutrient worth $0.992 per pound and the one that concentrates most readily into a solid, which is why nutrient-recovery engineering on these projects almost always targets P first. It is also the nutrient most likely to be in regulatory surplus on a dairy's own land base — the farm frequently needs the phosphorus to leave.
Ground Truth: The nutrient-recovery case on a digester is not primarily a revenue case, and operators who evaluate it as one will reject it. It is a land-base case. A dairy applying digestate to meet its nitrogen requirement over-applies phosphorus every year, because the N:P ratio in the effluent does not match the crop's, and that arithmetic eventually caps herd size or forces land acquisition. Pulling 75-85% of the P out converts a constraint on the dairy into a product that can leave the county. The fertilizer revenue is the smaller half of that transaction.
5. What a buyer should ask
For a row-crop operation offered digestate from a nearby digester, the evaluation is short and almost entirely local:
- Get the analysis, not the average. Every number in §1 is a representative figure and real streams vary widely with diet, bedding, storage and dilution. A lab analysis of the actual stream is the only basis for a nutrient credit, and it is cheap relative to the tonnage involved.
- Price it as N-P-K, not as nitrogen. At current prices the potash in the material is worth marginally more than the nitrogen. An operation valuing it as a nitrogen source alone is undercounting its worth by roughly two-thirds.
- Settle the application method before the price. The ammonium advantage from digestion is only realized with injection or immediate incorporation. Surface application on a warm day forfeits a meaningful share of the most valuable, most available nitrogen fraction.
- Do the distance arithmetic first. At $0.032 per gallon of embedded value, the haul decides the deal. If the field is more than a few miles from the digester, the answer is usually no regardless of how the rest of it looks.
References
- U.S. Environmental Protection Agency, AgSTAR, Livestock Anaerobic Digester Database and "Anaerobic digestion on dairy farms," accessed Jul 31, 2026. https://www.epa.gov/agstar/livestock-anaerobic-digester-database
- U.S. Environmental Protection Agency, AgSTAR, Project Spotlights (phosphorus recovery capture rates). https://www.epa.gov/agstar/project-spotlights
- Extension Farm Energy, "Transformation and Agronomic Use of Nutrients From Digester Effluent." https://farm-energy.extension.org/transformation-and-agronomic-use-of-nutrients-from-digester-effluent/
- Möller, K., and T. Müller. "Effects of anaerobic digestion on digestate nutrient availability and crop growth: A review." Engineering in Life Sciences 12(3), 2012. https://analyticalsciencejournals.onlinelibrary.wiley.com/doi/10.1002/elsc.201100085
- Dairy Herd Management, "How Much is That Manure Worth?" (representative liquid dairy nutrient analysis). https://www.dairyherd.com/news/business/how-much-manure-worth
- DTN/Progressive Farmer, "Fertilizer Prices Keep Sliding as UAN32 Leads 4 Nutrients in Significant Drops," Jul 29, 2026. https://www.dtnpf.com/agriculture/web/ag/crops/article/2026/07/29/fertilizer-prices-keep-sliding-uan32
- U.S. Energy Information Administration, Weekly Retail On-Highway Diesel Prices, Jul 6-27, 2026. https://www.eia.gov/petroleum/gasdiesel/
Disclosures
Crop Root Zone is an independent publication. Nothing here is investment advice. Market calls, where included, reflect the editors' own read and are not a recommendation to buy or sell any security.
EPA Traded a 272-Page PFAS Assessment for Nine Pages of Guidance. It Did Not Make Biosolids Safer to Accept.
A dry ton of biosolids is worth about $62 in replacement nutrients at July retail, and $80/acre at a phosphorus-based rate. The federal risk question got softer on July 2; the state law, the buyer contract and the land's resale value did not move at all.
On July 2, 2026, EPA released a nine-page draft guidance document for wastewater treatment operators on PFAS in biosolids, superseding the 272-page draft risk assessment the agency published in January 2025 and never finalized. EPA wrote that the earlier assessment "relied on assumptions too disconnected from real-world conditions to give Americans clear, actionable information," and that "a misconception has arisen that all biosolids and sewage sludge use and disposal practices will negatively affect the public" (Waste Dive, Jul 2026; C&EN, Jul 2026). The agency is taking comment. For a grower being offered free nutrients by a nearby treatment plant, almost nothing about the decision changed — because the federal risk assessment was never the binding constraint.
1. What the material is actually worth
What's new: At July 2026 fertilizer retail, the replacement value of a dry ton of anaerobically digested biosolids is roughly $62 in N, P and K — before counting sulfur, organic matter or micronutrients.
Evidence: A dry ton of anaerobically digested biosolids supplies approximately 35 lb N, 46 lb P₂O₅, 8 lb K₂O and 7 lb S, with 30–40 lb of that nitrogen plant-available in the first year after application (Oregon State University Extension, Fertilizing with Biosolids, PNW 508, Apr 2022). Price each against the commercial product a grower would otherwise buy.
| Nutrient | lb per dry ton | Replacement basis | $/lb | Value |
|---|---|---|---|---|
| Nitrogen (plant-available) | 35 | Urea 46-0-0 at $683/ton | 0.74 | $25.90 |
| Phosphate | 46 | DAP 18-46-0 at $913/ton, N credited | 0.703* | $32.33 |
| Potash | 8 | 0-0-60 at $494/ton | 0.412* | $3.29 |
| Sulfur | 7 | not priced here | — | — |
| Total, N-P-K only | $61.52 |
Crop Root Zone calculation. Nutrient content: Oregon State Extension PNW 508. Fertilizer prices:
DTN/Progressive Farmer Retail Fertilizer Trends, Jul 29, 2026 (week of Jul 20–24),
delivered-to-farm retail. Values marked * are derived: the phosphate figure credits DAP's 360 lb
of incidental N per ton at urea's $0.74/lb before dividing the remainder across 920 lb of P₂O₅;
the potash figure divides $494 across 1,200 lb of K₂O per ton. Sulfur is deliberately left
unpriced — it is a real additional credit, and quoting a number for it would require a retail
sulfur assessment this publication does not have for the week in question.
| Nutrient | Share of the $61.52 | ||
|---|---|---|---|
| Phosphate | $32.33 | ██████████ |
53% |
| Nitrogen | $25.90 | ████████ |
42% |
| Potash | $3.29 | █ |
5% |
Source: Crop Root Zone calculation as above.
$62/dry ton
The N-P-K replacement value of anaerobically digested biosolids at July 20–24, 2026 retail fertilizer prices — over half of it phosphate. (Crop Root Zone calculation from Oregon State Extension PNW 508 and DTN/Progressive Farmer, Jul 29, 2026)
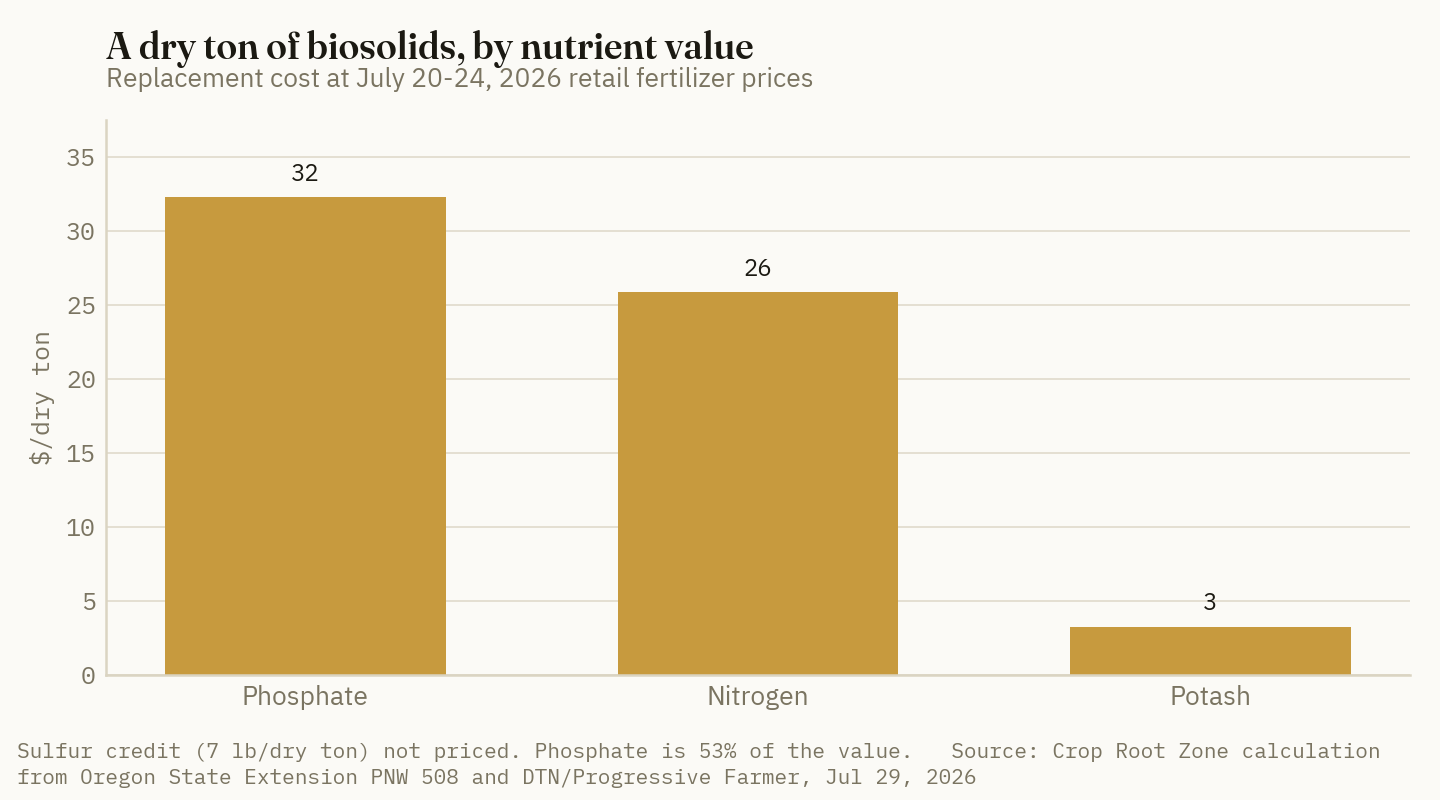
That composition is the first thing that has changed about this material in 2026, and it has nothing to do with PFAS. Biosolids are a phosphorus product with a nitrogen credit attached, and phosphate is the nutrient that did not participate in the summer's fertilizer decline: DAP printed $913/ton, +1% month-over-month and +13% year-over-year in the same July 29 survey (DTN, Jul 29, 2026).
2. The agronomic trap: which nutrient sets the rate
What's new: Applying biosolids at a nitrogen-agronomic rate over-applies phosphorus roughly threefold against crop removal — and that over-application is now worth more, which makes it harder to ignore rather than easier.
Evidence: Two rate philosophies produce very different outcomes from the same material.
| Nitrogen-based rate | Phosphorus-based rate | |
|---|---|---|
| Target | 180 lb plant-available N | 60 lb P₂O₅ (corn removal) |
| Dry tons/acre | 5.14 | 1.30 |
| N delivered (lb) | 180 | 45.7 |
| P₂O₅ delivered (lb) | 236 | 60 |
| P₂O₅ vs. corn removal | +176 lb | 0 |
| K₂O delivered (lb) | 41 | 10.4 |
| Nutrient value captured, $/acre | $316 | $80 |
| Commercial N still required (lb) | 0 | ~134 |
Crop Root Zone calculation from the PNW 508 nutrient content and July 20–24 DTN retail prices. Corn removal assumed at 60 lb P₂O₅/acre for a 180 bu crop. Excludes hauling, spreading and sampling costs, which in most programs are the grower's or the utility's depending on the agreement.
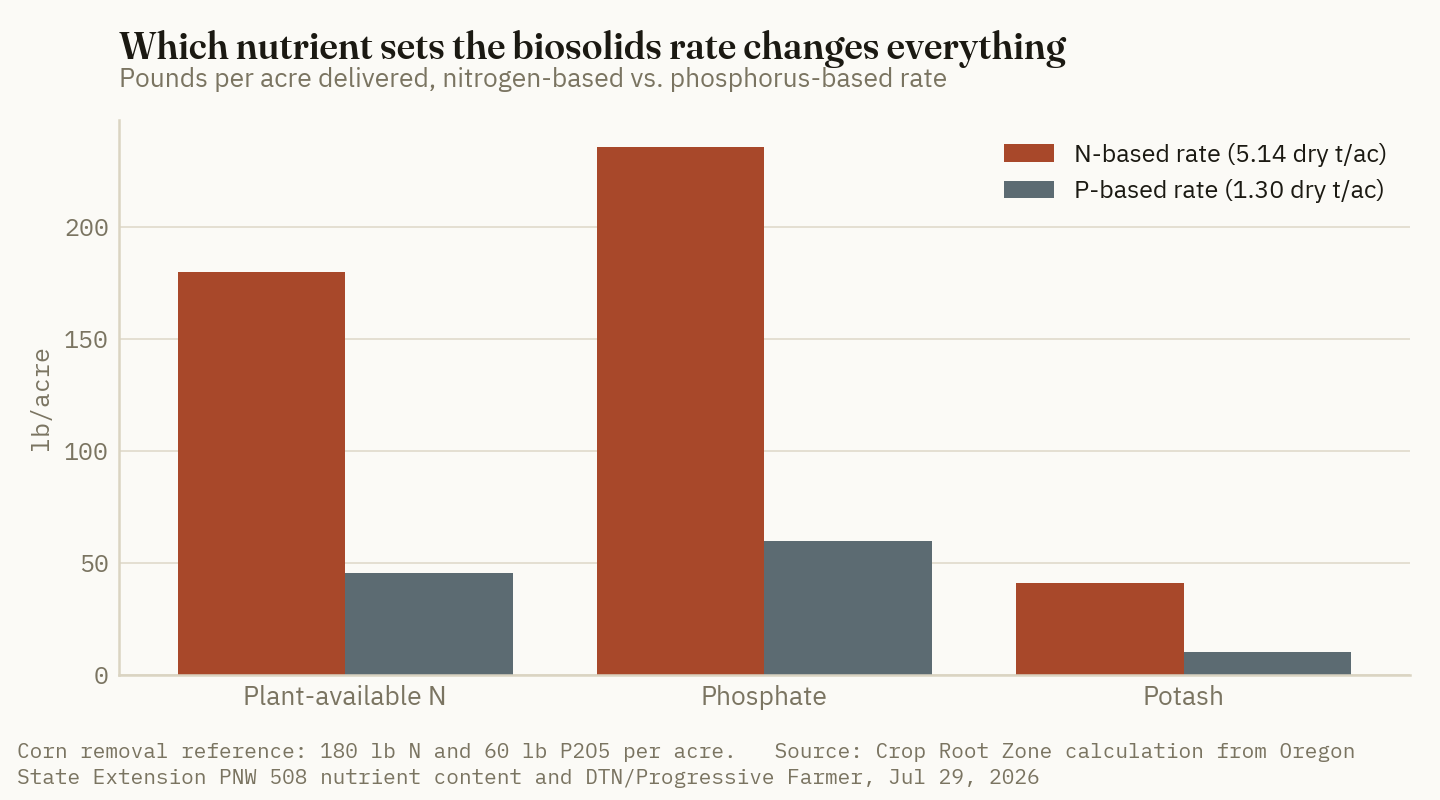
The nitrogen-based rate captures four times the nutrient value and banks 176 lb/acre of excess phosphate. On low-testing ground that is a legitimate soil build. On high-testing ground it is a water-quality liability and, in a growing number of watersheds, a permit condition.
Ground Truth: The rate decision has quietly reversed its economics. When phosphate was cheap, N-based rates were the obvious play and the P surplus was a nuisance you managed. At $913 DAP and rising, the surplus phosphate in an N-based application is worth roughly $124/acre of real fertilizer — which means the argument for taking biosolids at an N-based rate has never been stronger and the argument for treating that phosphate as a carefully accounted multi-year credit rather than a giveaway has never been stronger either. A grower who takes the N-based rate and then buys a full P program the following year has thrown away the single most valuable thing in the load.
3. The regulatory patchwork the federal move does not touch
What's new: State law, not the federal risk assessment, is what actually determines whether this material can go on a given field — and state law has been moving in the opposite direction from EPA.
Evidence: As of mid-2026 the map looks like this.
| Jurisdiction / status | Position |
|---|---|
| Maine, Connecticut | Effective bans on biosolids land application |
| Pennsylvania (proposed Jan 2026) | Tiered: ≥100 ppb PFOS or PFOA prohibited; 20–100 ppb at reduced rates; <20 ppb unrestricted |
| CA, CO, MA, MD, MI, MN, NH, VT | PFAS monitoring required at wastewater treatment plants |
| WA (×2), RI, OR, WI, CT | Six PFAS-biosolids bills enacted as of May 2026 |
| A dozen-plus states | Two dozen-plus active or recently enacted bills — bans, monitoring, reporting |
| Federal (EPA) | Jan 2025 draft risk assessment superseded Jul 2, 2026; no enforceable PFAS standard for biosolids finalized |
Sources: Beveridge & Diamond, "Evolving State Regulation of Biosolids Recycling in the PFAS Era"; BioCycle, "PFAS in Biosolids: What Organics Recyclers Need to Know Right Now"; Waste Dive, Jul 2026; Rockefeller Institute of Government, "Emerging State Regulations of PFAS for Biosolids."
EPA has never finalized an enforceable PFAS standard for biosolids. The January 2025 draft concluded that land application of PFAS-containing biosolids could create health risks for people relying on affected farmland for food and drinking water; it drew more than 25,000 comments and was never made final. The July 2, 2026 guidance replaces it without imposing a limit.
Nothing in that sequence changes a Maine or Connecticut prohibition, a Pennsylvania tier, or a monitoring obligation in eight states. A federal deregulatory step lowers the ceiling of future federal requirements; it does not lower a floor that was built at the state level.
Ground Truth: The practical effect of July 2 is to widen the dispersion of outcomes rather than to reduce risk. A national standard — in either direction — would at least have given a grower and a utility one number to plan against. What exists instead is a patchwork in which the same load of material is unrestricted in one state, rate-limited in a second and prohibited in a third, and in which the states are legislating faster than the federal agency is assessing. For an operation near a state line, that is not a regulatory question. It is a logistics and contracting question about where the trucks can legally go next spring.
4. The risk that is not regulatory at all
What's new: The exposures that most plausibly cost a grower money on this decision sit outside the permit entirely.
Evidence and reasoning:
Buyer and processor contracts. PFAS has been detected in meat and milk from cattle grazing pastures treated with biosolids, which is the mechanism environmental petitioners have pointed to in arguing for bioaccumulation up the food chain. A dairy or meat buyer does not need a federal standard to write a sourcing clause; several have shown they will act ahead of regulators. A contract term is enforceable the day it is signed and does not go through notice-and-comment.
Land marketability and financing. Application records follow the ground. A field with a documented biosolids history is a disclosure item in a sale and a diligence item in a loan file, regardless of whether any measured concentration ever exceeded a limit that does not yet exist. That is an asset-value question with a very long tail relative to $80/acre of nutrients.
Litigation. In 2024, Public Employees for Environmental Responsibility sued EPA on behalf of farmers and farm and environmental organizations over the agency's failure to further address PFAS in biosolids regulations. Litigation risk in this area attaches to the party with the records, and the party with the application records is usually the farm.
Reversibility. Nitrogen and potash leave a field. Phosphorus and PFAS both persist, on very different timescales and for very different reasons — one is an asset you drew down over years, the other is a liability you cannot draw down at all with any known field practice.
Ground Truth: Price this decision as an option, not as a fertilizer purchase. What is being offered is roughly $80/acre a year at a phosphorus-based rate, against a low-probability, high-severity, effectively irreversible tail that lands on the land asset rather than on the crop. That is a coherent trade for an operator farming owned ground in a permissive state with a commodity grain buyer, and a poor one for an operator on rented ground, near a state line, or selling into a dairy or specialty channel. It is genuinely case-by-case, and the July 2 guidance did not make any of those cases easier to decide — it removed the one document that was going to eventually settle them.
5. Scale check: why this fight is bigger than the tonnage
The United States produces roughly 6 million dry metric tons of sewage sludge a year, of which more than 40% is land applied; other estimates put the land-applied share of biosolids specifically closer to 70%, and published figures differ enough that both should be treated as approximations (peer-reviewed literature and EPA materials, various dates).
Take the conservative end. Roughly 2.4 million dry metric tons land applied, at $61.52 per dry short ton of N-P-K value, is on the order of $160 million a year in replacement fertilizer value nationally — a Crop Root Zone estimate, and a rounding error against a US fertilizer market measured in the tens of billions.
Ground Truth: The national fertilizer market will not notice whichever way this resolves. The utilities will notice enormously, because land application is the cheapest disposal route they have and the alternatives — landfill, incineration, thermal treatment — are step-changes in cost that flow into sewer rates. That is the real economic engine behind the federal softening, and it is worth a grower understanding it clearly: the party with the strongest financial interest in this material moving is the one offering it for free, and free is a price that reflects who is avoiding a cost, not what the risk is worth.
6. What to watch
- The comment record on the July 2 guidance. The January 2025 assessment drew 25,000+ comments and died. Whether this one converges on an enforceable number, or repeats the cycle, determines whether growers ever get a single figure to plan against.
- Pennsylvania's tiered proposal. A 20/100 ppb structure that survives adoption becomes the template other states copy — and it is the first framework that would let a specific load be cleared or rejected on a test result rather than on a categorical ban.
- Buyer-side clauses, not agency actions. The first major grain or dairy buyer to write an explicit biosolids exclusion into a standard contract will move more acres than any state legislature has.
- Phosphate. DAP at $913 and +13% year-over-year is what makes this material worth arguing about. A phosphate market that keeps firming raises the value of every load and raises the pressure on every one of the questions above.
References
- Waste Dive, "EPA revisits PFAS in biosolids guidance, criticizing Biden-era report," Jul 2026 — https://www.wastedive.com/news/epa-revisit-pfas-biosolids-guidance-criticizing-biden-era-report/824326/
- Chemical & Engineering News, "EPA moves to cut risks from PFAS in fertilizer, pans Biden-era analysis," Jul 2026 — https://cen.acs.org/policy/chemical-regulation/epa-pfas-risk-biosolid-sewage-sludge-fertilizer/104/web/2026/07
- Oregon State University Extension Service, Fertilizing with Biosolids, PNW 508, Apr 2022 — https://extension.oregonstate.edu/sites/extd8/files/documents/pnw508.pdf
- DTN/Progressive Farmer, "Fertilizer Prices Keep Sliding as UAN32 Leads 4 Nutrients in Significant Drops," Jul 29, 2026 — https://www.dtnpf.com/agriculture/web/ag/crops/article/2026/07/29/fertilizer-prices-keep-sliding-uan32
- Beveridge & Diamond, "Evolving State Regulation of Biosolids Recycling in the PFAS Era" — https://www.bdlaw.com/publications/evolving-state-regulation-of-biosolids-recycling-in-the-pfas-era/
- BioCycle, "PFAS in Biosolids: What Organics Recyclers Need to Know Right Now" — https://www.biocycle.net/pfas-biosolids-state-regulations-organics-recyclers/
- Rockefeller Institute of Government, "Emerging State Regulations of PFAS for Biosolids" — https://www.rockinst.org/blog/emerging-state-regulations-of-pfas-for-biosolids/
- US EPA, Land Application of Biosolids fact sheet — https://www.epa.gov/sites/default/files/2018-11/documents/land-application-biosolids-factsheet.pdf
- Oklahoma State University Extension, Using Biosolids as a Plant Nutrient Source — https://extension.okstate.edu/fact-sheets/using-biosolids-as-a-plant-nutrient-source
Disclosures
Crop Root Zone is an independent publication. Nothing here is investment advice. Market calls, where included, reflect the editors' own read and are not a recommendation to buy or sell any security.
The Cheapest Sulfur in America Is a Coal Byproduct, and Its Supply Is Now a Policy Variable
Delivered-and-spread gypsum carries sulfur at roughly $0.11/lb against $0.31/lb for elemental sulfur at the record Tampa contract. The catch is that you cannot buy the sulfur without the tonnage — and the tonnage comes off a coal fleet retiring 6.4 GW this year.
Flue-gas desulfurization gypsum is the closest thing agriculture has to a free lunch in a repriced sulfur market: it is 18% sulfur and 22.5% calcium, it exists because a power plant was legally required to strip sulfur out of a flue stream, and it is priced as a disposal problem rather than as a nutrient. Delivered and spread, it runs $30–50/ton in regions near a source. That works out to roughly $0.11 per pound of sulfur, against roughly $0.31/lb for elemental sulfur valued at the record Q3 Tampa molten contract of $705 per long ton (Argus Media, Jul 13, 2026). The reason more acres do not carry it has nothing to do with agronomy and everything to do with two constraints that no price comparison captures: you cannot buy the sulfur without buying the tonnage, and the tonnage comes off a generating fleet that is shrinking on a schedule set in Washington rather than in a market.
1. Price the sulfur, honestly
What's new: With the Q3 Tampa molten sulfur contract at a record $705/lt, every sulfur-bearing product in the catalog is worth re-pricing on a per-unit-of-nutrient basis rather than a per-ton basis.
Evidence: Agricultural gypsum from natural calcium sulfate dihydrate at around 97% purity supplies 22.5% calcium and 18% sulfur (GYPSOIL product specification). Delivered and spread pricing runs $30–50/ton, with a wider $20–100/ton range depending on source, form and haul distance; locally available material is materially cheaper because freight dominates the delivered cost.
| Sulfur source | Basis | S content | $/ton (or lt) | $/lb S* | |
|---|---|---|---|---|---|
| Gypsum, delivered & spread (low) | Regional, near source | 18% | 30 | 0.083 | ███ |
| Gypsum, delivered & spread (high) | Regional | 18% | 50 | 0.139 | █████ |
| Gypsum, wide range top | Long haul | 18% | 100 | 0.278 | █████████ |
| Elemental sulfur | Tampa molten contract, Q3 2026 | ~100% | 705/lt | 0.315 | ██████████ |
Source: gypsum content and pricing per GYPSOIL and USA Gypsum published material; Tampa Q3 2026 molten sulfur contract per Argus Media, Jul 13, 2026. *$/lb S is our calculation: $/ton ÷ (2,000 lb × S fraction); elemental sulfur at $705 per long ton ÷ 2,240 lb.
At the midpoint of delivered-and-spread gypsum — call it $40/ton, or $0.111/lb S — gypsum's sulfur is roughly a third the cost of elemental sulfur at the Tampa contract. That is a real and large gap, and it is the entire reason this material keeps coming up in a year like this one.
$0.11/lb S
Sulfur delivered in gypsum at $40/ton spread — about one-third the cost of elemental sulfur valued at the record Q3 Tampa molten contract. (Our calculation from published gypsum pricing and Argus Media, Jul 13, 2026.)
2. Why that comparison flatters gypsum
What's new: The per-pound number is arithmetically correct and operationally misleading, and the reason is worth spelling out because it is the thing that decides whether a given farm should use it.
Evidence: Crop sulfur removal for row crops runs in the low tens of pounds per acre. A single ton of 18% gypsum delivers 360 lb of sulfur per acre — an order of magnitude more than the crop will take up in a season. Even a light 500 lb/acre rate delivers 90 lb S.
| Rate | S delivered | Ca delivered | Approx. cost at $40/ton spread |
|---|---|---|---|
| 500 lb/acre | 90 lb S | 112 lb Ca | $10 |
| 1 ton/acre | 360 lb S | 450 lb Ca | $40 |
| 2 tons/acre | 720 lb S | 900 lb Ca | $80 |
Source: our calculation at 18% S and 22.5% Ca (GYPSOIL specification) and a $40/ton delivered-and-spread midpoint. Rates shown are illustrative; an actual rate comes from a soil test and the amendment objective, not from a nutrient budget.
This is the crux. Gypsum is not a sulfur fertilizer that happens to be cheap — it is a soil amendment that happens to contain sulfur. Its case is built on calcium supply, structural improvement in high-magnesium or dispersive soils, and sodic reclamation, with sulfur as a substantial co-benefit. Judged purely as a way to place 25 lb of plant-available S in the right place at the right time, it is the wrong tool: the rate is unmanageable, the sulfate is applied all at once, and the freight and spreading cost scale with tonnage rather than with nutrient.
The corollary is the useful part. If a field already justifies gypsum on amendment grounds, its sulfur is close to free — and in a year with the Tampa contract at a record, that free sulfur is worth several times what it was worth two years ago. The economics did not change because gypsum got cheaper. They changed because everything it substitutes for got more expensive.
Ground Truth: The correct question is not "should I use gypsum for sulfur." It is "do I have fields where gypsum was already a marginal call on calcium or soil structure, and does the repriced sulfur push those fields over the line?" That reframing matters because it changes who should act. An operation on well-structured, adequately-calcium soils gains nothing here regardless of the sulfur price. An operation with high-magnesium or dispersive ground that has been deferring a gypsum program on cost grounds is now looking at a materially better return on the same decision — and the reason is a sulfur market that has nothing to do with its soil.
3. The supply question, which is not an agricultural question
What's new: FGD gypsum exists because coal plants scrub sulfur from flue gas. Fewer coal plants means less FGD gypsum, and the retirement schedule is the supply curve.
Evidence: EIA reports 6.4 GW of coal-fired capacity scheduled to retire in 2026, close to 4% of the US coal fleet operating at the end of 2025. The largest single retirements planned are the 1,331 MW J.H. Campbell plant in Michigan and the 1,231 MW Cumberland Unit 2 in Tennessee (EIA, 2026). Most planned coal retirements are concentrated in the Midwest and Mid-Atlantic — which is to say, in and around the ground that uses the most agricultural gypsum.
But the schedule is not the outcome, and 2025 proved it:
| Year | Anticipated coal retirements | Actual | Shortfall |
|---|---|---|---|
| 2025 | 8.0 GW | 2.6 GW | −5.4 GW |
| 2026 | 6.4 GW scheduled | pending | — |
Source: U.S. Energy Information Administration, 2026. The 2025 shortfall followed DOE emergency orders that temporarily postponed retirement of several large coal plants; 2025 coal retirements were the smallest in 15 years.
That is a 68% miss against plan, driven by policy intervention rather than by economics. EIA has explicitly flagged that retirement delays may continue in 2026 and that these plans are more subject to change than usual.
The supply-side story in the materials trade press runs the other way and runs harder: coal-plant retirement timelines in the US and Germany are described as compressing FGD gypsum supply windows faster than wallboard capacity can relocate, forcing procurement toward captive utility partnerships and imports, with FGD output in developed economies having plateaued after years of growth (industry market analyses, 2026). The synthetic gypsum market is projected to grow from $1.98 billion in 2025 to $2.05 billion in 2026 and $2.46 billion by 2031, a 3.73% CAGR — growth driven by price and by demand, not by volume of byproduct.
Ground Truth: Agriculture is the junior claimant on this material and should plan accordingly. Wallboard is the anchor customer for FGD gypsum, it is contracted, and it will not be the segment that goes short. Agricultural gypsum is the residual — which is exactly why it has been cheap, and exactly why it is the first use to get squeezed when byproduct volume falls. The practical implication is about term, not price: an operation building a multi-year gypsum program near a Midwest or Mid-Atlantic source should be asking its supplier which plant the material comes from and what that plant's retirement status is. That is an unusual question to put to a fertilizer dealer, and it is the right one.
4. What the 2025 delay actually bought
What's new: The gap between 8.0 GW planned and 2.6 GW retired is not a footnote. For a grower building a gypsum program, it is the single most important number in this piece.
Evidence: Two readings are available and both are defensible:
- The reprieve reading. Policy has demonstrated a willingness to keep large coal units running past their announced retirement dates. If that persists, FGD gypsum supply erodes far more slowly than the announced schedule implies, and the current price structure holds for years rather than seasons.
- The cliff reading. Delays are delays, not cancellations. Deferred retirements stack up, and a policy environment that changes can release several years of postponed closures in a compressed window. That would take supply out faster than the smooth schedule implies, not slower.
We do not think the evidence currently distinguishes between them, and we are not going to pretend otherwise. What the evidence does support is a statement about volatility: byproduct supply governed by discretionary policy interventions is less predictable than byproduct supply governed by plant economics, in both directions.
For the calcium-sulfate basket more broadly, the reference points are stable — IMARC's calcium sulfate index shows prices holding across the Americas, at USD 217/MT in Canada and USD 177/MT in Argentina (IMARC Group, 2026). Stability in the index alongside a contracting byproduct base is consistent with demand growth being absorbed by price rather than by volume.
5. What to watch
- Whether the 6.4 GW scheduled for 2026 actually retires, and specifically whether J.H. Campbell and Cumberland Unit 2 close on schedule. Both are large, both are in gypsum-relevant regions, and both are visible.
- Which plant your material comes from. The most useful supply diligence available on this input is a single question to a dealer, and almost nobody asks it.
- The Q4 2026 Tampa molten sulfur settlement. It sets the value of the sulfur co-benefit. A record Q3 at $705/lt is what makes gypsum's sulfur worth discussing at all; a soft Q4 would take some of the case away.
- Freight. At $30–50/ton delivered and spread, the delivered cost is mostly trucking. Anything that moves diesel or haul distance moves this input's economics more than anything happening in the sulfur market does.
References
- U.S. Energy Information Administration, "Most of the planned coal capacity retirements are in the Midwest or Mid-Atlantic regions," 2026 — https://www.eia.gov/todayinenergy/detail.php?id=65744
- U.S. Energy Information Administration, "Retirement delays of U.S. electric generating capacity may continue in 2026," 2026 — https://www.eia.gov/todayinenergy/detail.php?id=67206
- U.S. Energy Information Administration, "U.S. coal-fired generating capacity retired in 2025 was the least in 15 years," 2026 — https://www.eia.gov/todayinenergy/detail.php?id=67427
- Argus Media, "Tampa 3Q liquid sulphur price hits record $705/lt," Jul 13, 2026.
- GYPSOIL, "Calcium Sulfate Soil Amendment — Agricultural and Synthetic Gypsum" — https://www.gypsoil.com/
- USA Gypsum, "Agricultural Gypsum" — https://www.usagypsum.com/gypsum-products/agricultural-gypsum
- IMARC Group, "Calcium Sulfate Prices Remain Stable Across Americas," 2026 — https://www.imarcgroup.com/news/calcium-sulfate-index
- Mordor Intelligence, "Synthetic Gypsum Market Size, Share & Growth Trends Report," 2026 — https://www.mordorintelligence.com/industry-reports/synthetic-gypsum-market
- MarkWide Research, "FGD Gypsum Market Size, Share, and Industry Trends Forecast 2026-2036" — https://markwideresearch.com/fgd-gypsum-market
Disclosures
Crop Root Zone is an independent publication. Nothing here is investment advice. Market calls, where included, reflect the editors' own read and are not a recommendation to buy or sell any security.
Discussion
We argue this week that ammonium sulfate's pass-through is unfinished — the cost stack moved about $62 a ton and published Corn Belt offers moved $20 to $50. The only way to know is from the people being quoted. What is your local retailer offering on 21-0-0-24S for fall delivery right now, what were you quoted 30 days ago, and what basis is it on — FOB the plant, delivered, or delivered and spread? If your quote moved the full $62, or did not move at all, that is the more interesting answer.
Corrections and pushback are welcome and useful, especially on numbers we calculated rather than looked up. The sharpest replies get answered in next week's Letters & Responses.