Issue 02 · 2026-07-27
The headline this month is that fertilizer is getting cheaper. Six straight weeks of lower retail prints, anhydrous back under $1,000 for the first time in 17 weeks, UAN32 off 15% in a month (DTN, Jul 22, 2026). Read the rest of the board and the story narrows fast. DAP is $911 and higher on the month. MAP is $958. Sulfur is at record contract levels. Falling nitrogen is not falling fertilizer.
That distinction runs through everything in this issue. The savings are real, but they are concentrated in one nutrient and they shrink on the way to the field — custom application takes a cut, freight and inventory vintage take another, and prepay takes a third if the market keeps sliding underneath the ton you already bought. Several pieces here start from different products and arrive at the same place: the question this fall is which molecule and which acre, not whether the bill is down.
The crop side moved in the grower's favor this week for once, with December corn up 20 cents and November soybeans up 50½ (Pro Farmer, Jul 24, 2026). Both blades of the margin finally cut the same direction. The wholesale nitrogen tape says that window, not the retail print behind it, is the thing to watch.
— Crop Root Zone, Editorial Desk
Letters & Responses
One reader wrote in on Issue 01, with three suggestions. We are publishing the note unattributed, and answering all three, because two of them changed this issue.
"Does a table of contents make sense? There is a ton of information here, and perhaps a reader would prefer to jump to certain subjects."
Yes, and there is one in this issue — "In This Issue," directly above the State of the Industry column. It lists every feature under its department with its subtitle, so you can find the two or three pieces that matter to your operation without scrolling the whole issue. It also does a second job: it is how a reader scanning the issue decides which pieces are worth their time before committing to any of them.
"Maybe we add some tables and graphs."
Agreed, and this is now a standing requirement rather than a preference. Every long-form feature in this issue carries at least two graphics, and the price- and margin-driven pieces carry three or more. Every table and chart names its source and its basis.
"Enlarge the font for the note under the masthead."
Taken, and on the list. That line is set by the cover template rather than typed each week, so it changes when the template does.
Have a question, correction, or pushback on something we ran? Reply to this email or comment on the post — we read everything and answer the ones that sharpen the next issue.
In This Issue
This week's features, by department.
- The Import Floor: Why Falling Retail Nitrogen Won't Chase the 2024 LowsRetail urea is down six straight weeks, but the US imports roughly a third of the urea it uses, and the replacement cost is set in Cairo, the Arab Gulf and India's tender room — the floor under fall fill is a landed-cost number, not a domestic one
- Anhydrous Slips Under $1,000 for the First Time in 17 Weeks — and Widens Its Lead as the Cheapest Nitrogen in the CountryRetail anhydrous fell 11% in a month to $967, but it is still up 26% on the year and still 20-31% cheaper per pound of N than every liquid alternative. The fall buy is which molecule, not just when.
- Urea's Round Trip: Down 55% From April, Up 14% in a Month, and a Forward Curve That Says $368The crisis premium came out of nitrogen faster than it went in — but the fall fill offer is being written against a supply base that lost tonnes it cannot make up.
- Phosphate's Fall Floor: DAP Holds $911 While Nitrogen SlidesRetail DAP sits near cycle highs — up 12% on the year — even as anhydrous has shed $69/ton since July began. The decoupling is structural, and it turns the fall P decision from a cost call into a yield call.
- The Scissors Open: Nitrogen Falls Five Straight Weeks While Sulfur Sets RecordsRetail N is off 6–7% in a month; the Tampa sulfur contract just settled at a record $705/lt. Two blades of the same fertility program are cutting in opposite directions — and the wholesale tape says the nitrogen blade closes first
- Sorghum's Low-Input Case Is Real — but It's a Dryland Case, Not a Corn Belt OneGrain sorghum needs roughly the same nitrogen per bushel as corn, so the savings come entirely from a lower yield goal and a lower total input bill — which is why the crop pencils on water-limited acres and nowhere else, even with China back at the table
- $4.40 Corn, $11.40 Beans, and a Fertilizer Bill That Finally Fell: The July WASDE Margin MathThe July WASDE held corn's season-average price at $4.40 and beans at $11.40 — the highest soybean number since 2023/24 — just as retail nitrogen rolled over for a sixth week. Corn moves from a loss toward breakeven; beans pencil the better acre.
- Rent Fell a Dollar. The Fertilizer Bill Rose Forty. The 2027 Lease Is Being Negotiated Off the Wrong Number.Iowa cash rent averaged $270 in 2026 — down $1. On our estimate, the same corn fertility program costs roughly $43 an acre more than it did a year ago.
- Wheat's Balance Sheet Just Tightened. The 2027 Acre Is the Question.USDA cut the 2026 crop 23% to 1.536 billion bushels and pushed the farm price to $6.00 — but wheat's lower nitrogen bill, not the price, is what defends its ground.
- 85.4 Million Bean Acres: What a Four-Million-Acre Rotation Shift Actually Does to the Fertilizer BillThe swing to soybeans pulls roughly 220,000–320,000 short tons of nitrogen out of 2026 demand — about 1.3–1.9% of US consumption, and nowhere near enough to break the nitrogen bid. Meanwhile potash and sulfur removal go up.
- The $21 Line: What Custom Application Now Costs — and How Much of Anhydrous's Price Edge It EatsKansas custom applicators charged an average of $21.51/acre to knife in anhydrous in 2026 against $8.40 to spread dry — and that spread quietly claws back more than half of anhydrous's product-cost advantage as the cheapest nitrogen
- 16 Billion Bushels Need Somewhere to Go: On-Farm Storage Economics Into the 2026 HarvestA record corn crop is landing on a storage system that stopped growing — surplus capacity is down to 5% and harvest basis has widened past $1.50 under. Storage just became a margin input, and the build-rent-sell math is running against a hard fall deadline.
- $232 for the Same Ton: What Regional Fertilizer Spreads Actually MeasureUSDA's July 10 distributor reports show AMS 42% dearer in the Pacific Northwest than Oklahoma and urea 60% dearer — while DAP varies by 4%. Freight cannot explain that pattern. Inventory vintage can.
- Prepay Is a Short Put: What On-Farm Storage Is Actually Worth in a Split Nutrient MarketSummer-fill discounts of 3-5% don't cover 7% money plus the annualized cost of the building it sits in — and nitrogen is falling while sulfur runs
- Polymer-Coated Urea's Second Look: It Pays One Year in Four — and a Blend Beats Buying It StraightESN carries a $0.16–0.20/lb-N premium and out-yields urea in only about a quarter of Minnesota site-years, all of them wet — but the research says a 2:1 ESN-to-urea blend returns more than either pure product, because you should buy the coating only for the nitrogen that has to survive
- Poultry Litter Is a Phosphate Product, and Phosphate Isn't Falling: What a Ton Is Worth at Mid-2026 PricesRetail nitrogen is down six weeks running, but litter draws most of its value from the P and K lines — which are flat near highs. A ton pencils near $85 in first-year nutrients, and the haul radius that pays just widened.
- Struvite's Agronomy Question Is Settled. Its Tonnage Question Isn't.With DAP at $912 and up 13% year over year, recovered phosphorus finally pencils on paper. The constraint was never the crop response — it's that the entire global category is a rounding error against 4 million tons of US P₂O₅ demand.
- Sulfur at Three Times the Price: How to Pick the Form Now That the Rate Isn't the DecisionSulfur is up 311% year-over-year and the Q3 Tampa contract just printed a record $705/lt — which means the cheapest $/lb S on the sheet is no longer the right answer
State of the Industry
For the first time this season, both sides of the margin moved the grower's way in the same week — and only one of them looks durable. December corn closed the week at $4.87½, up 20 cents, and November soybeans at $12.53½, up 50½ cents, on Midwest heat building into August (Pro Farmer, Jul 24, 2026). Retail nitrogen, meanwhile, printed lower for a sixth straight week (DTN, Jul 22, 2026). A grower who has priced neither side has watched roughly 20 cents of corn revenue and a double-digit percentage of the nitrogen bill move their way inside five trading days. That is not a normal week, and it is worth acting on rather than admiring.
| Benchmark | Level | Move | Basis |
|---|---|---|---|
| Urea, retail | $682/st | −7% MoM | Delivered to farm, Jul 13-17 |
| Anhydrous, retail | $967/st | −11% MoM | Delivered to farm, Jul 13-17 |
| UAN32, retail | $465/st | −15% MoM | Delivered to farm, Jul 13-17 |
| DAP, retail | $911/st | slightly higher MoM | Delivered to farm, Jul 13-17 |
| MAP, retail | $958/st | slightly higher MoM | Delivered to farm, Jul 13-17 |
| Potash, retail | $494/st | slightly lower MoM | Delivered to farm, Jul 13-17 |
| Urea, wholesale benchmark | $451/MT | +21.1% MoM | Benchmark quote, Jul 24 |
| Corn, Dec | $4.87½/bu | +20¢ on the week | CBOT settle, Jul 24 |
| Soybeans, Nov | $12.53½/bu | +50½¢ on the week | CBOT settle, Jul 24 |
| Wheat, Sep KC | $7.45¼/bu | +13¢ on the week | KCBT settle, Jul 24 |
Sources: DTN/Progressive Farmer, Jul 22, 2026 (survey week Jul 13-17); Trading Economics urea benchmark, Jul 24, 2026; Pro Farmer, Jul 24, 2026.
The input relief is already being withdrawn upstream. The wholesale urea benchmark finished the week at $451/MT, up 21.1% in a month even as retail urea fell 7% to $682/ton (Trading Economics, Jul 24, 2026; DTN, Jul 22, 2026). Retail is clearing tons bought at spring pricing; wholesale is quoting the fall fill. That gap has been open for three weeks and it has widened, not closed, which puts a visible clock on the retail decline. The forward curve does not expect the wholesale strength to hold either — the same series is modeled at $439/MT by quarter-end and $390 in twelve months — so what is on offer is a window, not a trend.
Phosphate is still the line that will not cooperate. DAP at $911 and MAP at $958 were both nominally higher on the month and are up 12% and 13% on the year, against potash at $494 and up 3% (DTN, Jul 22, 2026). A grower cutting the fertility bill this fall will find nearly all of the available savings in the nitrogen line and almost none in the P line, which turns the phosphate decision into a rate-and-agronomy question rather than a purchasing one.
The crop driving the rally is not, on paper, in trouble. Corn was 67% good-to-excellent as of July 19, down a point on the week and seven points behind last year's 74%, while soybeans improved for a second straight week to 66% (USDA NASS, Jul 20, 2026). Iowa is carrying corn at 80% and beans at 79% on temperatures running 5-10 degrees above normal with sparse rain (Iowa Crop Progress, Jul 20, 2026). Good ratings, dry heat, and pod-set underway is exactly the setup that rallies beans on forecast rather than on damage — and it can reverse on one wet week.
What to watch. The July 27 Crop Progress print, for whether the corn rating slips a second week; Mosaic's Q2 results on August 4 and CF Industries' on August 5, for what producers say about fall order books rather than what they earned; and the next DTN retail survey, for whether six weeks of declines becomes seven or the wholesale move finally lands at the farm gate.
Verdict: a real margin window opened this week, and the wholesale nitrogen tape says the input half of it closes first.
Weekly Briefing
Fertilizer
Sixth straight week of lower retail prices; anhydrous back under $1,000 — DTN's survey for July 13-17 put anhydrous at $967/ton, down 11% on the month and under $1,000 for the first time in 17 weeks, with UAN32 down 15% to $465 and urea down 7% to $682. All eight tracked products remain higher year-over-year. (DTN/Progressive Farmer, Jul 22, 2026)
Wholesale urea went the other way, hard — The urea benchmark closed at $451/MT on July 24, up 21.1% in a month and essentially flat year-over-year, with the same series modeled at $439/MT by quarter-end and $390 in twelve months. Retail and wholesale are pricing different tons, and the gap widened again this week. (Trading Economics, Jul 24, 2026)
Two producers hold most of U.S. ammonia capacity — University of Illinois researcher Henrique Monaco put CF Industries and Nutrien together at roughly 55-60% of U.S. ammonia production capacity, with the top four at about 70%, and noted that the number of firms and operating plants has fallen since 2000. The U.S. is roughly 15% of global fertilizer production. (RFD-TV, Jul 24, 2026) Market read: CF — Hold. The tight-supply case through 2027 is real and largely in the price, and the retail tape is falling into the print.
Producer earnings land in nine days — Mosaic reports Q2 on August 4 and CF Industries on August 5. Analyst consensus has CF at $5.71/share against $2.37 a year ago, and Mosaic at $0.11 against $0.51 — the cleanest single illustration of the nitrogen-versus-phosphate split this year. Consensus figures, not company guidance. (Company IR calendars and analyst consensus via market coverage, Jul 2026)
Crops
Corn and beans rallied on August weather — December corn settled at $4.87½ on July 24, up 20 cents on the week, and November soybeans at $12.53½, up 50½ cents, as Midwest heat built ahead of the key pod-fill month. September KC wheat added 13 cents to $7.45¼ after scoring contract highs overnight and reversing lower. (Pro Farmer, Jul 24, 2026)
Corn conditions slipped a point; beans improved again — As of July 19, corn was 67% good-to-excellent, down one point on the week and seven points behind last year's 74%, while soybeans rose for a second straight week to 66%. (USDA NASS Crop Progress, Jul 20, 2026)
Iowa is hot, dry, and still rated well — Iowa corn came in at 80% good-to-excellent and soybeans at 79%, with beans 70% blooming and 34% setting pods, on temperatures 5-10 degrees above average and sparse rainfall. Good ratings plus a dry forecast is the combination that moves the bean market on what might happen rather than on what has. (Iowa Crop Progress and Condition, Jul 20, 2026)
Home & Garden
Skip the summer lawn feeding — Extension guidance is blunt on this: cool-season lawns do not need fertilizer in June, July or August, and feeding a heat-stressed lawn raises water demand and stress rather than color. Mow at the highest setting for your grass type so the canopy shades the soil. (University of Minnesota Extension, 2026)
Late July is fall-garden time, not clean-up time — This is the window to start seed for fall crops. Beets, bush beans, carrots, cauliflower, broccoli, lettuce, kale and peas planted in midsummer carry into fall and winter harvest. (N.C. Cooperative Extension; USU Extension, Jul 2026)
Blossom end rot is a watering problem before it is a calcium problem — Uneven soil moisture is the usual cause in tomatoes and peppers, and steady moisture fixes more cases than a calcium product does. Late in the season, back the nitrogen off and lean on potassium and phosphorus — the plants needed the N early, for foliage. (University of Maryland Extension; USU Extension, Jul 2026)
Micronutrients
The North American micronutrient market keeps compounding quietly — Market-research estimates put North American micronutrient fertilizer at about $0.64 billion in 2025 rising to roughly $0.71 billion in 2026. These are vendor-side projections rather than measured tonnage, and should be read as direction, not census. (Mordor Intelligence, 2026)
Micros are a multiplier on the macro bill, which is the argument this year — The standing agronomic case is that a zinc- or boron-deficient field cannot convert extra nitrogen into yield, so the micro line protects the return on the much larger N-P-K spend. With nitrogen finally cheaper and phosphate not, that argument gets easier to fund this fall. (AgroLiquid agronomy guidance, 2026)
Boron and zinc get a global airing this month — U.S. Borax convened its Global Micronutrient Summit in July, with balanced fertilization and boron/zinc management on the agenda. A useful reminder that this category is pushed hardest by its suppliers, and that independent grower-side trial data still lags the marketing. (U.S. Borax, Jul 2026)
Organics
Poultry-manure biofertilizer keeps taking share — Market estimates put the poultry manure biofertilizer segment at roughly $1.30 billion in 2025 and $1.44 billion in 2026, with solid products holding the majority share because they run through conventional spreading equipment. Vendor-side market research, not audited tonnage. (Market research summaries, 2026)
The nitrogen decline does not reach manure — Litter and compost draw most of their value from the phosphate and potash lines, and those did not fall this month. Cheaper retail urea makes commercial N look better against manure N while leaving manure's P and K value intact, so the haul-radius math moves — but not in the direction the falling-fertilizer headline suggests. (Crop Root Zone analysis of DTN retail prices, Jul 22, 2026)
Up and Coming
Engineered soil microbes enter real field trials for corn nitrogen — Switch Bioworks said in June it has USDA and EPA authorization for advanced field trials of a microbial fertilizer across multiple U.S. Midwest sites, testing whether its engineered microbes reliably colonize corn roots and fix nitrogen under field conditions. Early-stage: this category has a long record of greenhouse results that do not survive contact with a production field. (Switch Bioworks announcement, Jun 3, 2026)
Green ammonia shifts from pilots to construction — Trade coverage this summer describes 2026 as the year green ammonia projects moved from announcement to electrolyzer installation, helped by falling electrolyzer costs and firmer policy. None of this is near-term supply for a North American grower — first volumes are aimed at industrial and marine offtake, not the retail fertilizer market. (Fertilizer Daily, Jun 24, 2026)
Ag-data and precision-application funding keeps flowing at small ticket sizes — Recent rounds include $13 million for agricultural data infrastructure and about £1 million for a precision spraying system. These are seed- and Series-B-scale bets, not deployed acreage. (AgTech funding coverage, Jul 2026)
Interesting
Consolidation, not just gas, is in your fertilizer price — The U.S. ammonia concentration figures above — two firms at 55-60%, four at about 70% — are being offered by university researchers as a structural reason retail prices fall more slowly than input costs do. Worth holding next to any explanation that begins and ends with natural gas. (RFD-TV, Jul 24, 2026)
The cheapest nitrogen still costs the most to apply — Anhydrous is the cheapest nitrogen per pound on the board at $0.59/lb N against urea's $0.74, and it is also the most expensive product to get into the ground. The gap between product price and applied cost is where a lot of fall buying decisions actually get made. (DTN, Jul 22, 2026)
Off the Wall Discovery
Cattle prefer burned ground, and gain better on it — USDA Agricultural Research Service work out of Miles City, Montana, comparing burned and unburned patches, found cattle grazing preferentially in recently burned areas — where forage crude protein, fiber digestibility, energy and several minerals ran highest — and cattle in pastures containing burned patches gained more weight than those without. It cuts against the common advice to defer grazing for two years after a fire. Single-program rangeland research, not a recommendation for your pasture. (USDA ARS, Miles City; peer-reviewed rangeland trials, 2025-2026)
A modeled diet shift would free a great deal of ground — A modeling study circulating this month projects that a global shift toward healthier diets could sharply reduce livestock farming and cut land-use-change emissions by up to 85% by 2050. It is a scenario model with its assumptions doing most of the work, and no part of it describes anything happening now. (Research coverage, Jul 2026)
The Import Floor: Why Falling Retail Nitrogen Won't Chase the 2024 Lows
Retail urea is down six straight weeks, but the US imports roughly a third of the urea it uses, and the replacement cost is set in Cairo, the Arab Gulf and India's tender room — the floor under fall fill is a landed-cost number, not a domestic one
US retail urea has now fallen for six straight weeks, and DTN's most recent survey put the delivered farm price at $682/ton for the week of July 13–17, down 7% month-over-month (DTN/Progressive Farmer, Jul 22, 2026) [1]. Read in isolation, that is a market rolling over, and the reflexive next thought is that urea is retracing the whole 2026 war spike back toward where it started. But the wholesale number underneath it tells a different story: the New Orleans (NOLA) urea barge reference sat at roughly $452/short ton on July 23, 2026 (Trading Economics, Jul 23, 2026) [2], and that number is not set in Iowa. It is set in Cairo, in the Arab Gulf, and in the tender room in New Delhi, then trucked and barged inland with freight and margin stacked on top. The United States is the world's third-largest urea importer, and the price a Corn Belt retailer pays to replace a ton is a landed-cost calculation. Understanding where that floor sits is the difference between prepaying fall nitrogen intelligently and waiting for a bottom that the trade math says will not arrive.
1. The US makes its own ammonia and still imports its urea
What's new: The single most misunderstood fact in North American nitrogen is that "energy independence in natural gas" did not buy independence in finished nitrogen fertilizer. The US is very nearly self-sufficient in ammonia — USGS put net import reliance for ammonia at just 5% of apparent consumption in 2025 (USGS Mineral Commodity Summaries 2026) [3]. But ammonia is the intermediate, not the product a grower spreads. Converting ammonia into granular urea takes dedicated capacity the US has never fully built out, so the country remains a large, structural importer of the finished good.
Evidence: The US imports roughly one-third of the urea it consumes, and that dependence is seasonally concentrated — a disproportionate share arrives in the spring import window when domestic demand peaks (farmdoc daily / University of Illinois, Apr 2026) [4]. The dollars are not small: US urea imports ran to roughly $2.02 billion in the first eleven months of 2025, sourced principally from Canada, Russia and Qatar (US trade data, 2025) [5]. A country that buys a third of its supply from Qatar and Russia does not get to set its own price.
| Nutrient basis | US net import reliance | What sets the marginal price |
|---|---|---|
| Ammonia (intermediate) | ~5% (2025) [3] | Domestic gas + regional supply |
| Finished urea | ~⅓ of consumption [4] | Middle East / Egypt FOB + freight |
| Potash | ~90%+ | Canada (Canpotex) + global seaborne |
Source: USGS Mineral Commodity Summaries 2026 [3]; farmdoc daily, Apr 2026 [4]. Potash reliance shown for context.
Ground Truth: The ammonia-versus-urea distinction is the whole argument. Anyone pointing at cheap US natural gas as a reason domestic urea "should" collapse is pricing the wrong molecule. The marginal ton of urea in the US is an imported ton, and an imported ton is worth what it costs to land it from the Arab Gulf or Egypt. That is why the NOLA barge — the first wholesale price inland of the import docks — behaves like a seaborne commodity and not like a domestic manufactured good, and why it will stop falling well before retail sentiment says it should.
2. The price is set at the tender, not the co-op
What's new: The clearing price for internationally traded urea is discovered in a handful of large import tenders, and India runs the biggest of them. When India's canalizing agencies float a tender for two to three million tonnes, every exporter in the world prices off the result. This spring's tenders did not clear cheap.
Evidence: Indian Potash Limited's spring 2026 tender sought on the order of 2.5 million tonnes and cleared at roughly $935/tonne CFR for west-coast delivery and $959/tonne CFR for the east coast, with offers ranging as high as $1,136/tonne — an award worth on the order of $2.64 billion that lifted global FOB values to four-year highs above $700/tonne FOB (Profercy, 2026; ANI/Business Today, Apr 2026) [6][7]. Those are war-market numbers, inflated by the Strait of Hormuz disruption that took a large share of global supply offline, but they establish the point: the international market was clearing far above the US 2024 lows, and US import-parity moved with it.
| Benchmark | Level | Basis / date |
|---|---|---|
| India IPL tender (west coast) | ~$935/t | CFR, spring 2026 [6] |
| India IPL tender (east coast) | ~$959/t | CFR, spring 2026 [6] |
| Highest offers received | up to $1,136/t | CFR, spring 2026 [6] |
| Global FOB (post-tender) | $700+/t | four-year high [6] |
| NOLA barge (US wholesale) | ~$452/st | Jul 23, 2026 [2] |
| US retail urea (delivered) | $682/ton | week Jul 13–17 [1] |
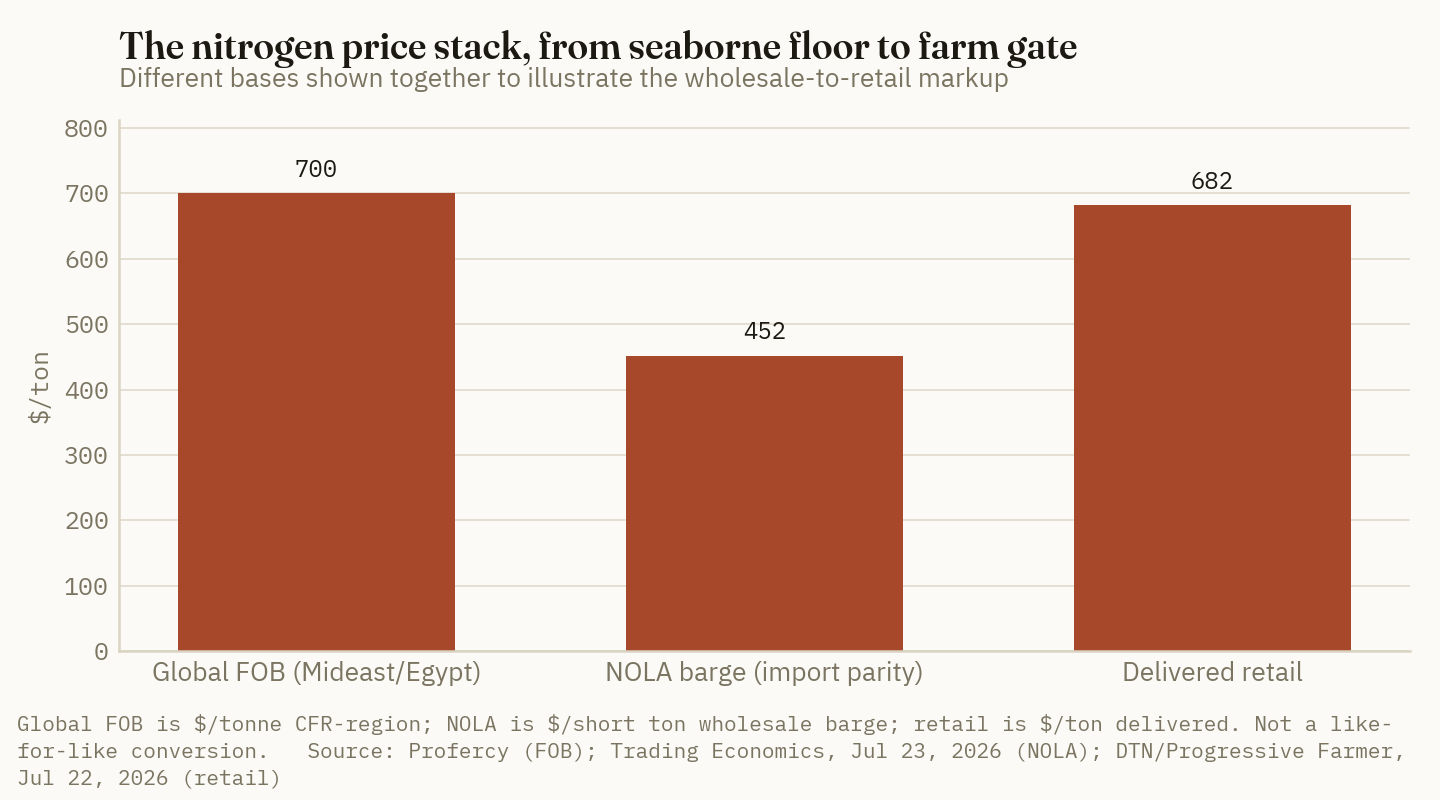
Source: Profercy [6]; ANI/Business Today, Apr 2026 [7]; Trading Economics, Jul 23, 2026 [2]; DTN/Progressive Farmer, Jul 22, 2026 [1]. Note tender CFR $/tonne and NOLA $/short ton are different bases and time points; shown together to illustrate the wholesale-to-retail stack, not as a like-for-like conversion.
The NOLA barge at ~$452/st has already retraced a long way from the spring war spike as the Hormuz situation de-escalated and freight normalized — but note what it did not do: it did not fall back to import-parity math built on $250–350/tonne FOB, because the FOB market itself never went back there. The floor moved up with the global benchmark and stayed there.
Ground Truth: The India tender is a leading indicator most US growers never watch and should. The next round of Indian and other subcontinent tenders — and whether they clear above or below the last — is a better forecast of where US fall urea settles than any amount of DTN week-to-week retail commentary. Retail is the lagging, trailing print. The tender is the market clearing in real time. If you want to know whether to prepay, watch the tender.
3. China is the swing spigot, and Beijing holds the valve
What's new: The other hand on the global urea price is China's, and it is a policy hand, not a market one. China moved to restrict fertilizer exports in March 2026 as the Hormuz crisis drove domestic prices up, then partially reopened urea through a quota system for the June–August shipping window (Hydrocarbon Processing, May 2026; trade press, 2026) [8][9]. Chinese tons returning to the seaborne market is the single largest bearish force available to the global balance — and it is entirely discretionary.
Evidence: China's export policy in 2026 has run on a quota-plus-price-floor logic: authorities issue specific volumes to selected producers and top-tier distributors for defined windows, protecting domestic supply first and releasing surplus into the export corridor only when Beijing judges the domestic market adequately supplied [9]. The practical consequence for a US buyer is that a meaningful chunk of the global supply curve appears and disappears on administrative decisions in Beijing, not on price signals.
| Global urea swing factor | Direction | Who controls it |
|---|---|---|
| Strait of Hormuz supply risk | Bullish | Geopolitics |
| China export quota | Bearish when open | Chinese policy |
| India / subcontinent tender demand | Bullish | Import agencies |
| Northern Hemisphere fall demand | Bullish (seasonal) | Weather / acreage |
| US domestic production | Neutral floor | Gas cost |
Source: Crop Root Zone synthesis of Hydrocarbon Processing, May 2026 [8] and 2026 trade-press coverage of China export policy [9].
Ground Truth: Price the China quota as an option, not a forecast. The bearish case for fall urea — the case for waiting to prepay — rests almost entirely on Chinese tons flowing freely into the export market through the fall. That is a bet on a policy decision by a government whose stated priority is domestic food security and domestic farmer input costs. It is a real possibility, not a base case. A grower structuring a fall program on the assumption that China floods the market is short a policy option they do not control, and the premium on that option is the difference between this year's floor and the 2024 lows.
4. What the import floor means for the fall-fill decision
What's new: Put the three forces together and the fall-fill decision stops being "will retail keep falling?" and becomes "how far above replacement cost is retail today, and is that gap likely to compress or widen?" Right now the gap is wide: NOLA wholesale near $452/st against delivered retail near $682/ton is roughly a $230 spread from the barge to the farm gate [1][2].
Evidence: That spread is not pure retail margin — it is freight from the river terminal, storage, handling, blending, application logistics and the retailer's carry and risk. But it is wide by historical standards, and a wide wholesale-to-retail gap in a falling market is precisely the condition under which retail has room to keep grinding lower even if the wholesale floor holds. The two prices can decouple for a stretch: the barge can sit on its import-parity floor while retail continues to bleed off the spring panic premium.
| Layer | Price | Notes |
|---|---|---|
| Global FOB (Middle East/Egypt) | $700+/t | four-year high, post-tender [6] |
| NOLA barge (import parity) | ~$452/st | Jul 23, 2026 [2] |
| Delivered retail | $682/ton | week Jul 13–17 [1] |
| Barge-to-retail spread | ~$230 | freight, storage, handling, margin |
Source: DTN/Progressive Farmer, Jul 22, 2026 [1]; Trading Economics, Jul 23, 2026 [2]; Profercy [6]. FOB and NOLA are different bases; the spread shown is retail minus NOLA.
Here is the inline read on where the risk sits, scaled to the size of each lever's plausible push on the fall NOLA floor:
| Force on the fall floor | Push | |
|---|---|---|
| China quota fully open | down | ██████████ |
| Weak Northern Hemisphere fall demand | down | █████ |
| India tenders clear lower | down | █████ |
| Hormuz re-escalation | up | ████████ |
| Seasonal fall fill demand | up | ██████ |
Source: Crop Root Zone qualitative assessment; bar lengths are the editors' judgment of relative impact, not measured quantities.
Ground Truth: The actionable split is between the wholesale floor and the retail lag. The wholesale floor — the NOLA barge — is close to done falling, because it is pinned to a global FOB market at four-year highs that only China can meaningfully break. The retail number has further to fall, because it is still carrying spring panic premium in that ~$230 spread. So the tactical answer for most operations is not "prepay now" and not "wait for the 2024 lows that aren't coming" — it is "let the retail lag close toward the wholesale floor, and pull the trigger when the farm-gate spread over NOLA compresses to a normal freight-and-margin figure, not before." You are not waiting for cheap urea. You are waiting for the retail markup to normalize against a floor that has already stopped moving.
Market read: CF — Add — CF Industries is a low-gas-cost domestic ammonia and urea producer whose realized prices track the same seaborne floor discussed here; an import-parity floor pinned at four-year-high FOB values, with the downside gated by a Chinese policy decision rather than by cost, is a constructive setup for a domestic producer selling into it. This reflects the editors' read on the pricing structure, not a recommendation to buy or sell the security.
5. The honest uncertainties
What's new: Three things could move this floor that we cannot forecast, and it is worth naming them rather than pretending the read is airtight.
Evidence: First, the Arab Gulf benchmark is a hostage to a shipping lane. Any re-escalation around Hormuz reprices the entire global curve upward within days, as it did this spring — that is upside risk to the floor, not downside. Second, China's quota is a black box; a decision to release large volumes into a soft fall market is the one thing that could genuinely break the import-parity floor, and there is no public schedule for it. Third, US fall and 2027-spring acreage — particularly the corn-versus-soybean split — sets the demand side of the domestic balance, and a large swing toward soybeans would soften domestic nitrogen pull independent of the global picture.
Ground Truth: None of these unknowns changes the core structure, which is the durable takeaway: the US buys a third of its urea abroad, so its wholesale price is a landed-cost number that cannot fall below global replacement cost for long. The 2024 lows were built on a global FOB market that no longer exists. Plan the fall program against the floor that is actually there — an import-parity number in the low-$400s NOLA, not the sub-$350 wholesale of two years ago — and treat any move below that as a China-quota gift to be taken, not a trend to be waited out.
References
- DTN/Progressive Farmer, "Fertilizer Prices Continue Downward Trend" — retail fertilizer survey, week of Jul 13–17, 2026, published Jul 22, 2026, https://www.dtnpf.com/agriculture/web/ag/crops/article/2026/07/22/fertilizer-prices-continue-downward
- Trading Economics, Urea (US Gulf / NOLA reference) — Jul 23, 2026, https://tradingeconomics.com/commodity/urea
- U.S. Geological Survey, Mineral Commodity Summaries 2026 — Nitrogen (Fixed) — Ammonia — 2026, https://pubs.usgs.gov/periodicals/mcs2026/mcs2026-nitrogen.pdf
- farmdoc daily (University of Illinois), "Middle East Conflict Revives Concerns Over Fertilizer Dependence in the U.S. and Brazil" — Apr 2026, https://farmdocdaily.illinois.edu/2026/04/middle-east-conflict-revives-concerns-over-fertilizer-dependence-in-the-u-s-and-brazil.html
- US import trade data compilation, US urea imports (~$2.02bn, first 11 months of 2025; principal origins Canada, Russia, Qatar) — 2025, https://www.usimportdata.com/blogs/us-urea-imports-data-hs-code-3102-usa-urea-buyers-database
- Profercy, "India eyes major urea award as tender lifts global FOB values to four-year highs" — 2026, https://www.profercy.com/insights/india-eyes-major-urea-award-as-tender-lifts-global-fob-values
- ANI News / Business Today, coverage of IPL global urea tender and clearing prices — Apr 2026, https://www.businesstoday.in/latest/economy/story/at-nearly-2x-price-india-to-import-record-urea-amid-hormuz-crisis-527202-2026-04-23
- Hydrocarbon Processing, "China allows fresh urea exports amid Iran war-fueled fertilizer crisis" — May 2026, http://www.hydrocarbonprocessing.com/news/2026/05/china-allows-fresh-urea-exports-amid-iran-war-fueled-fertilizer-crisis/
- Trade-press coverage of Chinese urea export quota and price-floor policy for the 2026 June–August shipping window — 2026, https://www.potatopro.com/news/2026/china-restricts-fertilizer-exports-tightening-global-supply-amid-market-disruptions
Disclosures
Crop Root Zone is an independent publication. Nothing here is investment advice. Market calls, where included, reflect the editors' own read and are not a recommendation to buy or sell any security.
Anhydrous Slips Under $1,000 for the First Time in 17 Weeks — and Widens Its Lead as the Cheapest Nitrogen in the Country
Retail anhydrous fell 11% in a month to $967, but it is still up 26% on the year and still 20-31% cheaper per pound of N than every liquid alternative. The fall buy is which molecule, not just when.
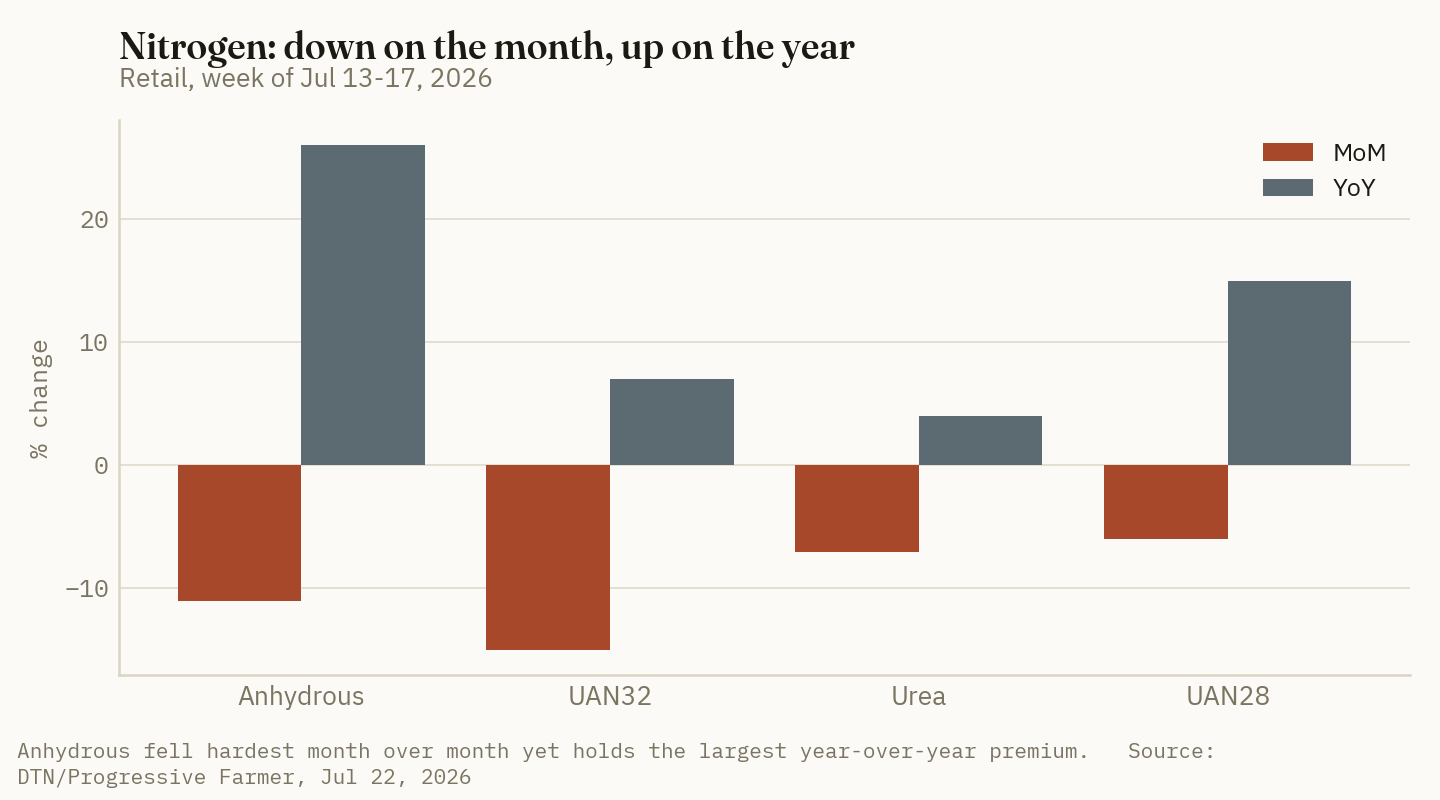
Anhydrous ammonia, the workhorse nitrogen of the Corn Belt, printed $967 per ton in DTN's retail survey for the week of July 13–17, 2026 — down 11% in a month and below the $1,000 line for the first time in 17 weeks (DTN/Progressive Farmer, Jul 22, 2026). It is the sixth week in a row that retail nitrogen has moved mostly lower, and anhydrous is leading the descent. But the same survey carries a second number that matters more than the first: anhydrous is still 26% more expensive than it was a year ago. Both facts are true, and a grower who reads only one of them will budget the 2027 crop wrong.
$967/ton
Retail anhydrous ammonia, week of July 13–17, 2026 — down 11% month over month, back under $1,000 for the first time in 17 weeks, and still up 26% year over year. (DTN/Progressive Farmer, Jul 22, 2026)
1. The markdown already delivered, and the one still coming
What's new: Anhydrous fell faster than any other nutrient this month, but it fell from the highest crisis premium, and the retail channel has passed through only part of the wholesale break.
Evidence: The mid-July retail board shows nitrogen rolling over while the phosphate and potash lines sit still:
| Product | $/ton | MoM | YoY | Basis |
|---|---|---|---|---|
| Anhydrous (82-0-0) | 967 | −11% | +26% | Delivered, retail |
| Urea (46-0-0) | 682 | −7% | +4% | Delivered, retail |
| UAN28 | 480 | −6% | +15% | Delivered, retail |
| UAN32 | 465 | −15% | +7% | Delivered, retail |
| DAP | 911 | +0.3% | +12% | Delivered, retail |
| MAP | 958 | −0.1% | +13% | Delivered, retail |
| Potash | 494 | flat | +3% | Delivered, retail |
Source: DTN/Progressive Farmer, Jul 22, 2026 (retail survey week of Jul 13–17).
The wholesale move underneath these retail numbers was far larger. NOLA urea barges fell more than 55% from their April peak near $782/t to roughly $350/t in late June before bouncing to about $421/t in July (Fertilizer Daily, Jun 24, 2026; Trading Economics, Jul 20, 2026). Retail urea, by contrast, is down 7% on the month and still up 4% on the year. The channel between the river and the farm gate — freight, terminal, storage, financing, dealer margin — moves slowly, and it is still carrying tonnes that were bought when the Strait of Hormuz was effectively closed and Middle Eastern supply was sidelined.
Anhydrous has the same lag, from a higher starting point. A year ago the domestic ammonia market had not yet absorbed the 2026 supply shock; the +26% year-over-year figure is what remains of that premium after a month of markdowns. The 11% monthly decline is real, but it is the start of the retail adjustment to a wholesale market that has already normalized, not the end of it.
Ground Truth: The most useful number in nitrogen this month is the gap between −11% month-over-month and +26% year-over-year. That 37-point spread is the retail markdown still owed to the grower — inventory bought at crisis prices working through a slow channel. Anyone who prepays fall anhydrous against today's $967 is paying for the premium that has not yet come out, not the one that already has. The retail decline is a trend to ride, not a level to lock.
Market read: CF — Hold — CF's ammonia franchise runs on cheap North American gas and is the most direct beneficiary of firm domestic nitrogen demand, but its earnings leverage points the same direction retail prices are now heading; the cost-curve advantage is durable, the headline-price tailwind is deflating.
2. Price it per pound of nitrogen, and the ranking never changed
What's new: Compared in the only honest unit — cost per pound of actual N — anhydrous did not just stay the cheapest nitrogen in the country through the price round trip. Its lead widened.
Evidence: Product-ton prices are not comparable across nitrogen sources because the products carry different nitrogen concentrations. Anhydrous is 82% N; urea 46%; UAN32 32%; UAN28 28%. Converting the mid-July retail board to dollars per pound of N:
| Source | Product $/ton | $/lb N | |
|---|---|---|---|
| Anhydrous (82-0-0) | 967 | 0.59 | ████████ |
| UAN32 (32-0-0) | 465 | 0.73 | ██████████ |
| Urea (46-0-0) | 682 | 0.74 | ██████████ |
| UAN28 (28-0-0) | 480 | 0.86 | ████████████ |
Source: Crop Root Zone calculation from DTN retail prices, Jul 22, 2026. $/lb N = product price ÷ (2,000 × N fraction). Bars scaled to UAN28 = 12.
At $0.59 per pound of N, anhydrous is roughly 20% cheaper than UAN32 and urea and 31% cheaper than UAN28. That ranking held through the entire 2026 price swing — through the April spike, the June break and the July retail markdown — because all four products draw on the same ammonia molecule and move together. What changes across the cycle is the size of the gap, and in a falling market the widest-spread product tends to lead down, which is exactly why anhydrous posted the biggest monthly decline this month.
The per-unit gap is not free money. Anhydrous is a pressurized, hazardous gas that requires specialized tanks, trained handling, a knifed-in application pass and — increasingly — regulatory compliance the liquids do not carry. Those costs are real and they narrow the delivered advantage. But they are largely fixed per acre, while the $0.15–0.27 per pound of N gap scales with the rate. On a 200-pound-N corn program, choosing anhydrous over UAN28 is a $54 per acre nutrient-cost difference before application — the kind of number that pays for the toolbar.
Ground Truth: The falling market is quietly rewarding the grower already set up for anhydrous and quietly punishing the one who switched to liquid convenience during the high-price years. When nitrogen was scarce and volatile, paying up for the flexibility of UAN made defensible sense. At $0.59 versus $0.86 per pound of N, that logic inverts: the convenience premium is now 46% on the cheapest-to-dearest spread. The acre that can run anhydrous should be running the switch-back math, not defaulting to last year's plan.
3. Why the wholesale signal points down and the calendar points up
What's new: The domestic ammonia wholesale market and the fall application calendar are pulling the buy decision in opposite directions — softer prices ahead, but a hard seasonal deadline.
Evidence: The upstream benchmark for anhydrous is the Tampa ammonia contract, the North American price-setter, and it is soft. After a multi-year high above $650/MT in the spring on Middle East supply losses, the July settlement came off roughly $110/MT versus June (qcintel headlines, July 2026); the August contract, which settles at the end of July, had not printed as of this writing. US Gulf FOB ammonia is estimated below the Tampa CFR level, in the $350–380/MT range. None of that argues for a bounce in domestic anhydrous before fall.
Against that, the fall-application window is a fixed constraint. Fall-applied anhydrous should go on after soil temperatures at four inches fall below 50°F and are trending lower, to slow the conversion of ammonium to leachable nitrate — typically late October into November across the central Corn Belt. That deadline does not move because prices are falling. A grower who waits for the wholesale market to find its floor may find the floor arrives after the soil is too warm or the ground too wet to apply.
This is the specific tension of a falling market with a seasonal deadline: the cheapest ton may be the one you cannot apply. The resolution is not to guess the low but to separate the two decisions. The molecule decision — anhydrous versus liquid — can be made now, on the per-pound-N math, which is not going to reverse. The timing decision — how much to commit at each price — can be laddered into the fall as the wholesale market and the August Tampa settlement clarify.
Ground Truth: Do not let a soft wholesale tape talk you past the agronomic window. The downside left in domestic anhydrous is real but bounded — Tampa is already off its highs and the retail lag is the bigger source of remaining markdown — while the cost of missing the fall window is a forced spring purchase into whatever the restocking cycle does to prices. Lock the acres you will apply this fall on a laddered basis and treat the last dollar of downside as a bonus you do not need to earn.
4. The number the falling-nitrogen headline hides
What's new: Nitrogen is the one macronutrient falling, and it is generating every headline. The other half of the fertility bill is not moving, and part of it is at records.
Evidence: In the same survey week, DAP was $911/ton (+0.3% MoM, +12% YoY), MAP $958 (−0.1% MoM, +13% YoY) and potash $494 (flat MoM, +3% YoY). The sulfur complex that feeds the S-bearing products is at all-time highs: the Q3 2026 Tampa molten sulfur contract settled at a record $705 per long ton, up $50 from Q2 (Argus, Jul 13, 2026), and Chinese sulfur spot was near 9,386 CNY/T in late July, up more than 300% year over year (Trading Economics, Jul 22, 2026).
So the input stack has split three ways at once: nitrogen falling, phosphate and potash flat near highs, sulfur at records. On a high-yield corn program, nitrogen is roughly half the fertilizer line and the other half is not participating in the markdown. A grower who reads "fertilizer prices are down" and lets the anhydrous headline set the tone for the whole budget will be right on one line item and wrong on three.
Ground Truth: The 2027 budgeting mistake is already visible: treating nitrogen's direction as fertilizer's direction. Bank the anhydrous savings, but pencil phosphate and potash flat and the sulfur line up. The acre that runs a sulfur program on high-yield corn or alfalfa is seeing its input bill split — cheaper N, dearer S — and the net can be close to a wash even as the anhydrous headline says relief has arrived.
References
- DTN/Progressive Farmer, "Fertilizer Prices Continue Downward Trend" (retail survey, week of Jul 13–17, 2026) — Jul 22, 2026. https://www.dtnpf.com/agriculture/web/ag/crops/article/2026/07/22/fertilizer-prices-continue-downward
- Fertilizer Daily, "StoneX: urea could drop another $30–50/t before recovering…" — Jun 24, 2026. https://www.fertilizerdaily.com/20260624-stonex-urea-could-drop-another-30-50t-before-recovering-but-h2-demand-will-pay-for-the-lost-tonnes/
- Trading Economics, Urea commodity price and forecast — accessed Jul 20, 2026. https://tradingeconomics.com/commodity/urea
- qcintel (Profercy) ammonia coverage, Tampa contract headlines — July 2026. https://www.qcintel.com/ammonia/
- Argus Media, "Tampa 3Q liquid sulphur price hits record $705/lt" — Jul 13, 2026. https://www.argusmedia.com/en/news-and-insights/latest-market-news/2851577-tampa-3q-liquid-sulphur-price-hits-record-705-lt
- Trading Economics, Sulfur commodity price — accessed Jul 22, 2026. https://tradingeconomics.com/commodity/sulfur
Disclosures
Crop Root Zone is an independent publication. Nothing here is investment advice. Market calls, where included, reflect the editors' own read and are not a recommendation to buy or sell any security.
Urea's Round Trip: Down 55% From April, Up 14% in a Month, and a Forward Curve That Says $368
The crisis premium came out of nitrogen faster than it went in — but the fall fill offer is being written against a supply base that lost tonnes it cannot make up.
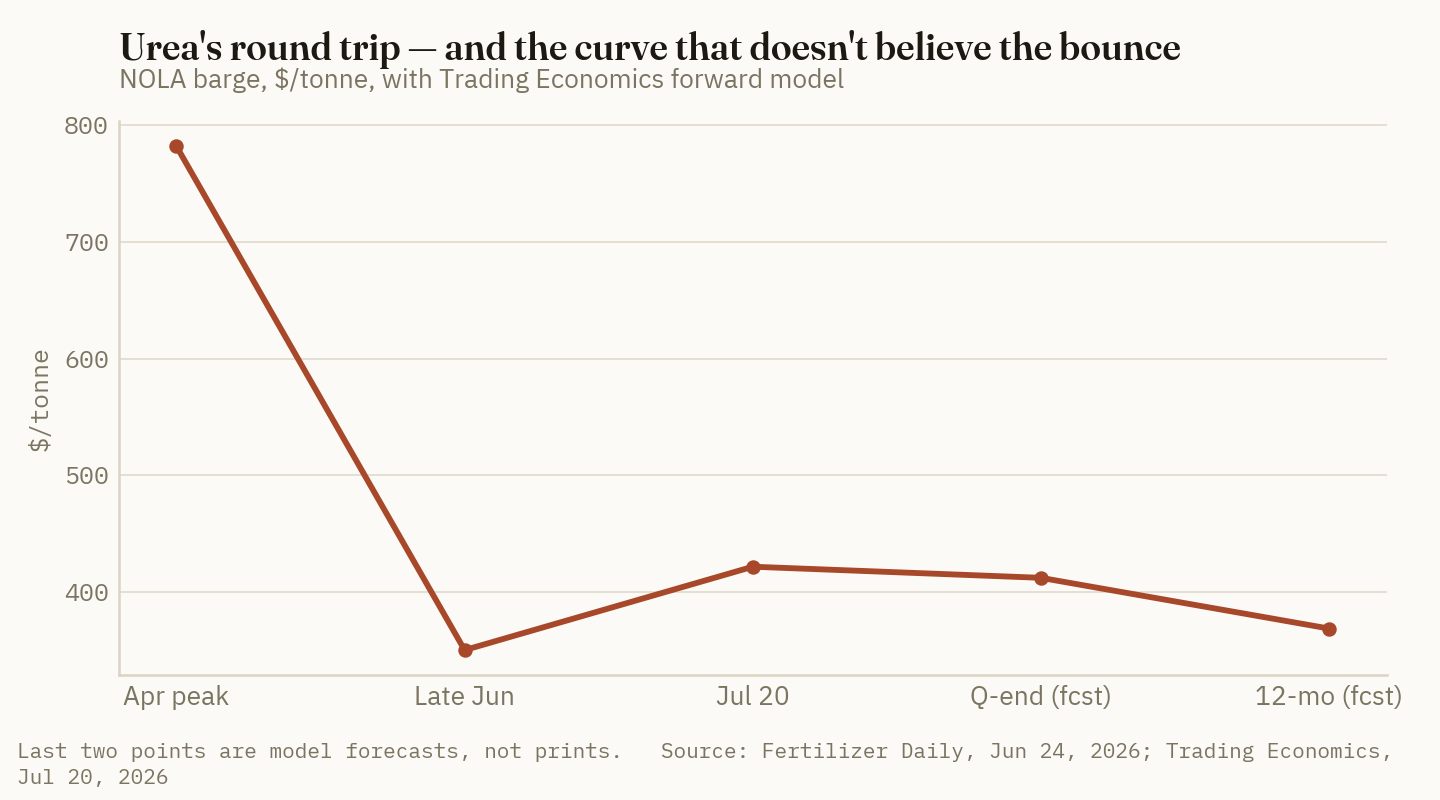
Urea has done something in four months that most fertilizer products do not do in four years: a complete round trip. NOLA barges peaked near $782 per tonne in April 2026, fell to roughly $350 per tonne in late June — a decline of more than 55% — and have since bounced back to $421.50 per tonne as of July 20, up nearly 14% in a month (Fertilizer Daily, Jun 24, 2026; Trading Economics, Jul 20, 2026). Three prices, one product, one growing season. The question every buyer now faces is which of the three is real, and the honest answer is that the market itself has not decided: Trading Economics' own forward model carries urea at $411.97 at quarter-end and $368.46 in twelve months, which is to say the curve is treating the July bounce as noise inside a downtrend.
1. The round trip, in numbers
What's new: The April spike and the June collapse were the same event seen from opposite ends. Nitrogen's move this year was never a demand story; it was a shipping story that resolved.
55%
The peak-to-trough fall in NOLA urea barges between April and late June 2026 — roughly $432 per tonne, in eleven weeks. (Fertilizer Daily, Jun 24, 2026)
Evidence: Roughly one-third of global urea trade originates in the Middle East, and that flow was largely sidelined during the effective closure of the Strait of Hormuz earlier in 2026 (Fertilizer Daily, Jun 24, 2026). China restricted exports over the same window. European producers ran at reduced rates on elevated LNG costs. With three of the world's four major supply blocs constrained at once, NOLA barges did what a physically short market does — they went to $782. Argus's contemporaneous coverage of the spike was headlined plainly: Nola urea prices surge on US-Iran conflict.
The unwind was equally mechanical. A preliminary US–Iran arrangement was announced June 15, 2026, and the freight premium began deflating almost immediately. By late June the barge market was at $350 — 55% off the peak.
Retail is a lagging, smoothed reflection of the same move. DTN's survey for the week of July 6–10, 2026 was the fifth consecutive week of mostly lower retail nitrogen:
| Product | $/ton | MoM | YoY | Basis |
|---|---|---|---|---|
| Urea | 714 | −6% | +9% | Delivered, retail |
| Anhydrous | 1,032 | −6% | +34% | Delivered, retail |
| UAN28 | 493 | −7% | +18% | Delivered, retail |
| UAN32 | 529 | −7% | +6% | Delivered, retail |
Source: DTN/Progressive Farmer, Jul 15, 2026 (survey week Jul 6–10).
Retail is coming down. It is not coming down as fast as the barge did, and it is not coming down from the same starting point.
Ground Truth: The gap between the wholesale collapse and the retail decline is the most actionable number in nitrogen right now. NOLA fell 55% from peak; DTN retail urea fell 6% in a month and is still up 9% year over year. That gap is not retailer greed — it is inventory bought at crisis prices working through a channel with a slow turn. Which means the retail markdown still ahead of the grower is larger than the markdown already delivered, and anyone who prepays into today's retail number is paying for tonnes priced in a market that no longer exists.
Market read: CF — Hold — CF's earnings leverage runs straight through the crisis premium that is now deflating; the cheap-gas cost advantage is real and durable, but it does not replace $400/t of headline price.
2. Why the most-followed call in nitrogen is two-sided
What's new: The dominant sell-side view on nitrogen right now is explicitly bearish near-term and bullish after that — and both halves matter to the fill decision.
Evidence: StoneX's Josh Linville has projected another $30–50 per tonne of downside before the market turns, while simultaneously arguing the recovery will be sharp: when demand returns, prices will rise substantially because "the market will pay for the sins of lost tonnes" (Fertilizer Daily, Jun 24, 2026).
That phrasing does real analytical work. Production lost during the Hormuz window is not recoverable inventory — a urea plant that did not run in March cannot run twice in September. Global operating rates were tight before the disruption. So the bear case for the next sixty days is about demand deferral, not supply abundance: northern-hemisphere application is behind, buyers have stepped back to watch a falling market, and nobody wants to catch the knife. The bull case for the sixty days after that is a restocking cycle running into a supply base with a hole in it.
Linville's practical advice — do not commit all purchases at once, and watch regional basis closely — is the correct posture for a market whose spot and forward point in opposite directions.
Ground Truth: A market where the near-term call is "down $30–50" and the medium-term call is "up substantially" is not a market to have an opinion about. It is a market to ladder. The specific error to avoid this fall is the one that felt clever in April: treating a single decision date as the whole strategy. If both halves of that view are right, the winning buyer is 40% covered near the bottom and 100% covered before the next Indian tender — not the one who tried to nail the low with one ticket.
3. The India tender is the referee
What's new: The next Indian urea import tender is the closest thing global nitrogen has to an objective arbiter, and it has not been called yet.
Evidence: India's state-run National Fertilisers Limited floated a tender to import 1.7 million tonnes in June 2026, and bids came in as low as $445–449 per tonne CFR for East and West Coast deliveries. Profercy's coverage of an earlier round noted a tender lifting global FOB values to four-year highs — a reminder of how much a single Indian buying event moves the world curve in either direction.
The next tender in the second half of 2026 is being watched as the benchmark that signals whether the market has moved from crisis-driven shortage to normalized supply (Fertilizer Daily, Jun 24, 2026). The reason it carries that weight is arithmetic: at 1.5–2.0 million tonnes per event, one Indian tender clears a meaningful slice of the world's uncommitted spot tonnage, and the clearing price tells every other buyer what the marginal tonne is genuinely worth rather than what a thin barge market says it is worth.
Note the geometry of the current numbers. NOLA at $421.50/t and Indian CFR bids at $445–449/t are close enough, after freight, that the two markets are roughly in equilibrium — itself a piece of information. It says the June break to $350 overshot, and that the July bounce was arbitrage closing, not a new bull leg.
Ground Truth: Read the next Indian tender for volume awarded, not headline price. If India awards close to the full quantity sought at or below the last round's $445–449 CFR, the world has enough tonnes and the curve's $368 is credible. If India tenders and walks away from a large share of the offers because sellers will not come down, the shortage thesis is intact and today's fall fill offer is cheap. The award ratio resolves the disagreement between spot and curve — and unlike most of this market, it is public.
4. What the fall fill offer actually has to clear
What's new: Fill programs are being written against a wholesale market that moved 55% one way and 14% back the other. The discount has to be measured against the right baseline, and most are not.
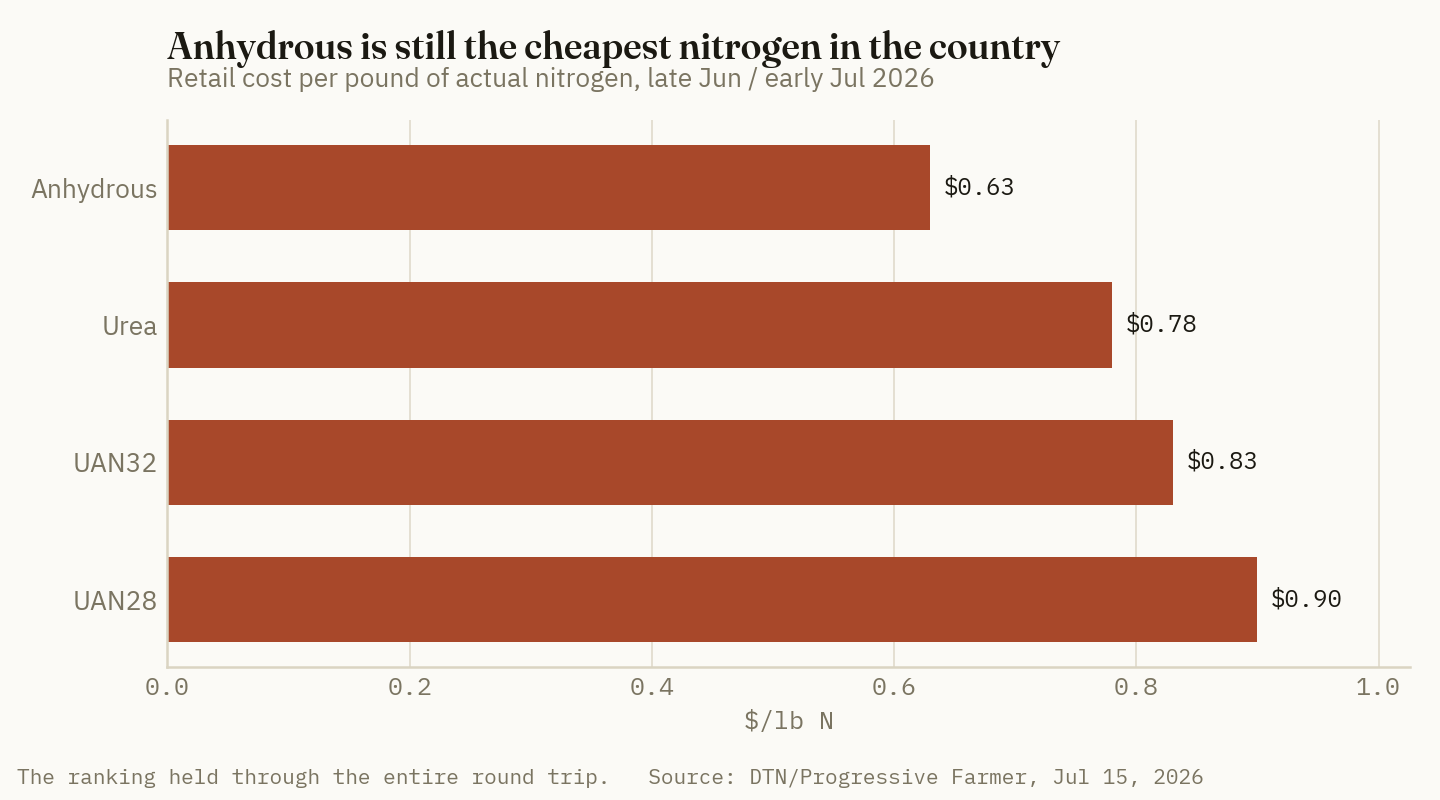
Evidence: Work in nitrogen units rather than product tons — the only honest way to compare a urea offer to an anhydrous offer. On DTN's late-June/early-July survey, cost per pound of nitrogen ran $0.78/lb N for urea, $0.63/lb N for anhydrous, $0.90/lb N for UAN28 and $0.83/lb N for UAN32 (DTN, Jul 15, 2026). Anhydrous remains the cheapest nitrogen in the country by a wide margin — 19% below urea and 30% below UAN28 per unit — and that ranking held through the entire round trip.
Regional dispersion at the distributor level is wider than most fill sheets acknowledge. For the week ending July 10, 2026, USDA AMS distributor asks put urea at $686.71/ton average in Oklahoma ($520–885), $897.50 in North Carolina ($825–970) and $1,099.80 in the Pacific Northwest ($875–1,350). Alabama came in at $809.40 for the week ending July 17 (USDA AMS Production Cost Reports). That is a $413/ton spread on the same 46-0-0 in the same week.
Crop Root Zone estimate: against a NOLA barge at $421.50/t (≈ $382/short ton), an Oklahoma distributor ask of $686.71/st implies roughly $305/st of freight, terminal, storage, financing and margin between the river and the farm gate. That layer — not the barge — is what a fill program is discounting from.
Ground Truth: Judge a fall fill offer against the forward curve, not the spot. With the model carrying $411.97 at quarter-end and $368.46 in twelve months, a program priced off today's $421.50 spot with a modest discount attached is offering a number the curve already expects to be free by spring. The offer worth signing has to clear the twelve-month forward plus the carrying cost of storage. And given anhydrous is still the cheapest nitrogen in the country per unit, the more valuable question this fall may not be when to buy urea but whether the acre should be on urea at all.
5. The trap: nitrogen is not the whole bill
What's new: Every headline in fertilizer right now is a nitrogen headline, and nitrogen is the one input that is falling. The rest of the bill is not.
Evidence: Over the same DTN survey week, DAP printed $912/ton (+0.3% MoM, +13% YoY) and MAP $954/ton (−0.1% MoM, +13% YoY) — flat month over month, sharply higher year over year. Potash was $494/ton, unchanged MoM and +3% YoY. Meanwhile the sulfur complex is at records: the Q3 2026 Tampa molten sulfur contract settled at $705 per long ton, up $50 from Q2 (Argus, Jul 13, 2026), and Chinese sulfur spot sat at 9,419 CNY/T on July 21, up 311% year over year (Trading Economics, Jul 21, 2026).
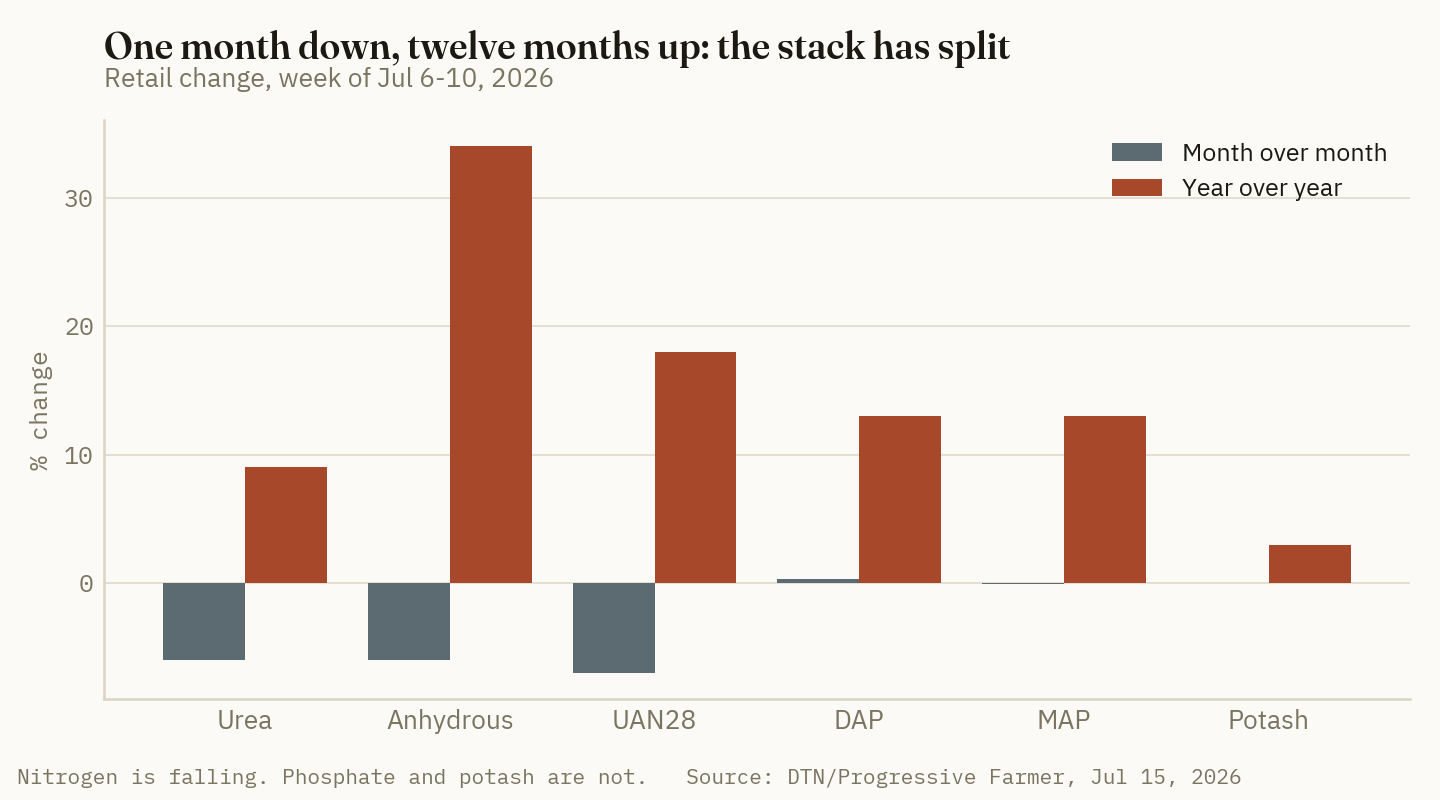
The input stack has split in three directions at once: nitrogen falling, phosphate and potash flat, sulfur at all-time highs. A grower who reads "fertilizer prices are down" and budgets accordingly will be wrong on three of four macronutrients.
There is a second-order version of the same trap on the sell side of the farm gate. Nitrogen's decline lands almost entirely on corn, which is where the pounds are; sulfur's rise lands hardest on the acres running an S program on high-yield corn, alfalfa and canola. Two farms in the same county with different crop mixes are experiencing opposite fertilizer markets this month, and both are reading the same headline.
Ground Truth: The 2027 budget error will not be nitrogen — it will be the assumption that nitrogen's direction is fertilizer's direction. On a 180-bushel corn program, nitrogen is roughly half the fertilizer line; the other half is phosphate, potash and sulfur, and none of those three is falling. Anyone who lets a 6% retail nitrogen decline set the tone for the whole input budget will come up short in one specific place: the sulfur line, which is being repriced off a feedstock that has tripled in a year.
References
- Fertilizer Daily, "StoneX: urea could drop another $30–50/t before recovering, but H2 demand will pay for the lost tonnes" — Jun 24, 2026. https://www.fertilizerdaily.com/20260624-stonex-urea-could-drop-another-30-50t-before-recovering-but-h2-demand-will-pay-for-the-lost-tonnes/
- Trading Economics, Urea commodity price and forecast — accessed Jul 20–21, 2026. https://tradingeconomics.com/commodity/urea
- DTN/Progressive Farmer, "UAN Fertilizers Lead Nutrient Prices Downward" (retail survey, week of Jul 6–10, 2026) — Jul 15, 2026. https://www.dtnpf.com/agriculture/web/ag/crops/article/2026/07/15/uan-fertilizers-lead-nutrient-prices
- Profercy, "India eyes $2.64bn urea award as tender lifts global fob values to four year highs" — 2026. https://www.profercy.com/insights/india-eyes-major-urea-award-as-tender-lifts-global-fob-values
- Argus Media, "Nola urea prices surge on US-Iran conflict" — 2026. https://www.argusmedia.com/en/news-and-insights/latest-market-news/2794957-nola-urea-prices-surge-on-us-iran-conflict
- USDA AMS Livestock, Poultry & Grain Market News — Oklahoma, North Carolina and Pacific Northwest Production Cost Reports (week ending Jul 10, 2026); Alabama Production Cost Report (week ending Jul 17, 2026). https://mymarketnews.ams.usda.gov/
- Argus Media, Q3 2026 Tampa molten sulfur contract settlement, $705/lt delivered — Jul 13, 2026.
- Trading Economics, Sulfur commodity price — accessed Jul 21, 2026. https://tradingeconomics.com/commodity/sulfur
Disclosures
Crop Root Zone is an independent publication. Nothing here is investment advice. Market calls, where included, reflect the editors' own read and are not a recommendation to buy or sell any security.
Phosphate's Fall Floor: DAP Holds $911 While Nitrogen Slides
Retail DAP sits near cycle highs — up 12% on the year — even as anhydrous has shed $69/ton since July began. The decoupling is structural, and it turns the fall P decision from a cost call into a yield call.
Retail nitrogen is in open retreat. In the week of July 13-17, 2026, delivered anhydrous ammonia fell to $967/ton — under $1,000 for the first time in 17 weeks and down 11% from a month earlier — while urea dropped 7% to $682 and UAN32 shed 15% to $465 (DTN/Progressive Farmer, Jul 22, 2026). Six of the eight benchmark fertilizers DTN tracks moved lower for a sixth consecutive week. Phosphate was not among them. DAP printed $911/ton and MAP $958, both fractionally higher on the month and sitting within a few dollars of their cycle highs. Nitrogen is unwinding a year of gains in a matter of weeks; phosphate has simply refused to participate. For a grower pricing a fall program against $4.40 new-crop corn, that divergence — not the headline "prices are falling" — is the number that matters.
1. The tape: two nutrients, opposite directions
What's new: The softening that has dominated the retail nitrogen headlines since June has not reached the phosphate aisle. Over the first three weeks of July, anhydrous fell from $1,036 to $967 — $69/ton — while DAP moved from $910 to $911 (DTN/Progressive Farmer, Jul 8 and Jul 22, 2026). On a year-over-year basis the split is just as clean: DAP is up 12% and MAP up 13%, holding gains that nitrogen is now handing back.
Evidence: The benchmark retail table shows phosphate as the only nutrient group not rolling over.
| Product | $/ton | MoM | YoY | Basis |
|---|---|---|---|---|
| DAP | 911 | +0% | +12% | Delivered, retail |
| MAP | 958 | +1% | +13% | Delivered, retail |
| Potash | 494 | −0% | +3% | Delivered, retail |
| Urea | 682 | −7% | +4% | Delivered, retail |
| UAN32 | 465 | −15% | +7% | Delivered, retail |
| Anhydrous | 967 | −11% | +26% | Delivered, retail |
Source: DTN/Progressive Farmer Retail Fertilizer Trends, Jul 22, 2026 (week of Jul 13-17).
The same divergence, shown as the rate of change that actually moves a buying decision:
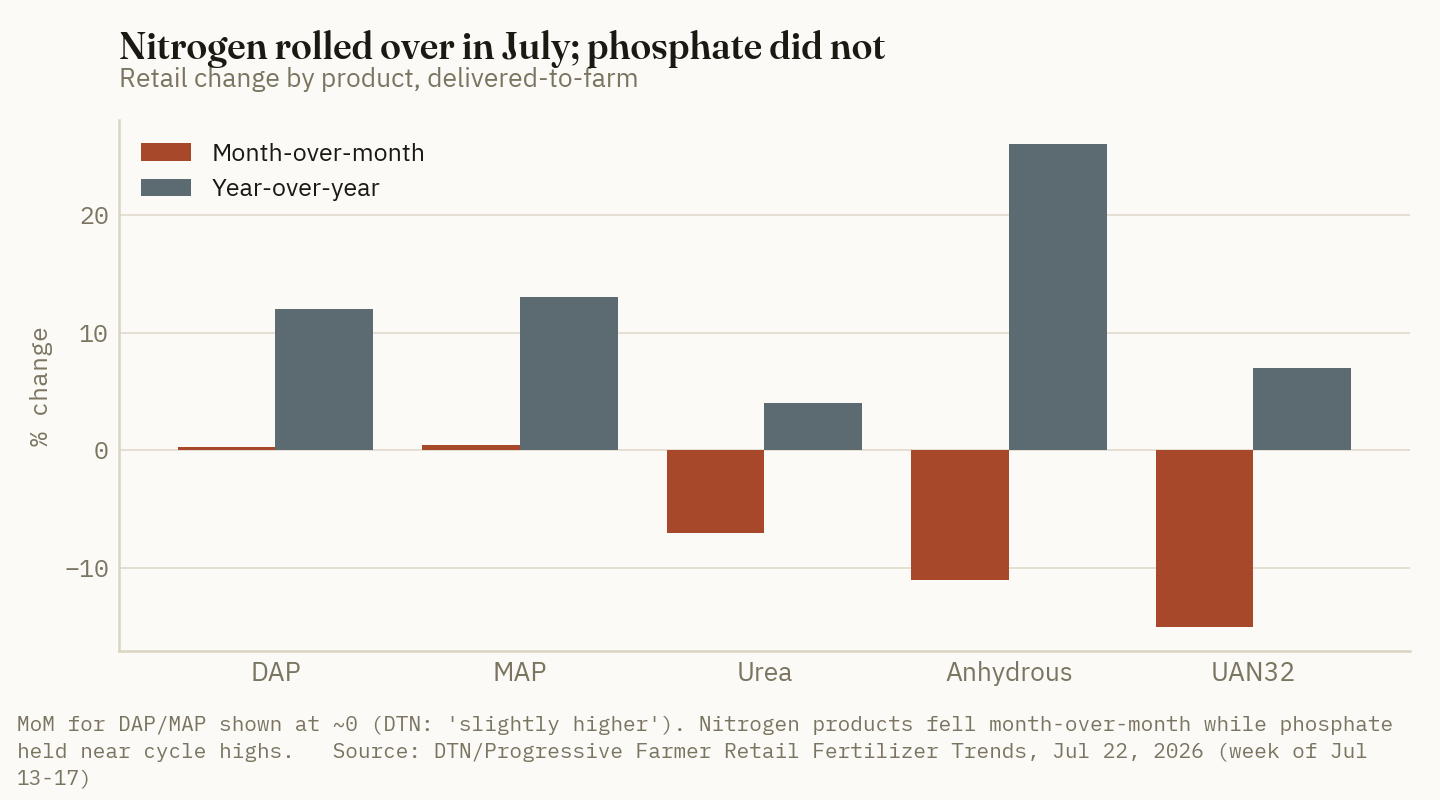
Ground Truth: Nitrogen and phosphate are priced off different clocks right now. Nitrogen is a gas-and-freight story that re-rates weekly with natural gas and vessel logistics, so it fell the moment planting demand cleared. Phosphate is a rock-and-sulfur story with a policy lid on it, and none of those inputs eased in July. Treat the "fertilizer prices are falling" narrative as a nitrogen statement only — if you carry it into your P budget you will mis-plan the larger of the two problems.
2. The sulfur floor under DAP
What's new: The single biggest reason phosphate can't follow nitrogen down is the cost of making it. Every ton of DAP or MAP consumes sulfur, converted to sulfuric acid to dissolve phosphate rock, and sulfur is at a record. Third-quarter molten sulfur into Tampa — the benchmark delivery for the U.S. phosphate belt — settled at $705/long ton, up $50 from Q2's $655 and the highest on record (Argus Media, Jul 13, 2026).
Evidence: That feedstock inflation shows up directly in producer cost. Mosaic, the largest U.S. phosphate producer, reported a realized sulfur cost of $379/tonne in Q1 2026 and guided Q2 sulfur cost to roughly $540/tonne — a ~$160/tonne jump in a single quarter — while pegging the marginal cost of incremental sulfur at about $1,200/tonne (Mosaic Q1 2026 earnings call, May 11, 2026). Sulfur supply is derived from oil and gas refining, and the 2026 Gulf disruptions tightened it at exactly the moment phosphate demand was firm.
$705/lt
Q3 2026 Tampa molten sulfur contract — a record, up 8% ($50/lt) from Q2. Sulfur is the acid in phosphate; a record here is a floor under DAP. (Argus Media, Jul 13, 2026)
Evidence, continued: Because sulfur is a variable cost that scales with every ton produced, it does not behave like the fixed overhead a producer will absorb to keep volume moving. When the marginal ton costs $1,200 in sulfur alone, the rational producer stops making the marginal ton — which is the opposite of the discounting that dragged nitrogen lower.
Ground Truth: The sulfur line is why the usual "prices always come down after planting" instinct is wrong for P this year. Nitrogen fell because sellers had inventory and no demand; discounting cost them freight and carry. Phosphate producers facing $1,200/tonne marginal sulfur have the opposite incentive — cut output, not price. Until Tampa sulfur breaks, the DAP floor holds regardless of how weak farm demand looks in August.
Market read: MOS — Hold — record stripping margins (Mosaic guided Q2 realized phosphate margins above $400/tonne) are already in the stock, and curtailment caps the volume that margin runs across.
3. A closed market: China, Hormuz, and two domestic firms
What's new: Phosphate's price floor is not only a cost story; it is a supply-availability story, and the availability has been engineered shut. China — normally the swing exporter of seaborne phosphate — suspended phosphate fertilizer exports from December 2025 through at least August 2026, and separately halted sulfuric acid exports (multiple trade reports, Mar 2026). With Chinese DAP, MAP and TSP out of the water, the marginal seaborne ton the U.S. would otherwise import simply isn't offered.
Evidence: The supply picture behind the U.S. price is unusually concentrated on both ends.
| Supply lever | State in July 2026 | Effect on U.S. DAP |
|---|---|---|
| China seaborne exports | Suspended through Aug 2026 | ██████████ |
| Gulf/Hormuz sulfur & Saudi P flow | Disrupted | ███████ |
| Mosaic domestic output | Curtailing (Bartow, LA, Brazil) | ██████ |
| Domestic concentration | ~70%+ from two firms | █████ |
Source: Trade press on China export suspension (Mar 2026); Mosaic Q1 2026 earnings call (May 11, 2026); USITC phosphate review (2026). Bars are a qualitative ranking of tightening pressure, not a quantitative index.
Domestically, more than 70% of U.S. phosphate production comes from just two companies, Mosaic and Nutrien, and Mosaic has been openly curtailing — partially reducing rates at its Bartow and Louisiana plants and scaling back fertilizer output in Brazil, guiding Q2 phosphate sales down to 1.4-1.7 million tonnes from 1.9 million in Q1 (Mosaic Q1 2026 earnings call, May 11, 2026). The U.S. leans on imports from Saudi Arabia, Morocco, Egypt, Jordan and others to close the gap, and the Gulf disruptions that spiked sulfur also crimped Saudi seaborne phosphate.
That import dependence is partly self-inflicted policy. In 2021, following a Mosaic petition, Washington imposed a countervailing duty of 19.97% on Moroccan OCP phosphate and comparable rates on Russian material — a wall that, once Russian tons were separately sanctioned and Chinese tons withdrawn, left the U.S. buyer leaning on a domestic duopoly at exactly the wrong moment (USITC phosphate review, 2026). The structure that looked like protection in 2021 reads like exposure in 2026: a market short on imports, concentrated at home, and disciplined on both counts.
Ground Truth: This is a discipline market wearing a shortage costume. Even if Gulf tensions eased tomorrow, a producer earning $400+/tonne stripping margins has no reason to flood a market that China has kindly cleared of competition. The China ban's expiry date — nominally August — is the single most important number for 2027 P, and it is a policy variable, not a supply-and-demand one. Watch the NDRC calendar, not the weather.
4. The relief is real, but slow
What's new: There is a genuine bearish development for U.S. phosphate buyers — it just won't help the fall bill. A U.S. Court of International Trade ruling in December 2025 cut the countervailing duty on Morocco's OCP from 19.97% to 2.11%, the government dropped its appeal, and in mid-2026 Washington suspended duties on Moroccan phosphate for roughly eight months. OCP shipments to the U.S. could resume "within days" (USDA, relayed Jul 2026).
Evidence: OCP accounts for roughly 31% of the global phosphate market and Morocco holds more than 70% of known reserves, so reopening that lane is the most material new supply the U.S. has access to. But a duty suspension announced in July lands as vessels, not as a July retail print — the delivered tons, port handling, and retail repricing take weeks to months to work through the channel, well past the fall application window for most operations.
Ground Truth: The Morocco reopening is a 2027 story priced as a 2026 headline. It caps the upside on DAP — the floor is no longer bottomless — but it does not put tons in the shed for fall. Anyone deferring a fall P purchase in the hope that Moroccan supply cracks the retail price before application is betting on a channel that physically can't reprice that fast. The relief is real; the timing is wrong for this pass.
5. The so-what: phosphate is the harder line on the fall bill
What's new: In a $4.40 corn market — USDA's 2026-27 marketing-year average estimate (USDA WASDE, Jul 10, 2026) — the phosphate line is now doing more to compress the per-acre margin than nitrogen is, because it is the line that isn't falling. Nitrogen's retreat gives back real dollars per acre this fall; phosphate's stubbornness takes them.
Evidence: On a maintenance program for a 180 bu/acre corn crop, replacing roughly 65 lb of P₂O₅ removal at $911 DAP costs about $64/acre — and unlike the nitrogen line, that number is up year-on-year, not down.
| Nutrient | Program (180 bu corn)* | $/acre* | vs. year ago* |
|---|---|---|---|
| Phosphate (DAP) | ~65 lb P₂O₅ replacement | 64 | +7 |
| Nitrogen (anhydrous) | ~180 lb N | 106 | −6 |
| Potash (MOP) | ~55 lb K₂O | 27 | +1 |
Source: Crop Root Zone estimate/model, built on DTN retail prices (Jul 22, 2026) and standard removal-based rates. Illustrative, not an agronomic recommendation; adjust to your soil tests and yield goal.
At $4.40 corn, $64/acre of phosphate is about 14.5 bu/acre of revenue — and it is the one input line where the year-over-year arrow points up. The temptation, in a tight-margin year, is to trim the P rate to recover cash. That is where the decision has to be made carefully.
On the timing question, the fall setup is unusually one-sided for phosphate. Nitrogen buyers have a genuine reason to wait: the retail line is falling, so patience is paid. Phosphate buyers have the mirror image — a market held up by a record cost stack and a China ban that, on its stated calendar, doesn't expire until August, with any Moroccan relief arriving as vessels weeks later. Waiting out a falling market is prudence; waiting out a floored one is just carrying price risk into application season. For operations that apply P in the fall, the flat-to-firm DAP curve argues for covering the fall requirement now and treating the Morocco reopening as a 2027 planning input, not a fall discount to chase.
Ground Truth: Cutting the P rate to beat a high DAP price is a yield decision disguised as a cost decision. Nitrogen applied above crop need is largely lost to the environment within the season, so trimming excess N mostly trims waste. Phosphorus is different: on soils testing at or below optimum, skipping replacement draws down soil test P and mortgages next year's yield to save cash this year — and you rarely buy it back cheaply, because you're then re-applying into the same tight market. If your soil tests are high, this is the year to bank that credit and skip. If they're at or below optimum, the honest move is to hold the rate and cut cost somewhere the crop won't notice.
Market read: MOS — Hold — the same curtailment-plus-record-margin setup that supports the DAP floor is already reflected; the swing factor from here is the China ban's expiry and the pace of Moroccan tons, both outside the company's control.
References
- DTN/Progressive Farmer, "Fertilizer Prices Continue Downward Trend," Jul 22, 2026 (week of Jul 13-17 retail benchmarks). https://www.dtnpf.com/agriculture/web/ag/crops/article/2026/07/22/fertilizer-prices-continue-downward
- DTN/Progressive Farmer, "Six Fertilizers Lead Retail Fertilizer Prices Lower for Third Consecutive Week," Jul 8, 2026 (week of Jun 29-Jul 2 retail benchmarks). https://www.dtnpf.com/agriculture/web/ag/crops/article/2026/07/08/six-fertilizers-lead-retail-prices
- Argus Media, Q3 2026 Tampa molten sulfur contract settlement ($705/lt), Jul 13, 2026. https://www.argusmedia.com/en/commodities/sulphur-and-sulphuric-acid
- The Mosaic Company, Q1 2026 earnings call and press materials — sulfur cost, marginal sulfur, Q2 phosphate volume guidance and curtailment, stripping margin, May 11, 2026. https://s1.q4cdn.com/823038994/files/doc_financials/2026/q1/Press-Release-Q1-2026-Exhibit-99-1-1.pdf
- Trade press on China's phosphate/sulfuric-acid export suspension through August 2026 (NDRC), Mar 2026. https://www.potatopro.com/news/2026/china-restricts-fertilizer-exports-tightening-global-supply-amid-market-disruptions
- U.S. International Trade Commission, "Phosphate Fertilizers from Morocco and Russia" review materials; CIT duty reduction to 2.11%, 2026. https://www.usitc.gov/publications/701_731/pub5172.pdf
- Morocco World News / USDA-relayed, "Morocco's OCP Phosphate Ships Could Head to US 'Within Days,'" Jul 2026. https://www.moroccoworldnews.com/2026/07/330130/moroccos-ocp-phosphate-ships-could-head-to-us-within-days-usda-confirms/
- USDA, July 2026 WASDE — 2026-27 corn marketing-year average price estimate ($4.40/bu), Jul 10, 2026. https://www.usda.gov/oce/commodity/wasde
Disclosures
Crop Root Zone is an independent publication. Nothing here is investment advice. Market calls, where included, reflect the editors' own read and are not a recommendation to buy or sell any security.
The Scissors Open: Nitrogen Falls Five Straight Weeks While Sulfur Sets Records
Retail N is off 6–7% in a month; the Tampa sulfur contract just settled at a record $705/lt. Two blades of the same fertility program are cutting in opposite directions — and the wholesale tape says the nitrogen blade closes first
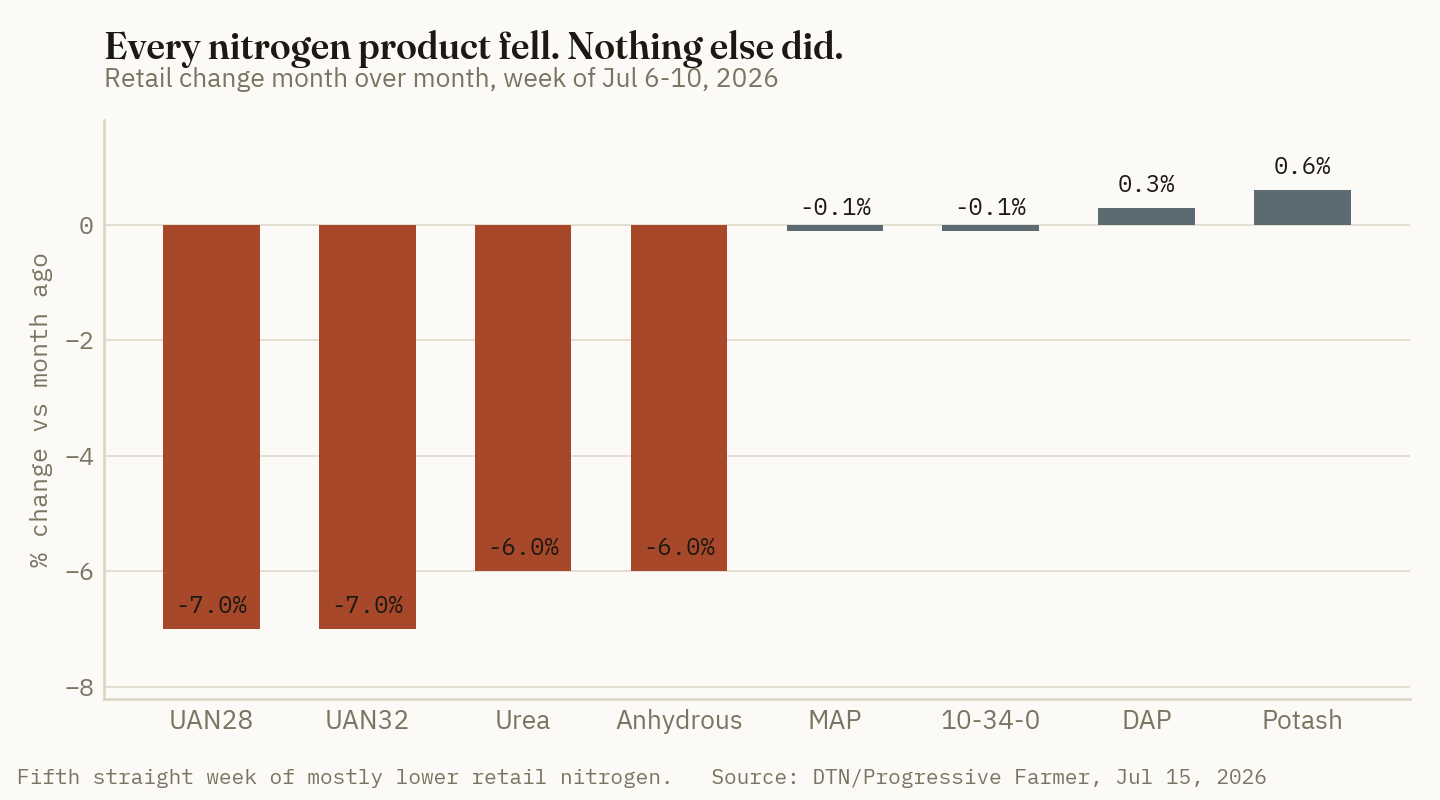
Two of the four nutrients that matter most to a Corn Belt fertility program are moving in opposite directions at the same time, and the gap is now wide enough to be a planning problem rather than a curiosity. DTN's retail survey for the week of July 6–10 put average delivered urea at $714/ton, down 6% from a month earlier; anhydrous ammonia at $1,032/ton, also down 6%; UAN28 at $493/ton and UAN32 at $529/ton, both down 7% — the fifth straight week of mostly lower retail prices (DTN/Progressive Farmer, Jul 15, 2026). Over roughly the same stretch, the Q3 2026 Tampa molten sulfur contract settled at a record $705/long tonne (lt) delivered, up 8% from Q2 (Argus Media, Jul 13, 2026), and the Chinese sulfur spot benchmark printed 9,435.67 CNY/T on July 20 — up 4.44% month-on-month and 310.66% year-on-year (Trading Economics, Jul 20, 2026). A grower buying nitrogen and a retailer holding sulfur-bearing product are, right now, living in two different markets.
1. The divergence, measured
What's new: The month-over-month direction of the two nutrient legs has fully inverted, and the magnitude of the split is now three orders of scale apart on a year-over-year basis.
Evidence: On DTN's July 6–10 survey — a retail, delivered-to-farm basis, not a wholesale print — every nitrogen product fell and every phosphate and potash product held or firmed.
| Product | $/ton | MoM | YoY | Leg |
|---|---|---|---|---|
| Anhydrous | 1,032 | −6% | +34% | Nitrogen |
| Urea | 714 | −6% | +9% | Nitrogen |
| UAN32 | 529 | −7% | +6% | Nitrogen |
| UAN28 | 493 | −7% | +18% | Nitrogen |
| MAP | 954 | −0.1% | +13% | Phosphate |
| DAP | 912 | +0.3% | +13% | Phosphate |
| 10-34-0 | 723 | −0.1% | +8% | Phosphate |
| Potash | 494 | +0.6% | +3% | Potash |
Source: DTN/Progressive Farmer, Jul 15, 2026. Retail, delivered-to-farm basis — not a wholesale print.
$705/lt
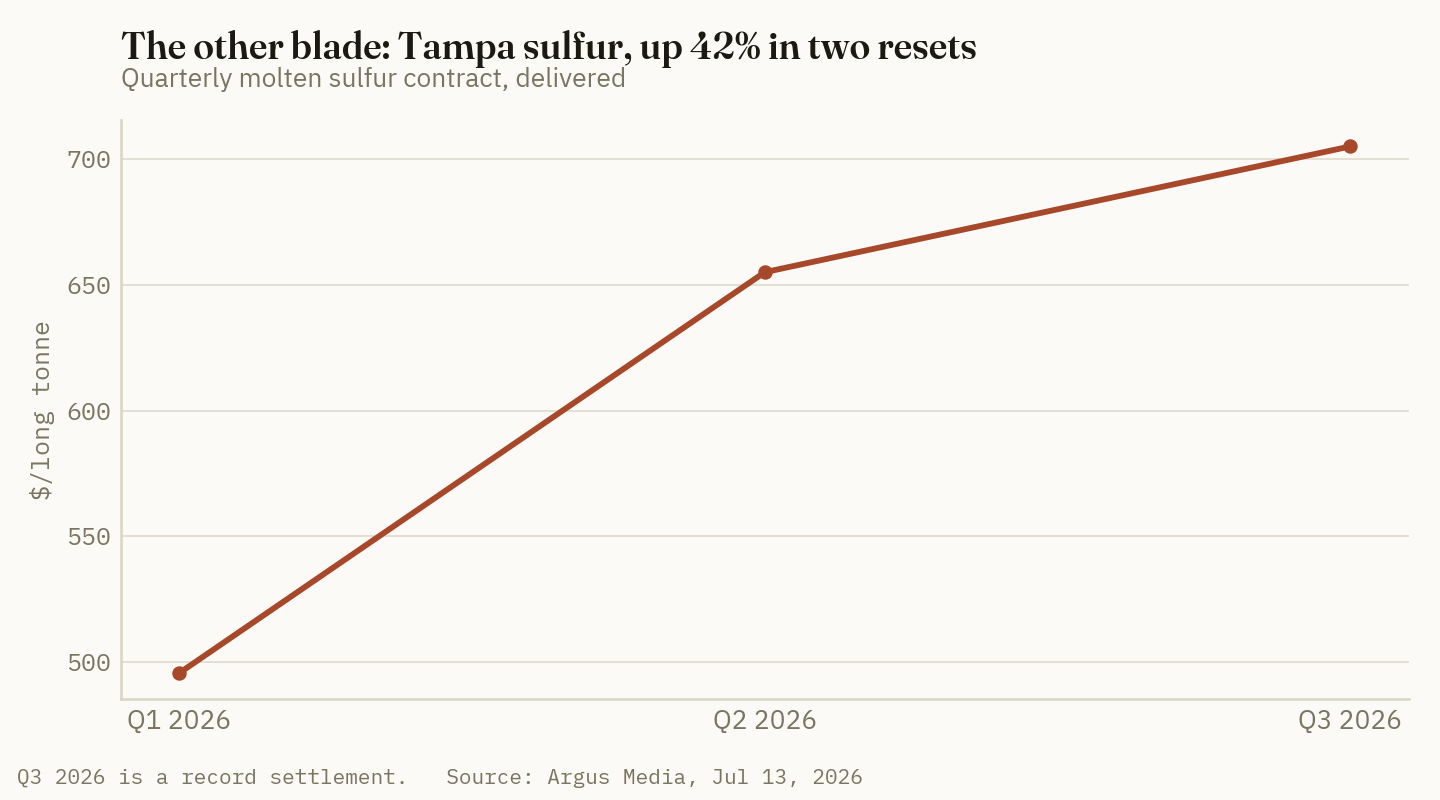
Q3 2026 Tampa molten sulfur contract — a record, up 8% from Q2 and 42% from Q1. (Argus Media, Jul 13, 2026)
The sulfur leg has no comparable retail print in the public tier, so it has to be read off wholesale benchmarks. The Tampa quarterly contract — the US reference for delivered molten sulfur — has gone $495.69/lt in Q1 2026, $655/lt in Q2, $705/lt in Q3: a 42% rise across two resets (Argus Media, Jul 13, 2026). Converted at 1 lt = 1.01605 MT, the Q3 contract is roughly $694/MT delivered; at 1 lt = 1.12 st, roughly $629/st (Crop Root Zone conversion). US Gulf refinery spot export assessments ran $1,100–1,150/t FOB as of July 9, 2026 — roughly 60% above the delivered contract, which is what a market looks like when the contract instrument lags physical scarcity rather than leading it (Argus Media, Jul 13, 2026). The Chinese spot benchmark set an all-time high of 11,084.33 CNY/T in June 2026 (Trading Economics, Jul 20, 2026).
On nitrogen unit-cost terms, DTN's own conversion puts anhydrous at $0.63/lb N, urea at $0.78/lb N, UAN32 at $0.83/lb N and UAN28 at $0.88/lb N (DTN/Progressive Farmer, Jul 15, 2026) — a 40% spread between the cheapest and dearest form of the same nutrient.
Ground Truth: The scissors are not symmetric in a grower's P&L, and treating them as equally important is the first mistake. Anhydrous falling 6% means the month-ago price was roughly $1,098/ton; at 82% N, that $66/ton decline is about $0.040/lb N, or roughly $7.20/acre on a 180 lb N/acre corn program (Crop Root Zone calculation from DTN survey data, Jul 15, 2026). Now run the sulfur side: each $100/lt on the Tampa contract is about $98/MT of elemental sulfur, which at roughly 0.24 t S per t of 21-0-0-24S works out to about $21/st of AMS — call it $1.10/acre at a 25 lb S/acre rate (Crop Root Zone model; stoichiometry and application rate are our assumptions, not sourced figures). The entire Q1-to-Q3 sulfur run — $209/lt — is worth roughly $2.30/acre of sulfur cost in a conventional S program. One month of nitrogen relief is worth three times the year's entire sulfur inflation at the acre level. Growers should not let the sulfur headline pull their attention off the nitrogen decision, which is where the real dollars sit.
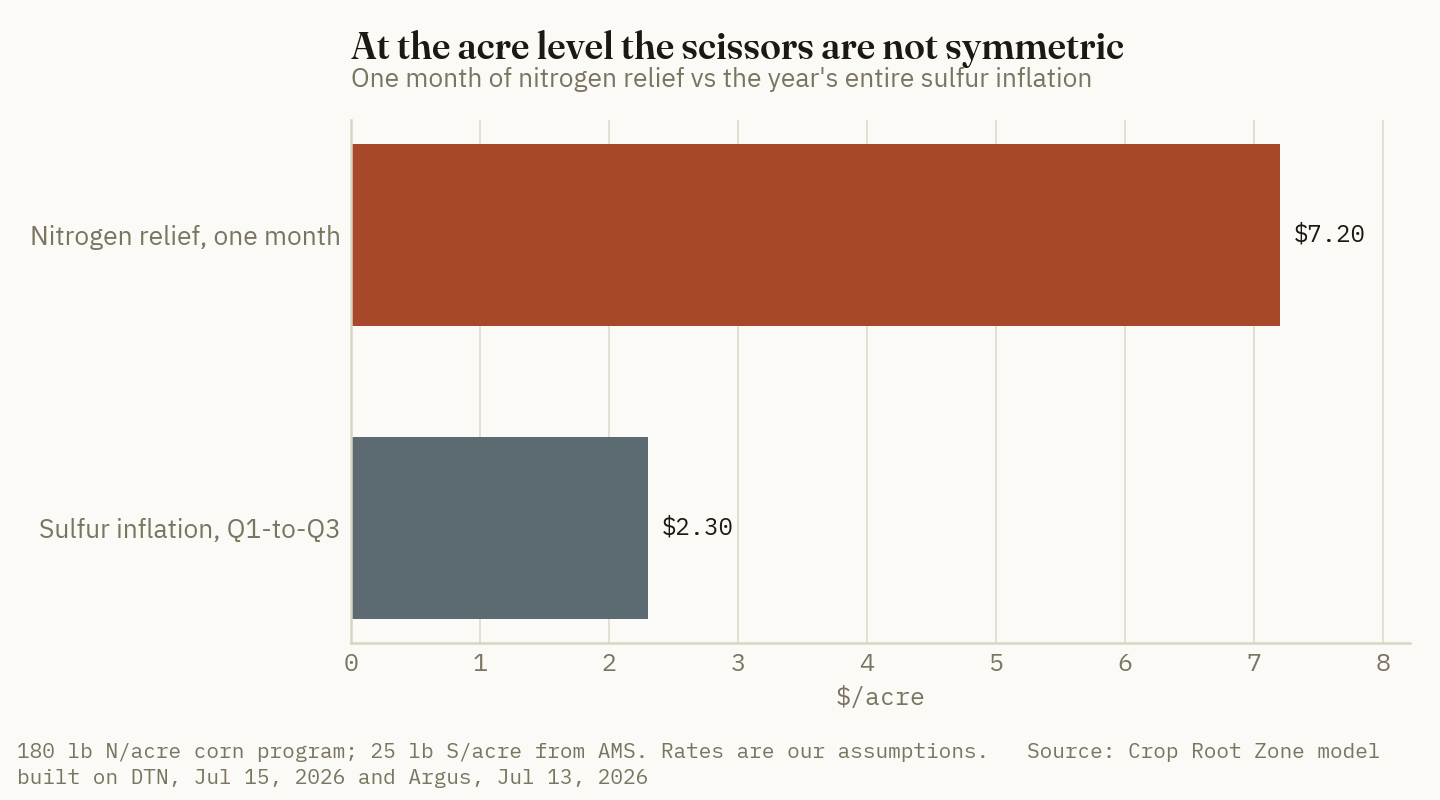
2. Why the nitrogen leg is falling
What's new: The nitrogen decline is a demand-side and calendar phenomenon sitting on top of a benign gas cost — not evidence of a resolved supply picture.
Evidence: Ammonia economics are gas economics. CF Industries puts natural gas at more than 70% of the variable cost to produce ammonia for many global producers, against a world market of roughly 200 million tons of ammonia produced and consumed annually (CF Industries, Mar 27, 2026). EIA's outlook has Henry Hub averaging close to $3.60/MMBtu across 2026 and 2027 (US EIA, Short-Term Energy Outlook, 2026) — a level that keeps the US cost curve comfortable and gives domestic producers no reason to ration tons.
The demand side is straightforward: sidedress is done. The July survey window sits in the post-application trough between the spring program and fall ammonia — the seasonal low-liquidity stretch of the North American retail year. Five consecutive weeks of mostly lower prints (DTN/Progressive Farmer, Jul 15, 2026) is what that trough normally looks like.
What it is not is a return to pre-conflict normal. Anhydrous is still up 34% year-over-year and UAN28 up 18%. The University of Illinois farmdoc team, writing in March, had Illinois retail anhydrous approaching $1,000/ton against a 2012-to-date average of $737/ton, urea up 42% to $823/ton and 32% UAN up 31% to $570/ton, with a fall 2026 anhydrous forecast of $860/ton built on $3.50/MMBtu gas and $4.50/bu corn (farmdoc daily, Mar 24, 2026). Today's $1,032/ton anhydrous is well above that fall forecast even after a five-week slide. The Middle East supply exposure that drove the spring spike has not gone away — the region accounts for roughly 30% of globally traded ammonia and 35% of globally traded urea (CF Industries, Mar 27, 2026).
Crucially, the wholesale tape has already turned. Market reporting in late June had barges delivering to NOLA in July trading at roughly $443–450/st FOB, about $30/st above the June 20 level; Trading Economics' urea benchmark printed $424/T on July 16, up 1.56% on the day (market reporting relayed through public price trackers, late Jun–Jul 16, 2026 — see reference 8 for the sourcing caveat). Retail urea at $714/ton delivered sits roughly $265/st above that barge level. We do not have a current, public time series of the normal retail-to-barge urea spread to benchmark that gap against, so we will not claim it is historically wide — only that the two ends of the chain are now pointing opposite ways.
Ground Truth: The retail nitrogen decline is running on stale wholesale information. DTN's survey reflects offers being made to farms, which are priced off inventory that retailers bought weeks earlier; the barge market that will price next month's retail replacement cost bottomed in June and has been climbing since. The five-week streak is therefore a lagging indicator, not a trend with runway. Our read: the retail nitrogen decline has one to three more weeks of visible life at most, and buyers waiting for a sixth, seventh and eighth down-week before committing fall tons are optimizing against a number that has already stopped being true upstream.
Market read: CF — Hold — cheap Henry Hub gas protects CF's cost side while falling US retail realizations compress the top line, and a firming NOLA barge is the earliest signal that the realization pressure reverses; we would want to see one full quarter of the post-trough tape before adding.
3. Why the sulfur leg keeps climbing
What's new: Sulfur's move is a genuine supply dislocation stacked with policy restrictions, hitting a commodity that structurally cannot respond to price with new supply.
Evidence: Sulfur is almost entirely a byproduct of petroleum refining and sour-gas processing. Nobody builds a sulfur mine because sulfur is expensive; output is set by how much crude and gas gets processed and how sour it is. That is why the price response has been so violent.
Roughly half of global sulfur supply originates in the region constrained by the Strait of Hormuz (Trading Economics, Jul 20, 2026). Vessel-tracking analysis put global sulphur exports 45% below end-February levels following the February 28, 2026 Hormuz closure, with over 600,000 tonnes of stranded inventory queued in the Middle East Gulf by April 2026, and identified Morocco's OCP taking its last Middle East Gulf cargo on April 10, 2026 (Kpler, Jun 4, 2026).
Policy amplified rather than cushioned it. China announced a full export ban on sulphuric acid on April 10, 2026, running through August — replacing a 700,000-tonne annual quota with a complete cessation (Kpler, Jun 4, 2026). Chinese sulphuric acid exports were 4.6 million tonnes in 2025; industry reporting projects roughly 1.2 million tonnes in 2026 as Beijing prioritizes domestic fertilizer supply. Russia extended its sulfur export ban into June 2026 and Turkey has moved to restrict exports in Q2 and Q3 (industry trade reporting, 2026 — see reference 9).
Then the demand side, which fertilizer buyers systematically under-weight: sulfur does not only go into fertilizer. Sulphuric acid is the working reagent in copper, nickel and uranium hydrometallurgy, and those buyers are not price sensitive the way a phosphate plant is. Indonesian HPAL nickel producer Huayou reduced output by roughly 50% on feedstock cost, with sulphur feedstock exceeding 50% of HPAL production cost at current pricing (Kpler, Jun 4, 2026). US supply offers no offset: USGS estimated total US sulfur production in 2025 at 3% below 2024, with elemental sulfur recovered from refineries and gas operations down 3% (USGS, Mineral Commodity Summaries 2026, Feb 2026).
Ground Truth: The nitrogen and sulfur legs will not re-converge on the same clock, and the reason is capital physics, not sentiment. Nitrogen has a supply-response mechanism — high prices justify new ammonia capacity, and cheap US gas makes that capacity economic; the market self-corrects on a two-to-three-year build cycle and on a two-to-three-month operating-rate cycle. Sulfur has neither. Its supply is set by refinery throughput and crude sourness, and its price cannot summon a single incremental tonne. That means the right planning assumption is asymmetric: treat nitrogen weakness as cyclical and reversible, and treat sulfur strength as a new floor until refinery run-rates or the Hormuz constraint physically change. Anyone modeling both as "commodity volatility that mean-reverts" will be wrong on one of the two.
4. Who this favors, who it hurts, and where the lag sits
What's new: The scissors redistribute margin down the chain in a specific, predictable order — and the party most exposed is the one holding sulfur-bearing inventory bought at contract-lagged cost into a softening affordability picture.
Evidence: Start with the grower. A corn grower buying fall nitrogen is the clearest beneficiary: roughly $7.20/acre of relief in one month at 180 lb N/acre on the anhydrous move (Crop Root Zone calculation from DTN survey data, Jul 15, 2026), against roughly $2.30/acre of cumulative 2026 sulfur inflation in an AMS-based S program (Crop Root Zone model). Net-net the scissors are grower-positive at the acre level — but only modestly, and only against a soft revenue line: December 2026 corn futures have been trading in the mid-$4.40s to high-$4.50s per bushel in July (CBOT quotes relayed via public trackers, July 2026), essentially in line with the $4.50/bu assumption farmdoc used in March.
The retailer is the exposed party. Retail margin on nitrogen compresses in a falling market because the inventory was bought higher than the offer that clears it — five straight down weeks is five weeks of inventory writedown risk on the N side of the shed. Meanwhile the S-bearing side is the opposite problem: the cost is rising but the ability to pass it through is capped by phosphate affordability. Argus flagged weakening phosphate demand on affordability grounds in the same July 13 note that reported the record Tampa settlement (Argus Media, Jul 13, 2026) — DAP at $912/ton retail delivered and MAP at $954/ton, both up 13% year-over-year (DTN/Progressive Farmer, Jul 15, 2026), are already at levels growers are resisting.
Producers of sulfur-bearing products are caught in the middle. US ammonium sulfate has been described as steady-to-firm at roughly $383/MT in June 2026 on consistent agricultural buying, stable blender demand and tight domestic supply (ChemAnalyst/IMARC, June 2026) — a product price that has essentially not moved while its sulfur input reset 42% in two quarters. Phosphate producers have already made the operational decision: Mosaic cut domestic production by approximately 2 million tonnes on the feedstock squeeze (Kpler, Jun 4, 2026). North American sulfuric acid was assessed at roughly $116.51/MT in March 2026 (ChemAnalyst, Mar 2026) — a level that predates the Chinese export ban and should not be read as current.
One note on basis honesty: Green Markets publishes a US Gulf NOLA ammonium sulfate barge range of $375–390/st FOB, but the publicly visible quote at that level dates to January 2025, and current 2026 assessments are subscriber-only. There is no current public NOLA ammonium sulfate barge print. Anyone quoting one at you in July 2026 is quoting a subscription assessment or a guess.
Ground Truth: The pass-through lag is the whole trade, and it runs in opposite directions on the two legs. Nitrogen's lag is short and retail-side — barge to farmgate in roughly four to eight weeks — so the June barge bottom is already the July retail print, and the late-June barge rally becomes the August–September retail print. Sulfur's lag is long and contract-side: the Tampa instrument resets quarterly and settles forward, so the $705/lt Q3 record is a cost that has not yet fully entered fall-fill offer sheets for AMS, ATS, or sulfur-bearing blends. Practical consequence for a fall 2026 buying program: the sequencing is the decision, not the timing. Book sulfur-bearing product now, before the Q3 contract cost migrates into Q4 fill sheets; take nitrogen in tranches over the next two to three weeks rather than waiting for a bottom that the barge market has already called.
Market read: MOS — Trim — Mosaic is long exactly the wrong side of both blades: a sulfur-and-ammonia cost stack setting records into a phosphate market that Argus is already describing as demand-constrained on affordability, with roughly 2 million tonnes of production already curtailed; potash strength partially offsets, but the phosphate segment has to clear a full quarter of the Q3 sulfur contract before the cost picture is knowable.
5. What to watch
What's new: Four datapoints will resolve whether the scissors close, widen, or invert before fall application.
Evidence and the watchlist:
NOLA urea barge, weekly. The leading indicator for the nitrogen blade, and it has already turned. If July–August barges hold above the roughly $443–450/st FOB late-June range, the retail decline ends in August. If barges roll back under $420/st, the slide extends into fall fill.
The Q4 2026 Tampa sulfur contract settlement, due around end-September. The spot-to-contract gap at $1,100–1,150/t FOB Gulf (Argus Media, Jul 9, 2026 assessment) argues the contract still has room above it. Trading Economics' model has the Chinese benchmark at 9,458.93 CNY/T at quarter-end and 10,370.73 CNY/T in twelve months (Trading Economics, Jul 20, 2026) — a model output, not a market forecast, and to be treated as such.
The Chinese sulphuric acid ban expiry, nominally August 2026. A clean expiry releases pressure on Chilean copper and Indonesian nickel acid demand and takes heat out of the sulfur complex. An extension is the worst single outcome for a fall sulfur buyer.
Henry Hub through the fall. At roughly $3.60/MMBtu (US EIA, 2026) the US ammonia cost curve stays benign. A cold-weather gas spike is the one mechanism that closes the scissors by lifting the nitrogen blade rather than lowering the sulfur one — and it is the scenario in which the fall buyer who waited loses on both legs simultaneously.
References
- DTN/Progressive Farmer, "UAN Fertilizers Lead Nutrient Prices Downward" — retail fertilizer survey, week of Jul 6–10, 2026; published Jul 15, 2026, https://www.dtnpf.com/agriculture/web/ag/crops/article/2026/07/15/uan-fertilizers-lead-nutrient-prices
- Argus Media, "Tampa 3Q liquid sulphur price hits record $705/lt" — Jul 13, 2026 (includes the Jul 9, 2026 US Gulf refinery spot export assessment of $1,100–1,150/t FOB and commentary on weakening phosphate demand), https://www.argusmedia.com/en/news-and-insights/latest-market-news/2851577-tampa-3q-liquid-sulphur-price-hits-record-705-lt
- Trading Economics, Sulfur (China spot benchmark) — 9,435.67 CNY/T, Jul 20, 2026, https://tradingeconomics.com/commodity/sulfur
- Kpler, "Sulphur & sulphuric acid in 2026: the feedstock crisis cascading through copper, nickel & fertilisers" — Jun 4, 2026, https://www.kpler.com/blog/sulphur-sulphuric-acid-in-2026-the-feedstock-crisis-cascading-through-copper-nickel-fertilisers
- CF Industries, "Key Questions About Fertilizer and Its Price Answered" — Mar 27, 2026, https://www.cfindustries.com/newsroom/2026/2026-fertilizer-prices-faq
- Paulson, Schnitkey, Monaco and Zulauf, "Nitrogen Prices Remain in Focus After Iran Conflict," farmdoc daily, University of Illinois — Mar 24, 2026, https://farmdocdaily.illinois.edu/2026/03/nitrogen-prices-remain-in-focus-after-iran-conflict.html
- US Geological Survey, Mineral Commodity Summaries 2026 — Sulfur — Feb 2026, https://pubs.usgs.gov/periodicals/mcs2026/mcs2026-sulfur.pdf
- NOLA urea barge indications ($443–450/st FOB for July delivery, late June 2026, roughly $30/st above Jun 20) and Trading Economics urea benchmark ($424/T, Jul 16, 2026) — relayed through public price trackers; the underlying barge assessment is a subscription product and the precise primary print was not independently verified. Treated here as a directional reference, not a settled assessment. https://tradingeconomics.com/commodity/urea
- Industry trade reporting on Chinese sulphuric acid export volumes (4.6 Mt in 2025, projected ~1.2 Mt in 2026) and Russian/Turkish sulfur export restrictions, 2026 — multiple secondary trade sources; primary regulatory notices not independently verified.
- US Energy Information Administration, Short-Term Energy Outlook — Natural Gas (Henry Hub averaging near $3.60/MMBtu across 2026–2027), 2026, https://www.eia.gov/outlooks/steo/report/natgas.php
- ChemAnalyst and IMARC Group, US ammonium sulfate pricing (~$383/MT, June 2026) and North American sulfuric acid (~$116.51/MT, March 2026), https://www.chemanalyst.com/Pricing-data/ammonium-sulphate-64
- Green Markets, US Gulf NOLA ammonium sulfate barge range $375–390/st FOB — publicly visible quote dated January 2025; current 2026 assessments are subscriber-only. No current public NOLA AMS barge print exists as of this writing, https://fertilizerpricing.com/priceindex/
- CBOT December 2026 corn futures quotes, mid-$4.40s to high-$4.50s per bushel, July 2026 — relayed via public futures quote services (CME Group, Barchart), https://www.cmegroup.com/markets/agriculture/grains/corn/quotes
Unit conversions ($/lt to $/MT and $/st, lb N per ton of product, lb S per acre from 21-0-0-24S) and the per-acre cost calculations are Crop Root Zone model work built on the cited price inputs, and are labeled as such in the text. They are not producer-disclosed or agency-published figures.
Disclosures
Crop Root Zone is an independent publication. Nothing here is investment advice. Market calls, where included, reflect the editors' own read and are not a recommendation to buy or sell any security.
Sorghum's Low-Input Case Is Real — but It's a Dryland Case, Not a Corn Belt One
Grain sorghum needs roughly the same nitrogen per bushel as corn, so the savings come entirely from a lower yield goal and a lower total input bill — which is why the crop pencils on water-limited acres and nowhere else, even with China back at the table
Every time nitrogen gets expensive, grain sorghum gets a fresh round of press as the crop that lets a grower spend less on fertilizer, and 2026 has been no exception. The story has an intuitive appeal and a real core, but it is routinely told wrong. Sorghum is not a low-nitrogen crop in the way the pitch implies — it requires roughly 1.1 lb of nitrogen per bushel of grain, essentially the same as corn on a per-bushel basis (Sorghum Checkoff; No-Till Farmer) [1]. The entire nitrogen saving comes from somewhere else: sorghum belongs on water-limited ground where the realistic yield goal is lower, and a lower yield goal means fewer bushels to feed and a smaller absolute nitrogen bill. That distinction is not pedantic. It is the whole reason the sorghum case is a dryland case and collapses the moment you try to make it a Corn Belt one — and it explains why US growers intend to plant fewer sorghum acres in 2026 even as the low-input argument gets louder.
1. Same nitrogen per bushel — the savings are in the yield goal
What's new: The agronomy has not changed, but the price of getting it wrong has. On a per-bushel basis, grain sorghum and corn are near-twins in nutrient demand: sorghum removes and requires on the order of 1.1 lb N/bu, similar to corn (Sorghum Checkoff) [1]. A grower who plants sorghum expecting a categorically smaller nitrogen rate per bushel is mispricing the crop.
Evidence: Where the two diverge is the realistic yield goal. Sorghum earns its place on dryland and water-limited acres, where it tolerates water stress better than corn — which is precisely why the sensible yield goal there is lower, and the absolute nitrogen rate falls with it. Work the math on a western-Plains dryland setting, as a Crop Root Zone calculation on stated assumptions: nitrogen credited at anhydrous ammonia's implied $0.59/lb N (DTN anhydrous $967/ton ÷ 1,640 lb N/ton, week of Jul 13–17) [2]; 1.1 lb N/bu gross requirement.
| Crop (dryland) | Yield goal | N at ~1.1 lb/bu | N cost @ $0.59/lb | vs corn |
|---|---|---|---|---|
| Grain sorghum | 80 bu | ~88 lb | ~$52/acre | — |
| Dryland corn | 130 bu | ~143 lb | ~$84/acre | +$32 |
| Irrigated corn | 210 bu | ~231 lb | ~$136/acre | +$84 |
Source: Crop Root Zone calculation; nitrogen basis DTN/Progressive Farmer anhydrous, week of Jul 13–17, 2026 [2]; per-bushel N from Sorghum Checkoff [1]. Yield goals illustrative for a water-limited western-Plains setting; actual rates should follow local soil-test and yield-goal guidance.
The nitrogen saving on dryland sorghum versus dryland corn in this frame is about $32/acre — real money, but it is a yield-goal saving, not a magic property of the seed. Against irrigated corn the gap looks huge, but that comparison is a category error: nobody irrigates to grow sorghum where corn will run 210 bu.
Ground Truth: The correct way to say it is that sorghum lets you match the crop to the water, and the lower nitrogen bill is a consequence of accepting a lower yield goal — not a reason to plant sorghum on ground that would grow good corn. On a genuinely water-limited acre, that is a feature: you were never going to get corn's bushels there, so you buy sorghum's smaller nitrogen bill and its drought tolerance and come out ahead. On decent ground, the same logic runs backwards — you are giving up corn's bushels to save nitrogen you would happily have spent. The nitrogen math only pencils where the water math already did.
2. The whole input stack, not just the nitrogen line
What's new: Nitrogen is the line the pitch leads with, but the sorghum case only closes when you total the full operating budget, because sorghum saves on more than N — seed, especially — while giving up bushels and price.
Evidence: A 2026 dryland grain sorghum budget for southwest Nebraska (ecofallow after wheat) put total operating costs at $298.98/acre with fertilizer at $109.10/acre (University of Nebraska–Lincoln, 2026 Crop Budgets) [3]. Sorghum's seed cost is a fraction of corn's — no expensive triple-stack hybrid tax — and its total operating cost sits well below a comparable dryland corn budget. That lower cost base is the real economic engine of the crop, and it is a bigger, more reliable lever than the nitrogen line alone.
| Line item | Dryland sorghum (SW NE, ecofallow) | Notes |
|---|---|---|
| Total operating cost | $298.98/acre | UNL 2026 budget [3] |
| — of which fertilizer | $109.10/acre | [3] |
| Fertilizer share of operating | ~36% | Crop Root Zone calc on [3] |
Source: University of Nebraska–Lincoln 2026 Crop Budgets, dryland grain sorghum, southwest Nebraska ecofallow after wheat [3].
Here is the input stack as a share of the operating budget, so the nitrogen line is seen in proportion:
| Cost bucket | ~$/acre | |
|---|---|---|
| Fertilizer (all nutrients) | 109 | ██████ |
| Seed, chemicals, fuel, repairs, other | ~190 | ██████████ |
Source: Crop Root Zone split of the UNL 2026 dryland sorghum budget [3]; the second bar is total operating cost minus fertilizer.
Ground Truth: Fertilizer is roughly a third of a dryland sorghum operating budget, which means even a dramatic nitrogen saving moves the total cost of production by single-digit percentages. The crop's durable economic advantage is the whole lower cost base — cheap seed, modest chemical program, low water requirement — not the nitrogen headline. A grower choosing sorghum purely to dodge a high nitrogen bill is optimizing the wrong line; the right question is whether the entire low-cost, low-yield, drought-tolerant package beats the alternative on that specific acre. Usually the answer is only yes when the acre is genuinely water-short.
3. The price discount is structural, and it caps the upside
What's new: Sorghum's cost advantage runs straight into its revenue disadvantage. The crop trades at a persistent discount to corn, and in 2026 that discount is doing real work against the low-input story.
Evidence: Grain sorghum prices have historically averaged roughly 87% of corn prices (Crop Quest; extension budgets) [4], and the 2026 season-average farm price is expected to run between $3.50 and $3.70/bu (USDA outlook coverage, 2026) [5]. Oklahoma State's water-capacity analysis makes the trade-off explicit: in a limited-water situation, grain sorghum does not out-earn corn on a per-acre basis until sorghum yields can be expected to run 10–15% higher than corn yields (Oklahoma State University Extension) [6]. That is the bar the crop has to clear, and on good ground it cannot.
| Metric | Sorghum | Corn | Read |
|---|---|---|---|
| Typical price ratio | ~87% of corn | 100% | structural discount [4] |
| 2026 season-avg farm price | $3.50–3.70/bu | higher | [5] |
| Per-acre break-even vs corn (limited water) | needs +10–15% yield | — | OkState [6] |
Source: Crop Quest / extension budgets [4]; USDA outlook coverage, 2026 [5]; Oklahoma State University Extension [6].
Ground Truth: The 87% price ratio is the ceiling on the whole low-input argument. Sorghum saves you money per acre on inputs and charges you back through a discounted bushel and, usually, fewer bushels. Net those against each other honestly and the crop wins on the specific acres where corn's yield was never going to show up — water-limited dryland — and loses almost everywhere else. This is why the low-input pitch is dangerous when it travels: it is true on a Kansas dryland section and false on an irrigated Nebraska pivot corner, and the pitch never says which one it is talking about.
4. China came back, and acres still fell — the tell
What's new: The one thing that could have overridden the structural math in 2026 was a demand shock, and China delivered a partial one. It was not enough to lift acres, and the reason it wasn't is the most instructive fact in the sorghum market this year.
Evidence: China cut its additional tariff on US sorghum to 10% effective November 10, 2025, and purchases resumed — private exporters reported sorghum sales of 12.0 million bushels and a further 5.0 million bushels in mid-July 2026, and US sorghum prices rallied on China's return (USDA Foreign Agricultural Service, 2026) [7][8]. And yet US growers intend to plant just 6.12 million acres of sorghum in 2026, 8% below 2025, with the two largest producing states leading the cut — Kansas down about 10% and Texas down about 21% (USDA NASS Acreage, Jun 30, 2026) [9]. Demand improved and acres fell.
6.12 million acres
US intended 2026 sorghum plantings — down 8% year-over-year, even as China returned to the market. (USDA NASS Acreage, Jun 30, 2026 [9])
The resolution of the paradox: the trade hiatus since spring 2025 had let old-crop sorghum stocks balloon, so China's return in 2026 first had to work through a supply overhang before it could pull new acres, and analysts flagged that if old-crop export sales did not accelerate, ending stocks would rise further and basis would widen (market outlook coverage, 2026) [5]. The demand signal was real but shallow, and growers — reading the same stocks — voted with their planters.
| Sorghum signal, 2026 | Direction | |
|---|---|---|
| China tariff cut to 10%, buying resumed | bullish | ████████ |
| July export sales (12M + 5M bu) | bullish | ██████ |
| Old-crop stock overhang | bearish | █████████ |
| 2026 intended acres −8% | bearish | ████████ |
Source: Crop Root Zone synthesis of USDA FAS [7][8], USDA NASS [9], and 2026 market outlook coverage [5]; bar lengths are the editors' judgment of relative weight.
Ground Truth: The acreage cut in the face of returning Chinese demand is the market telling you that the sorghum trade is a basis-and-stocks story before it is an input-cost story. A grower on water-limited ground who can grow sorghum cheaply still has to sell it, and the sell side runs through one dominant, politically volatile buyer and a domestic stock overhang that widens basis when that buyer hesitates. The low-input case gets you a cheaper crop to produce; it does nothing for the price you receive. Plant sorghum in 2026 because the acre is too dry for corn and the whole cost structure fits — not because nitrogen is expensive and not because China placed a headline order. If the water math and the local basis both work, the nitrogen saving is a genuine bonus. If they don't, no amount of cheap nitrogen rescues a discounted bushel into a widening basis.
References
- Sorghum Checkoff, "Fertilizing Grain Sorghum," and No-Till Farmer, "What You Need to Know About Sorghum Nutrient Requirements" — accessed Jul 2026, https://www.sorghumcheckoff.com/agronomy-insights/fertilizing-grain-sorghum/
- DTN/Progressive Farmer, retail fertilizer survey (anhydrous ammonia $967/ton), week of Jul 13–17, 2026, published Jul 22, 2026, https://www.dtnpf.com/agriculture/web/ag/crops/article/2026/07/22/fertilizer-prices-continue-downward
- University of Nebraska–Lincoln, Department of Agricultural Economics, 2026 Nebraska Crop Budgets — dryland grain sorghum, southwest, ecofallow after wheat — 2026, https://agecon.unl.edu/2026-nebraska-crop-budgets-summary-and-key-insights/
- Crop Quest, "Corn Vs. Grain Sorghum In Water Limited Scenarios," and extension budget compilations (sorghum ~87% of corn price) — accessed Jul 2026, https://www.cropquest.com/corn-vs-grain-sorghum/
- USDA and market outlook coverage of the 2026 sorghum balance sheet and season-average farm price ($3.50–3.70/bu) — 2026, https://ers.usda.gov/sites/default/files/_laserfiche/outlooks/114043/FDS-26D.pdf
- Oklahoma State University Extension, "Economic Viability of Grain Sorghum and Corn as a Function of Irrigation Capacity" — accessed Jul 2026, https://extension.okstate.edu/fact-sheets/economic-viability-of-grain-sorghum-and-corn-as-a-function-of-irrigation-capacity
- USDA Foreign Agricultural Service, "China: SCTC Announces Retaliatory Tariffs on US Agricultural Products" and tariff-schedule updates (US sorghum additional tariff reduced to 10% effective Nov 10, 2025) — 2025–2026, https://www.fas.usda.gov/data/china-sctc-announces-retaliatory-tariffs-us-agricultural-products
- USDA Foreign Agricultural Service, "U.S. Sorghum Prices Rally with China's Return to the Market" — 2026, https://www.fas.usda.gov/data/us-sorghum-prices-rally-china-s-return-market
- USDA National Agricultural Statistics Service, Acreage report (2026 intended sorghum plantings 6.12M acres, −8% YoY) — Jun 30, 2026, https://www.nass.usda.gov/Publications/Todays_Reports/reports/acrg0626.pdf
Disclosures
Crop Root Zone is an independent publication. Nothing here is investment advice. Market calls, where included, reflect the editors' own read and are not a recommendation to buy or sell any security.
$4.40 Corn, $11.40 Beans, and a Fertilizer Bill That Finally Fell: The July WASDE Margin Math
The July WASDE held corn's season-average price at $4.40 and beans at $11.40 — the highest soybean number since 2023/24 — just as retail nitrogen rolled over for a sixth week. Corn moves from a loss toward breakeven; beans pencil the better acre.
The July World Agricultural Supply and Demand Estimates left the two numbers that set the 2026/27 crop budget essentially where they were: the season-average farm price is $4.40 per bushel for corn and $11.40 for soybeans (USDA WASDE, Jul 2026). The bean figure is the quiet headline — it is the highest projected soybean price since the 2023/24 marketing year, and a full dollar above the $10.40 carried for 2025/26. It lands in the same three weeks that retail nitrogen fell for a sixth consecutive week, pulling the single largest line in the corn budget lower. Put the price side and the cost side together and the 2026/27 margin picture is not the one the spring budgets drew.
1. What the July WASDE actually changed
What's new: The July report is a "hold" on price with a record crop underneath it — corn production at 16.0 billion bushels — and a small tightening in corn ending stocks that kept the price from falling.
Evidence: The 2026/27 balance sheet, as of July:
| Metric | Corn | Soybeans |
|---|---|---|
| Season-avg farm price | $4.40/bu | $11.40/bu |
| Prior-year (2025/26) price | — | $10.40/bu |
| National yield | 183 bu/acre | 53 bu/acre |
| Production | 16.0 bil bu | 4.475 bil bu |
| Ending stocks | 1.8 bil bu | 310 mil bu |
Source: USDA WASDE, July 2026 (2026/27 marketing year).
The mechanics matter for what comes next. Corn ending stocks were cut 170 million bushels to 1.8 billion as use rose and supply eased — the reason a record 16.0-billion-bushel crop did not push the price below $4.40. Soybean ending stocks held at 310 million, and the price held at a level the market has not seen in three seasons. The report was read as constructive: it forecast the highest soybean price since 2023/24 and gave corn futures a lift.
$11.40/bu
The 2026/27 season-average soybean farm price in the July WASDE — a dollar above last year and the highest since the 2023/24 crop. (USDA WASDE, Jul 2026)
Two cautions belong on these figures. A season-average farm price is a national marketing-year average, not the cash bid at any one elevator on any one day — local basis, which is under pressure this fall (more on that below), moves the number a grower actually captures. And a July yield is a model estimate ahead of the crop; 183 bu/acre on corn and 53 on soybeans are forecasts that August and the fall will revise.
Ground Truth: The July WASDE's real message is not the price, which barely moved — it is that a record corn crop did not break $4.40. That tells you the demand side is doing the work of holding the floor, which is a more durable kind of support than a weather scare. But a floor held by demand at $4.40 is still a floor below most growers' all-cost breakeven. The report is constructive on beans and merely stabilizing on corn, and the acre allocation for 2027 should read it exactly that way.
2. The corn acre: from a loss toward breakeven
What's new: The spring crop budgets were built on a lower corn price and a higher nitrogen bill. Both inputs moved favorably since, and together they close most of the projected loss on a central-Corn-Belt corn acre.
Evidence: University of Illinois farmdoc's 2026 budgets, published last August, used a $4.15 corn price and projected farmer returns from −$72 per acre in northern Illinois to −$111 in southern Illinois, with all-cost breakeven prices around $4.71 per bushel on high-productivity central Illinois ground (farmdoc daily, Aug 2025). Two things have changed since those budgets were struck:
| Change since spring budget | Per-acre effect (illustrative*) |
|---|---|
| Corn price $4.15 → $4.40 (July WASDE) | +$57/acre |
| Retail nitrogen down ~11% MoM (anhydrous) | +$12 to +$18/acre |
| Combined swing | ≈ +$70/acre |
*Illustrative: price effect = $0.25 × ~226 bu/acre central-Illinois yield; nitrogen effect estimated on a ~200 lb-N corn program at DTN's July retail decline. Base returns and breakeven from farmdoc; WASDE price and DTN nitrogen prints are sourced. Sources: USDA WASDE Jul 2026; farmdoc daily Aug 2025; DTN/Progressive Farmer Jul 22, 2026.
The price move alone — $0.25 per bushel on a ~226-bushel central-Illinois yield — is worth about $57 per acre. The nitrogen relief adds roughly $12–18 on a typical 200-pound-N program as anhydrous fell 11% in a month and the other N products followed (DTN/Progressive Farmer, Jul 22, 2026). Stack the two and a corn acre farmdoc pegged at roughly −$70 in the spring is now close to breakeven — not comfortably profitable, but no longer the clear loss the budgets projected.
That is the good news and its limit in one sentence: the improvement is real and it is not enough to make corn a confidently profitable acre at these prices. All-cost breakeven near $4.71 still sits above the $4.40 WASDE price. The gap has narrowed from about $0.56 to roughly $0.31 per bushel; it has not closed.
Ground Truth: The corn acre got a $70 raise and is still underwater on a full-cost basis. That is the central fact of the 2026/27 budget: relief arrived, and it was partial. The operations that clear the bar this year are the ones with a yield or a cost structure — owned ground, lower cash rent, top-quartile productivity — that pulls their individual breakeven under $4.40. For everyone renting at market and yielding at the county average, $4.40 corn plus cheaper nitrogen is a smaller loss, not a profit.
3. The bean acre pencils cleaner — and that decides 2027
What's new: Soybeans at $11.40 improve more, in margin terms, than corn does at $4.40, because the bean price rose a full dollar year over year while the bean cost structure carries far less nitrogen exposure.
Evidence: Soybeans fix most of their own nitrogen, so the sixth straight week of falling retail N — the change helping corn — barely touches the bean budget. What moves the bean acre is the price, and the price moved a lot: $11.40 versus $10.40 the prior year, the best figure since 2023/24 (USDA WASDE, Jul 2026). On a central-Illinois bean yield near 70–75 bushels, the extra dollar is worth $70–75 per acre of revenue against an almost unchanged cost base.
The relative comparison is what drives the rotation decision, and it favors beans:
| Acre (central IL, illustrative*) | Revenue driver | Cost pressure | Relative read |
|---|---|---|---|
| Corn | $4.40 × ~226 bu | High N; breakeven ~$4.71 | Loss narrowing toward breakeven |
| Soybeans | $11.40 × ~72 bu | Low N; smaller input bill | Modest positive margin |
*Illustrative per-acre framing. Corn breakeven and returns from farmdoc daily, Aug 2025; prices from USDA WASDE, Jul 2026; yields are representative central-Illinois figures, not farm-specific.
None of this is a new observation to a grower who has watched the corn-to-soybean price ratio, but the July WASDE sharpened it. When corn is below its all-cost breakeven and beans are at a three-year high, the rotation math does not require a spreadsheet — it requires acres. The market has been signaling a shift toward soybeans for the 2027 crop, and this report added a dollar of bean price to that signal without adding anything comparable to corn.
Ground Truth: The 2027 acreage fight was already leaning to soybeans, and the July WASDE just moved another increment of it. That has a fertilizer consequence most crop-side analysis skips: a corn acre that rotates to soybeans takes roughly 150–200 pounds of nitrogen off the field's demand and adds almost none back. If the acreage lean is real, the fertilizer read-through is a softer 2027 nitrogen call — which is the same conclusion the falling-N tape is drawing from the cost side, arriving from the crop side.
4. The basis trap under the season-average number
What's new: The season-average farm price is a marketing-year abstraction; the cash price at harvest is being pressed down by a physical problem — there is not enough room to store a record crop.
Evidence: A record 16.0-billion-bushel corn crop is arriving into a storage system that has stopped growing. US grain storage capacity is estimated near 25.5 billion bushels, and the surplus capacity above production has compressed to roughly 5%, well below the 15% that prevailed for most of this century; on-farm storage was already 80% utilized at the last count (American Farm Bureau Federation / farmdoc daily, 2026). The predictable result shows up in basis — harvest bids at some elevators have been reported more than $1.50 under the futures price as space tightens (AFBF Market Intel, 2026).
That is the wedge between the WASDE's $4.40 and the check a grower cashes in October. A season-average price assumes the crop is marketed across the whole year; a grower forced to sell at harvest, because there is nowhere to put the bushels, sells into the widest basis of the year. The margin improvement in Sections 2 and 3 is a marketing-year figure. Capturing it requires not selling everything into the harvest basis — which requires storage the system is short of.
Ground Truth: The $4.40 in the WASDE and the $4.40 a grower actually receives are two different numbers, and the difference this fall is storage. The margin math improves on paper, but a record crop with 5% surplus storage capacity means the growers who can hold bushels off the harvest low keep the WASDE number, and the ones who can't give a chunk of it back in basis. On-farm storage is not a fertilizer input, but this year it is a margin input — and it deserves a line in the 2027 capital conversation next to the nitrogen savings.
References
- USDA World Agricultural Supply and Demand Estimates (WASDE), July 2026 — 2026/27 corn and soybean balance sheets, season-average farm prices. https://www.usda.gov/oce/commodity/wasde
- farmdoc daily (University of Illinois), "2026 Illinois Crop Budgets" — Aug 19, 2025. https://farmdocdaily.illinois.edu/2025/08/2026-illinois-crop-budgets.html
- DTN/Progressive Farmer, "Fertilizer Prices Continue Downward Trend" (retail survey, week of Jul 13–17, 2026) — Jul 22, 2026. https://www.dtnpf.com/agriculture/web/ag/crops/article/2026/07/22/fertilizer-prices-continue-downward
- American Farm Bureau Federation, Market Intel, "Grain Storage Remains Tight" — 2026. https://www.fb.org/market-intel/grain-storage-remains-tight
- farmdoc daily (University of Illinois), "US Grain Storage Capacity Growth Has Stopped" — Feb 2026. https://farmdocdaily.illinois.edu/2026/02/us-grain-storage-capacity-growth-has-stopped.html
Disclosures
Crop Root Zone is an independent publication. Nothing here is investment advice. Market calls, where included, reflect the editors' own read and are not a recommendation to buy or sell any security.
Rent Fell a Dollar. The Fertilizer Bill Rose Forty. The 2027 Lease Is Being Negotiated Off the Wrong Number.
Iowa cash rent averaged $270 in 2026 — down $1. On our estimate, the same corn fertility program costs roughly $43 an acre more than it did a year ago.
Iowa's 2026 average cropland cash rent came in at $270 per acre — down one dollar from 2025 and $9 below the $279 peak set in both 2023 and 2024, according to the annual Iowa State University Extension survey. In Illinois, the Society of Professional Farm Managers and Rural Appraisers put mid-tier Excellent-quality ground at $375 per acre for 2026, and 67% of surveyed farm managers expect 2027 rents to be unchanged (ISPFMRA, Apr 13, 2026). The consensus, in short, is that land cost is a flat line into next year. That consensus is built on a widely repeated premise — that input costs have come down — and the premise is only one-quarter true.
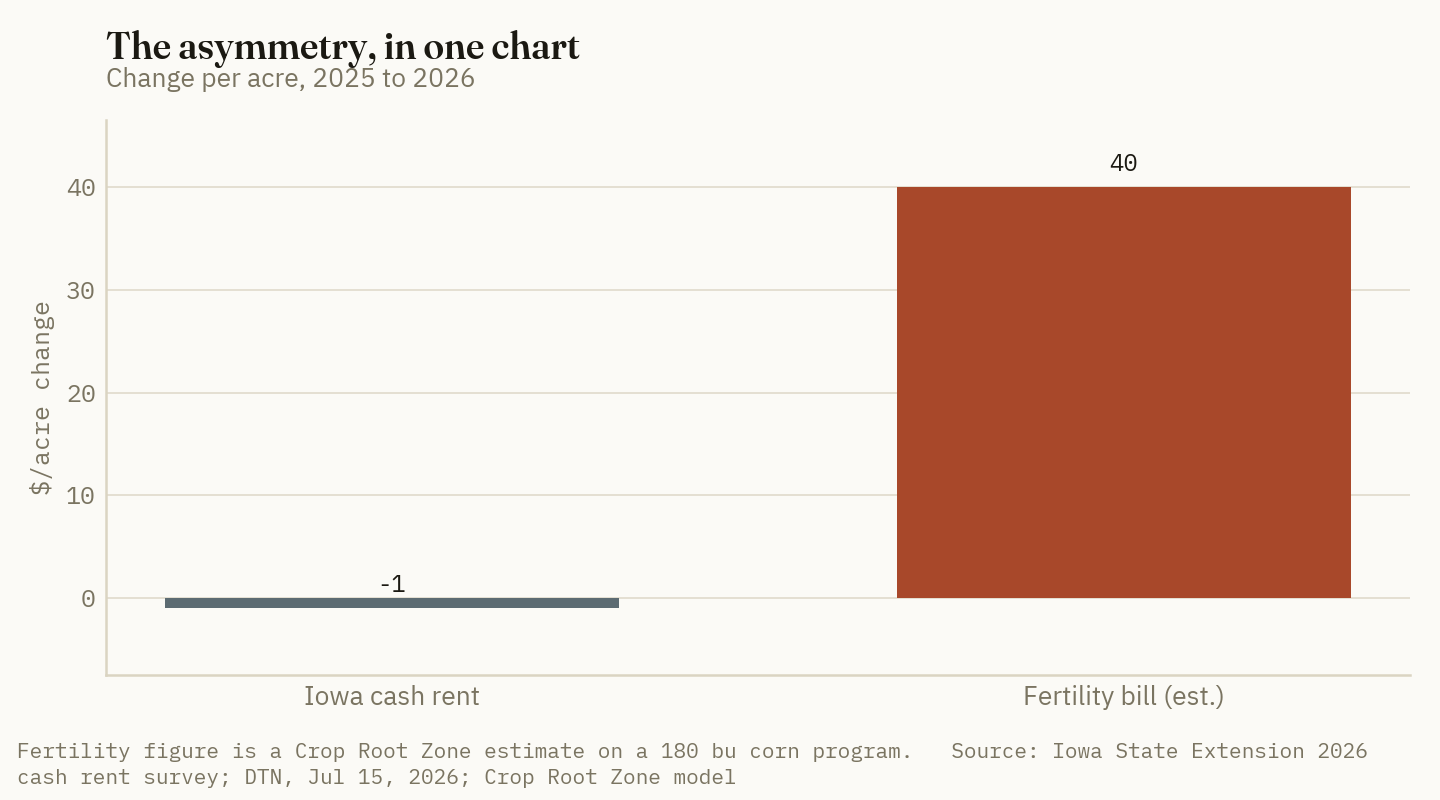
1. What the surveys actually say
What's new: Two of the most-watched rent surveys in the Corn Belt landed within weeks of each other, and both describe stability rather than adjustment.
Evidence: The ISU Extension survey put the 2026 Iowa average at $270/acre, −$1 (−0.4%) from 2025. District detail shows the same flatness: west central at $292 (−$3), northeast at $291 (−$1), northwest at $290 (+$2). Across high-, medium- and low-quality ground the adjustments were minor.
Illinois shows more level differentiation and the same directional stasis. ISPFMRA's April 13, 2026 survey reported 2026 cash rents of $400/acre (high tier), $375 (mid) and $320 (low) for Excellent-quality farmland; $325 mid-tier for Good; $273 for Average; $200 for Fair; and $43 for pastureland. Looking forward, 67% expect 2027 unchanged, 9% expect increases and 24% expect softening (farmdoc daily, Apr 2026).
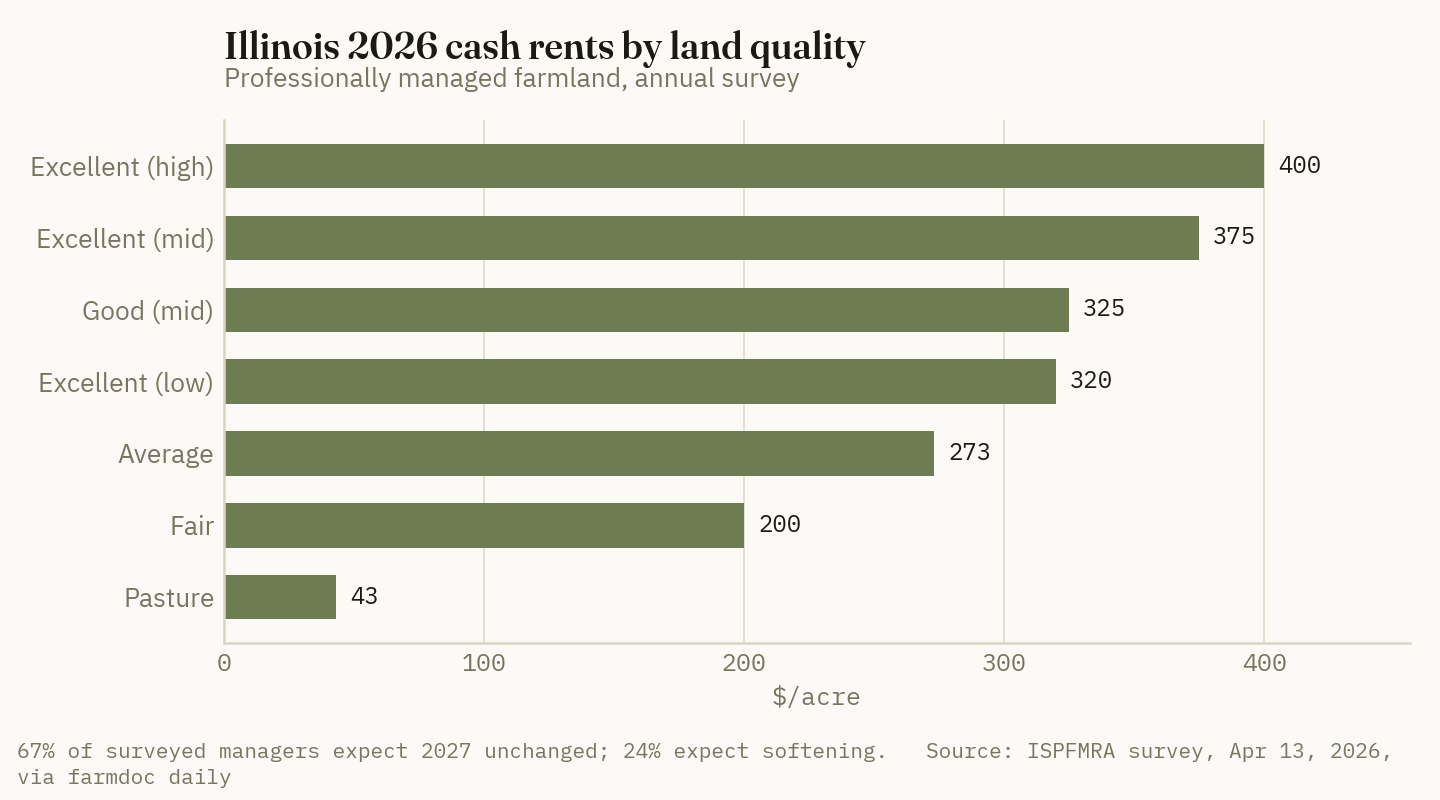
Two supporting details from the same survey are worth holding onto. Landlord income from cash-rented Excellent ground fell $25/acre from 2024 to 2025, while crop-share returns rose over the same period on what the survey described as slight reductions in input costs paired with strong yields. And 48% of managers expect economic conditions to hold steady in 2026, with 33% forecasting improvement.
Ground Truth: The crop-share-beats-cash-rent result from 2024–25 is the tell, and it is being misread as a one-off. Crop share outperformed because it is the only lease structure that automatically re-prices when yields and input costs move in the tenant's favor. Structure, not luck. If 2027 delivers the reverse — flat yields with a rising input bill — the same mechanism runs the other way and the cash lease becomes the safer side of the table. Landowners drawing the lesson "crop share pays better" from a two-year window are extrapolating a hedge as though it were a trend.
2. Rebuilding the fertility bill, both years
What's new: "Input costs came down" is a nitrogen statement being applied to a four-nutrient budget. Rebuilt line by line, the same fertility program is materially more expensive than a year ago.
Evidence: Start from DTN's retail survey for the week of July 6–10, 2026: anhydrous $1,032/ton (−6% MoM, +34% YoY); urea $714 (−6%, +9%); UAN28 $493 (−7%, +18%); UAN32 $529 (−7%, +6%); DAP $912 (+0.3%, +13%); MAP $954 (−0.1%, +13%); potash $494 (0%, +3%) (DTN, Jul 15, 2026). Nitrogen per unit ran $0.63/lb N for anhydrous on the same survey.
Now price a conventional 180-bushel corn fertility program. The following is a Crop Root Zone model, not a survey — rates are illustrative and the arithmetic is ours; every price input is cited above.
| Nutrient | Rate | Price basis | 2026 $/acre | 2025 $/acre* | |
|---|---|---|---|---|---|
| N | 180 lb N | Anhydrous, $0.63/lb N | 113 | 84 | ██████████ |
| P₂O₅ | 60 lb | DAP $912/st (46% P₂O₅) → $0.99/lb | 59 | 52 | █████ |
| K₂O | 60 lb | Potash $494/st (60% K₂O) → $0.41/lb | 25 | 24 | ██ |
| S | 20 lb S | AMS ≈ $645/st (24% S), less N credit | 16 | 13* | █ |
| Total | 213 | 173 |
Source: prices DTN/Progressive Farmer, Jul 15, 2026; USDA AMS, Jul 10, 2026. Rates and arithmetic are a Crop Root Zone model, not a survey. *2025 costs are implied by the year-over-year changes in the same DTN survey; the sulfur line is an estimate, since retail AMS did not track its feedstock one-for-one. Bars scale the 2026 column.
The year-ago column is built from the year-over-year changes in the same survey — anhydrous −34%, DAP −13%, potash −3%. Nitrogen does most of the work: it alone accounts for $29 of the $40 increase. The sulfur line is the one we are least sure of, because retail AMS did not track its feedstock one-for-one, and we have deliberately kept that estimate conservative rather than letting the record sulfur market flatter the argument.
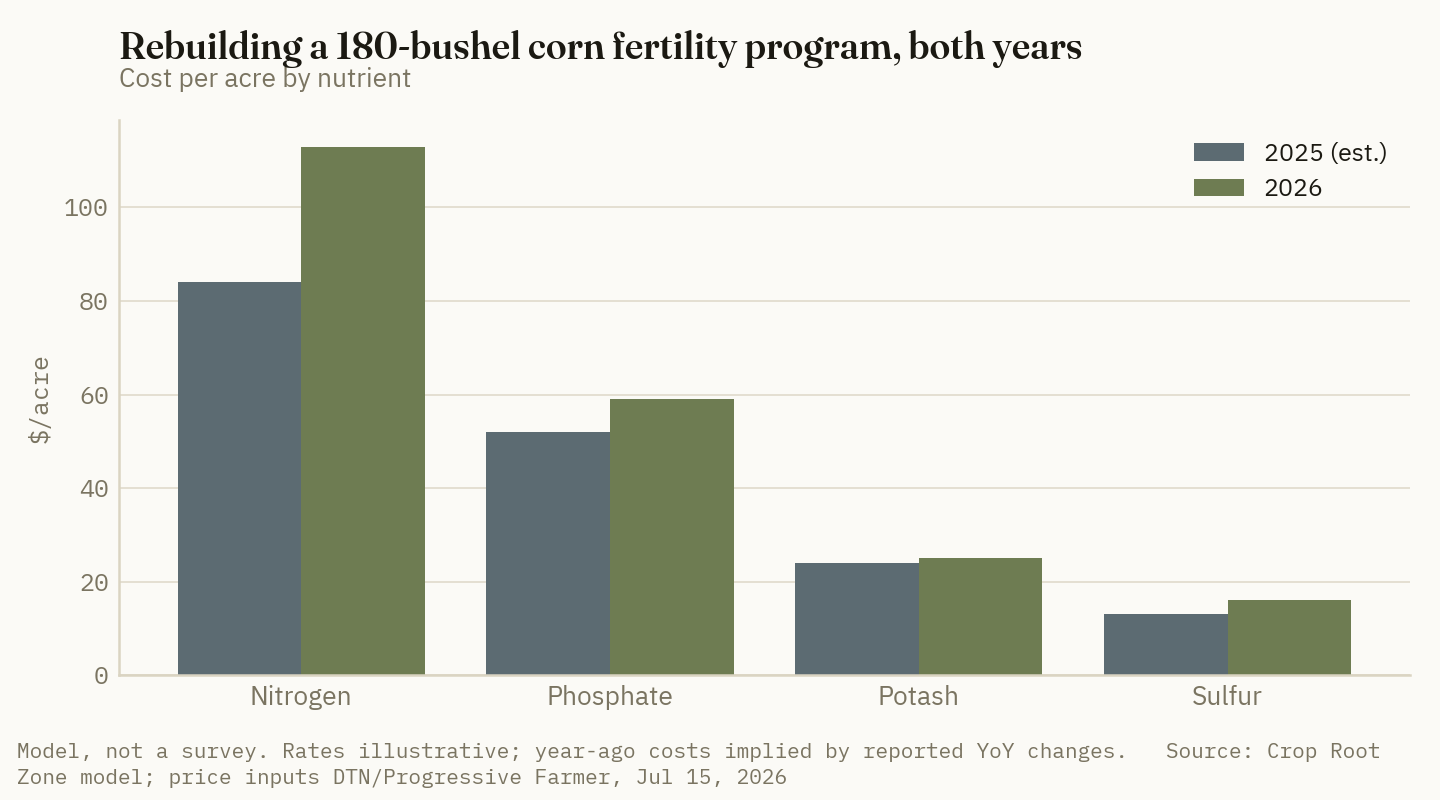
A ~$40/acre increase, or about 24%, in a year when cash rent fell one dollar.
40×
The tenant's fertility increase is roughly forty times the size of the landlord's rent concession — and only one of those two numbers appears in a published survey. (Crop Root Zone model; Iowa State Extension 2026 survey; DTN, Jul 15, 2026)
Ground Truth: The negotiating asymmetry is the whole story. Cash rent moved −0.4% and the fertility line moved something on the order of +24% — and only one of those two numbers is published in a survey the landowner reads. The tenant is carrying an input increase roughly forty times larger than the rent concession, and has no third-party document to point at. Any tenant walking into a 2027 renewal without a written, line-item fertility budget for both years is negotiating against a number the other side already has and bringing none of their own.
Market read: NTR — Hold — ag retail's margin holds up better in a dispersing input market than in a uniformly falling one, but flat rents and a squeezed tenant cap how much of the sulfur and phosphate cost-push can actually be passed through.
3. Why rent is sticky when the input bill is not
What's new: The mechanism that keeps rent flat is not a view about profitability. It is a market structure problem, and it is worth naming because it determines what a tenant can actually negotiate.
Evidence: Farmland rent is set in an auction with very few sellers and many bidders, on a one-year clock, with a relationship attached. The tenant who asks for a $20 reduction is not bidding against the landlord's economics; they are bidding against a neighbor who will take the ground at last year's number to keep a combine busy. ISU's own district data show that dynamic at work: even the softest district moved only $3.
Input prices behave in the opposite way. They are set in a global market with thousands of participants and reprice weekly — visibly, as the 2026 nitrogen round trip demonstrated in four months. So one side of the tenant's cost structure moves 24% and the other moves 0.4%, and the gap accumulates entirely inside the operating margin.
Note the corollary that the 2026 surveys make explicit: better price expectations for corn and soybeans — supported by USDA's May WASDE update, with futures signaling some of the strongest expectations in over a year — are part of what kept rents from falling. Improved revenue expectations are being capitalized into land cost in advance of the revenue arriving.
Ground Truth: Rent will not adjust for input costs. It adjusts for revenue expectations, and it adjusts late. That has a direct tactical consequence: the tenant's leverage in a 2027 negotiation is not the fertilizer bill — the landowner has no framework for it and no obligation to care. The leverage is a credible, documented statement of what the tenant can pay at the futures curve the landlord is already looking at. Argue revenue, not cost, and put the fertility budget in the appendix where it belongs.
4. What to change in the 2027 lease
What's new: If rent is going to stay flat and input costs are going to disperse, the productive negotiation is over lease structure, not lease level.
Evidence: Three structures are already common enough to ask for without inventing anything.
Flexible cash rent. A base rent plus a bonus tied to realized gross revenue per acre. It preserves the landlord's floor — the thing they actually care about — while sharing the upside. In a year where revenue expectations are the reason rent stayed high, a flex lease prices exactly the variable both sides claim to be negotiating over.
Input-indexed adjustment. Rarer, and harder to sell, but defensible when one input is genuinely dislocated. Sulfur is the live example: the Q3 2026 Tampa molten sulfur contract settled at $705 per long ton, a record and $50 above Q2 (Argus, Jul 13, 2026), while Chinese sulfur spot ran +311% year over year as of July 21 (Trading Economics). An S-heavy program on high-yield corn is absorbing a cost shock with no analog in the rent series.
Longer term with a mid-term reset. A three-year lease with a formula reset in year two converts the annual auction into a planning horizon, which is worth real money to a tenant making variable-rate, drainage or lime investments whose payback exceeds twelve months.
The counter-argument deserves fair statement: landowners resist all three because a flat number is legible, enforceable and comparable to what the neighbor is getting, and because flex structures require trusting the tenant's yield and price reporting. That is a real objection, not a rhetorical one — which is why flex leases work best where a farm manager or a third-party settlement agent is already in the chain, as they are on most professionally managed Illinois ground.
Ground Truth: The 24% of Illinois farm managers expecting 2027 softening are the negotiation. That minority is where the structural terms get set, because they are the only cohort already conceding that something has to give — and structure is cheaper for a landowner to give than level. A tenant who walks into that 24% asking for a flex clause instead of a $20 cut will get a hearing. A tenant who walks into the 67% expecting no change and asks for either one will not.
5. What to watch before renewal season
What's new: Two dates between now and lease season will do more to set the 2027 negotiating frame than any input print.
Evidence: The first is the fall WASDE sequence and the corn and soybean season-average price projections that follow it — the same channel that kept 2026 rents from falling. The second is the fall fill and prepay window, which is when the 2027 fertility bill actually gets fixed, and which this year sits on top of an unusually two-sided nitrogen market: retail nitrogen has fallen five straight weeks even as the phosphate and sulfur complexes hold at or near highs.
Sequencing matters here. Most cash leases in Iowa and Illinois are renewed or terminated on a statutory September 1 notice date — before the fall fill decision is made and before the crop is fully priced. The tenant is therefore asked to commit to the land cost while both the revenue and the largest controllable cost are still open.
Ground Truth: That sequencing is the structural disadvantage, and it is fixable without renegotiating a dollar of rent. Move the fertility purchase decision ahead of the lease decision rather than behind it — get the fall fill quotes in hand in August, not October — and the tenant walks into the September renewal knowing two of the three numbers instead of one. It converts the lease conversation from a guess about next year's costs into arithmetic. That is a change in preparation, not in terms, and it is the only one available to a tenant who has no leverage on level.
References
- Iowa State University Extension, 2026 Cash Rental Rates for Iowa survey — average $270/acre, −$1 vs 2025 (as reported May 2026). https://www.farmprogress.com/farm-business/why-iowa-cropland-cash-rents-barely-budged-in-2026
- Illinois Society of Professional Farm Managers and Rural Appraisers annual survey, Apr 13, 2026, as analyzed in "Illinois Cash Rents and Leasing Expectations Through 2027," farmdoc daily, Apr 2026. https://farmdocdaily.illinois.edu/2026/04/illinois-cash-rents-and-leasing-expectations-through-2027.html
- Pro Farmer, "2026 Average Iowa Cash Rent Eases" — 2026. https://www.profarmer.com/news/agriculture-news/2026-average-iowa-cash-rent-eases
- DTN/Progressive Farmer, "UAN Fertilizers Lead Nutrient Prices Downward" (retail survey, week of Jul 6–10, 2026) — Jul 15, 2026. https://www.dtnpf.com/agriculture/web/ag/crops/article/2026/07/15/uan-fertilizers-lead-nutrient-prices
- USDA AMS Livestock, Poultry & Grain Market News — North Carolina Production Cost Report, ammonium sulfate distributor ask, week ending Jul 10, 2026. https://mymarketnews.ams.usda.gov/
- Argus Media, Q3 2026 Tampa molten sulfur contract settlement, $705/lt delivered — Jul 13, 2026.
- Trading Economics, Sulfur commodity price — accessed Jul 21, 2026. https://tradingeconomics.com/commodity/sulfur
Disclosures
Crop Root Zone is an independent publication. Nothing here is investment advice. Market calls, where included, reflect the editors' own read and are not a recommendation to buy or sell any security.
Wheat's Balance Sheet Just Tightened. The 2027 Acre Is the Question.
USDA cut the 2026 crop 23% to 1.536 billion bushels and pushed the farm price to $6.00 — but wheat's lower nitrogen bill, not the price, is what defends its ground.
USDA did something in July it has not done in years: it printed a wheat number that matters. The July 10 World Agricultural Supply and Demand Estimates cut projected 2026 U.S. wheat production to 1.536 billion bushels, down 449 million — 23% — from the 1.985 billion harvested in 2025, and the smallest domestic wheat crop since the 1970/71 marketing year (USDA WASDE, Jul 10, 2026). Projected 2026-27 ending stocks fell to 722 million bushels from the 920 million left over from old crop, and the department raised the season-average farm price to $6.00 per bushel. In the same report corn and soybeans stayed comfortable. Wheat was the one balance sheet that tightened — and the question that matters for the fertilizer and crop-economics reader is not whether it tightened, but whether a $6.00 wheat and a 722-million-bushel carryover are enough to change what gets planted, and fertilized, in the fall of 2026 and spring of 2027.
1. The one balance sheet that tightened
What's new: The 2026 crop is not just smaller, it is a structural shortfall. Winter wheat came in at 990.5 million bushels, down 29% from 2025, on a harvested yield of 46.7 bu/acre and 21.21 million harvested acres — down from 25.5 million a year earlier (USDA Crop Production, Jul 10, 2026). Spring wheat, at 475 million bushels, was down only 4%. Carryover did the rest of the work: 722 million bushels of projected 2026-27 ending stocks is 198 million — better than a fifth — below the old-crop 920 million.
Evidence: Run the numbers against total use of 1.874 billion bushels and the stocks-to-use ratio lands at 38.5% (Crop Root Zone calculation from USDA WASDE, Jul 10, 2026), the tightest wheat carryover cushion in several seasons. The season-average farm price moved with it: $6.00/bu for 2026-27, up a full dollar — 20% — from the $5.00 USDA carried for 2025-26 (USDA WASDE, Apr 9 and Jul 10, 2026).
| Item | 2025-26 | 2026-27 | Change | Basis |
|---|---|---|---|---|
| U.S. all-wheat production | 1,985 | 1,536 | −23% | million bu |
| Ending stocks (carryover) | 920 | 722 | −22% | million bu |
| Season-avg farm price | 5.00 | 6.00 | +20% | $/bu, MYA |
Source: USDA WASDE, Jul 10, 2026; 2025-26 farm price per USDA WASDE, Apr 9, 2026.
1.536 billion bu
The 2026 U.S. wheat crop — the smallest since 1970/71, and down 23% year over year — is what pulled carryover under 725 million bushels. (USDA WASDE, Jul 10, 2026)
Ground Truth: A 38.5% stocks-to-use ratio is tight for U.S. wheat but not alarming by global standards, and that is the whole tension of this report. World 2026-27 ending stocks slipped only to 272.8 million tonnes from 275.4 million (USDA WASDE, Jul 10, 2026) — a rounding error on the global sheet. The U.S. crop shrank; the world's did not. That gap caps how far a domestic shortfall can carry cash prices, because the U.S. is the residual supplier, not the marginal one. Traders who lived through 2007 and 2010 know the difference between a U.S. story and a world story, and this is the former.
2. Price responded — unevenly across the three wheats
What's new: Futures did what a smaller crop and a $1.00 farm-price bump should do — they firmed, led by hard red winter, the class that took the deepest production cut. By late July, wheat had climbed back toward $7.00 on the Kansas City board, its highest since May 2024, with Black Sea tension supplying the last push (Trading Economics, Jul 24, 2026). But the move is not uniform: the three exchanges are pricing three different stories.
Evidence: New-crop December contracts at the July 15 close ran KC hard red winter at $6.81¼, Minneapolis hard red spring at $6.74¼, and Chicago soft red winter at $6.50½ (Barchart / CME Group, Jul 15, 2026). HRW leads because HRW is where the crop was lost — Southern Plains drought took the class from the 2025 baseline down to 470.9 million bushels, while soft red winter, an Eastern Corn Belt double-crop, held near 287 million and never carried the same scarcity premium (USDA Crop Production, Jul 10, 2026).
| Class (Dec '26 futures) | $/bu | |
|---|---|---|
| KC hard red winter (HRW) | 6.81 | ██████████ |
| Minneapolis hard red spring (HRS) | 6.74 | █████████ |
| Chicago soft red winter (SRW) | 6.50 | ██████ |
Source: Barchart / CME Group, Dec 2026 contracts, Jul 15, 2026. Bars scaled on the premium over a $6.00 base to show relative spread.
Ground Truth: The class spread is the tradable signal, not the flat price. HRW carrying a 30-cent premium over SRW on the new-crop board is the market paying growers to keep hard red winter ground in the Southern Plains — exactly where acres have been bleeding out. For a Plains grower the relevant number is not "wheat is $6.81," it is "my class is bid over the Gulf soft-wheat benchmark for the first time in three seasons." That premium, if it survives to fall seeding, is worth more to the HRW planting decision than the headline WASDE price, because it is basis the grower actually captures.
3. The 2027 acre: a real signal, too small to move good ground
What's new: The tightening lands on an acreage base already at a record low. USDA's June 30 report put 2026 all-wheat plantings at 42.74 million acres, down 5.7% and the smallest on record, with winter wheat at a six-year-low 31.52 million (USDA Prospective Plantings, Jun 30, 2026). The 2027 question is whether $6.00 wheat and a firm HRW premium reverse a multi-year exodus that has run toward soybeans (84.7 million acres, up 4% in 2026) and held corn near 95 million.
Evidence: On contestable, high-quality ground, the arithmetic still favors row crops. A 180-bu corn crop at the $4.40 MYA price grosses roughly $792/acre; a 50-bu HRW crop at $6.00 grosses $300 (Crop Root Zone estimate from USDA WASDE farm prices, Jul 10, 2026). Wheat does not win that comparison and a one-dollar price bump does not close a near-$500 gross-revenue gap. Where wheat wins is the ground corn cannot contest — dryland Southern Plains acres whose real alternatives are grain sorghum, cotton, or summer fallow, not 180-bu corn.
| Crop (2026-27) | MYA price, $/bu | Yield, bu/acre | Gross, $/acre |
|---|---|---|---|
| Corn | 4.40 | 180 | 792 |
| Soybeans | 11.40 | 55 | 627 |
| HRW wheat | 6.00 | 50 | 300 |
Source: prices USDA WASDE, Jul 10, 2026; yields are illustrative Crop Root Zone assumptions for a per-acre comparison, not USDA forecasts.
Ground Truth: This wheat signal defends acres; it does not recruit them. The tighter balance sheet is strong enough to pull dryland HRW ground back from fallow and to slow the bleed to sorghum and cotton in the Southern Plains — but it is nowhere near strong enough to bid an Iowa or Illinois acre away from corn and beans. Anyone reading the 722-million-bushel carryover as the bottom of a wheat-acreage recovery is over-reading it. The realistic 2027 outcome is a base that stops shrinking, concentrated in HRW country, not a genuine expansion. Watch the winter-wheat seedings report in January; a print that merely holds 31.5 million acres would confirm the floor.
4. Wheat's real edge is the fertility bill — and it just got cheaper
What's new: The reason wheat survives at all in a corn-and-bean world is that it costs far less to feed, and the July fertilizer market widened that advantage at exactly the moment the wheat price improved. Retail nitrogen rolled over hard: for the week of July 13-17, DTN put anhydrous at $967/ton — back under $1,000 for the first time in 17 weeks — urea at $682, below $700 for the first time in 17 weeks, and UAN32 at $465 (DTN/Progressive Farmer, Jul 22, 2026). Month over month, UAN32 fell 15%, anhydrous 11%, and urea 7%.
Evidence: Wheat's nitrogen requirement is a fraction of corn's. A 50-bu HRW crop top-dressed to roughly 80 lb N/acre at July urea pricing (about $0.74/lb N) carries a nitrogen bill near $59/acre; a 180-bu corn crop at roughly 180 lb N/acre and a blended anhydrous-plus-UAN cost near $0.65/lb N runs about $117/acre (Crop Root Zone estimate from DTN retail prices, Jul 17, 2026). Add phosphate, potash, and sulfur and wheat's total fertility lands near $115/acre against corn's roughly $250 — with the caveat that phosphate did not follow nitrogen down. DAP held at $911/ton and MAP at $958 in mid-July, both up double digits year over year (DTN/Progressive Farmer, Jul 22, 2026), so the wheat-fertility discount is a nitrogen story, not a phosphate one.
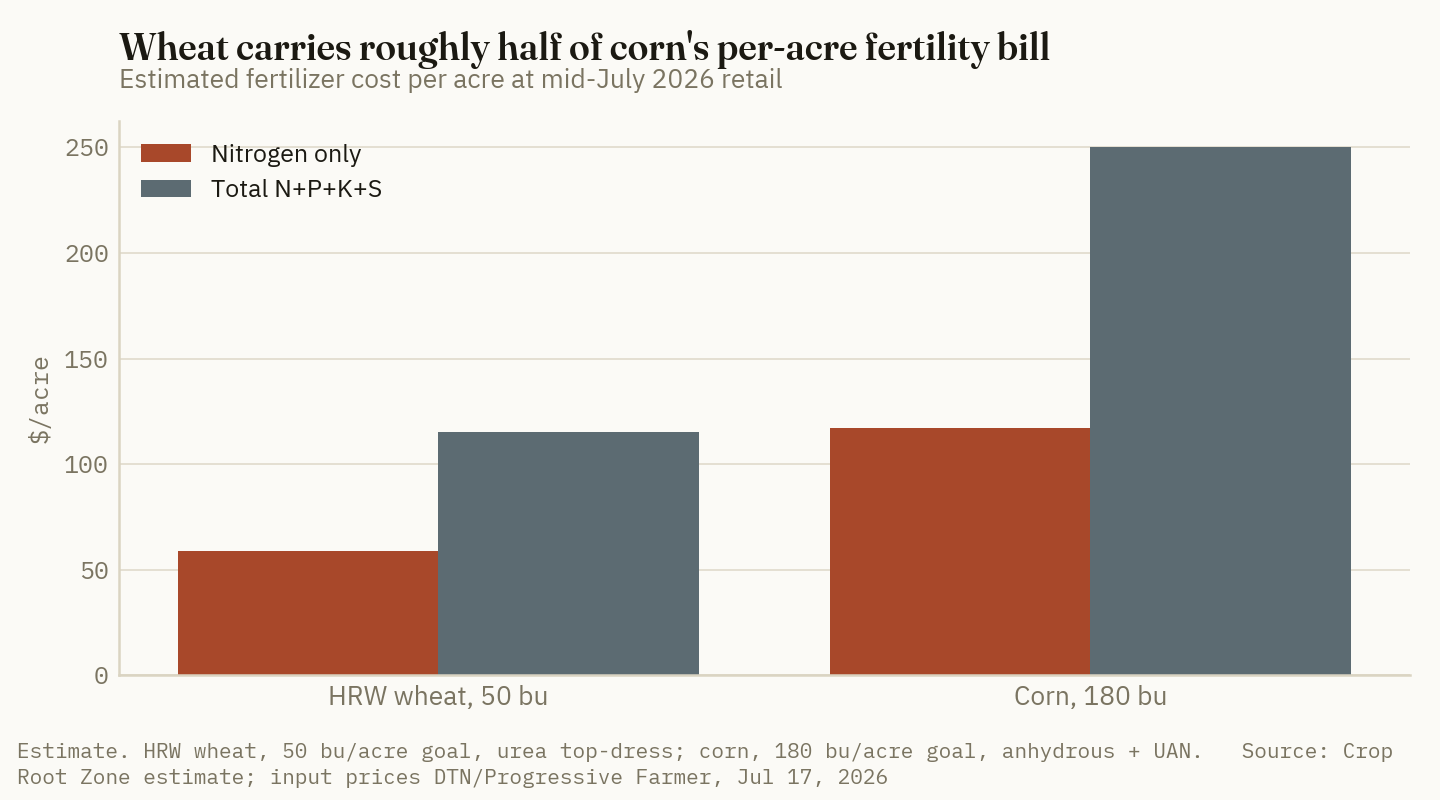
There is a cleaner way to see how the two moves — firmer wheat, softer nitrogen — compound. Price a ton of urea in bushels of the crop that has to buy it:
| Crop | $/bu | Bushels to buy 1 ton urea | |
|---|---|---|---|
| HRW wheat | 6.00 | 114 | ███████ |
| Corn | 4.40 | 155 | ██████████ |
Source: Crop Root Zone calculation; urea $682/ton, DTN/Progressive Farmer, Jul 22, 2026; MYA prices USDA WASDE, Jul 10, 2026. Fewer bushels is better.
Ground Truth: Here is the counter-intuitive part that the per-acre chart hides. Wheat's nitrogen bill is lower in absolute dollars — about $58/acre less than corn — but per bushel produced it is not obviously cheaper: $59 of N across a 50-bu crop is $1.18/bu, while corn's $117 across 180 bu is $0.65/bu. Corn is the more nitrogen-efficient converter. So wheat's fertility edge is not that it makes cheaper grain; it is that it puts far less capital at risk per acre. That is precisely the trait a grower wants on marginal, drought-exposed dryland where the crop might fail — you lose $115 of fertility, not $250. The July nitrogen break sharpens that risk-capital logic just as the wheat price improves, and that combination, not the $6.00 headline, is the strongest real argument for holding wheat acres into 2027.
References
- USDA, World Agricultural Supply and Demand Estimates (WASDE) — Jul 10, 2026. https://www.usda.gov/oce/commodity/wasde/
- USDA NASS, Crop Production — Jul 10, 2026 (winter, spring, and by-class wheat production and yield). https://www.nass.usda.gov/
- USDA NASS, Prospective Plantings — Jun 30, 2026 (2026 all-wheat and winter-wheat acreage). https://www.nass.usda.gov/
- USDA WASDE — Apr 9, 2026 (2025-26 season-average wheat farm price, $5.00/bu). https://www.usda.gov/oce/commodity/wasde/
- "July 10 WASDE Report Provides Some Strength to Grain Markets," Morning Ag Clips — Jul 12, 2026. https://www.morningagclips.com/july-10-wasde-report-provides-some-strength-to-grain-markets/
- Barchart / CME Group, December 2026 wheat futures (ZW, KE, MW) — Jul 15, 2026. https://www.barchart.com/futures/quotes/KEZ26
- Trading Economics, Wheat (CBOT front month) — Jul 24, 2026. https://tradingeconomics.com/commodity/wheat
- "Fertilizer Prices Continue Downward Trend," DTN/Progressive Farmer — Jul 22, 2026 (retail week of Jul 13-17). https://www.dtnpf.com/agriculture/web/ag/crops/article/2026/07/22/fertilizer-prices-continue-downward
- "USDA cuts U.S. wheat crop guess further," Brownfield Ag News — Jul 10, 2026. https://www.brownfieldagnews.com/news/usda-cuts-u-s-wheat-crop-guess-further/
Disclosures
Crop Root Zone is an independent publication. Nothing here is investment advice. Market calls, where included, reflect the editors' own read and are not a recommendation to buy or sell any security.
85.4 Million Bean Acres: What a Four-Million-Acre Rotation Shift Actually Does to the Fertilizer Bill
The swing to soybeans pulls roughly 220,000–320,000 short tons of nitrogen out of 2026 demand — about 1.3–1.9% of US consumption, and nowhere near enough to break the nitrogen bid. Meanwhile potash and sulfur removal go up.
USDA's July 10, 2026 World Agricultural Supply and Demand Estimates put 2026 US planted soybean acreage at 85.4 million acres — a slight increase from the June estimate and 4.2 million acres above the 81.2 million planted in 2025 (USDA WASDE, Jul 10, 2026). Corn's side of the ledger was left essentially unchanged on updated planted and harvested area from the June 30 Acreage report, with national yield held at 183.0 bu/acre. December 2026 corn closed at $4.61/bu the day the report landed. That is a large one-year migration of Corn Belt acres away from the crop that carries a 150-pound nitrogen bill and toward the crop that fixes its own. The obvious inference — that the nitrogen market just lost a meaningful chunk of demand — is directionally right and quantitatively much smaller than most growers assume. The less obvious inference is that the shift makes the potash and sulfur bill heavier, at exactly the moment sulfur is trading at a record.
1. What the July WASDE actually said
What's new: The July report confirmed the acreage swing rather than revising it away, and paired a record soybean crop with enough demand to keep the balance sheet from loosening.
Evidence: Planted soybean area was carried at 85.4 million acres for 2026, up from 81.2 million in 2025 (USDA WASDE, Jul 10, 2026). USDA held the 2026/27 national soybean yield forecast at 53.0 bu/acre; combined with the higher acreage reported June 30, production was projected at a record 4.475 billion bushels. Exports were raised 30 million bushels to 1.66 billion on recent sales activity, beginning stocks cut 10 million bushels, and 2026/27 ending stocks left unchanged from June at 310 million bushels, with a season-average farm price of $11.40/bu (Grain Journal summary of the July WASDE, Jul 10, 2026). On the corn side, 2026/27 production was essentially unchanged with yield at 183.0 bu/acre.
The board did not treat the report as bearish. December 2026 corn settled at $4.61/bu on July 10 and had firmed to 464.00 cents/bu by the July 16 CBOT close; September 2026 corn closed 441.50 cents/bu, August 2026 soybeans 1195.00 cents/bu and September 2026 soybeans 1185.25 cents/bu the same day. Crop condition through the week ending June 8, 2026 ran 66% good-to-excellent for corn and 65% for emerged soybeans — a normal-to-good crop, not a weather story.
Ground Truth: A record 4.475-billion-bushel bean crop that leaves ending stocks unchanged at 310 million bushels is the tell. The acreage did not go to soybeans because the bean balance sheet was tight — it went because the corn input bill got heavy enough that growers were willing to plant a crop into a record-supply year anyway. That distinction matters for 2027: acreage bought by cost relief reverses faster than acreage bought by demand, because the input side is the leg that moves first.
2. The per-acre arithmetic that bought the acres
What's new: At mid-July futures and mid-July retail fertilizer, corn's revenue advantage per acre is real but is nearly consumed by its fertilizer gap alone — before seed, drying, or machinery differences enter the budget.
Evidence: The DTN/Progressive Farmer retail survey for the week of Jul 6–10, 2026 (published Jul 15, 2026) put anhydrous ammonia at $1,032/ton, up 34% year over year despite a 6% month-over-month decline; urea at $714/ton (−6% MoM, +9% YoY); UAN28 at $493 (−7% MoM, +18% YoY) and UAN32 at $529 (−7%, +6%). On a nutrient basis that is $0.63/lb N for anhydrous, $0.78/lb N for urea, $0.83/lb N for UAN32 and $0.88/lb N for UAN28. Phosphates stayed firm: DAP $912/ton (+13% YoY), MAP $954 (+13% YoY). Potash was $494/ton (+3% YoY). It was the fifth straight week of mostly lower retail prices — but the year-over-year column, not the weekly column, is what a 2027 budget has to clear.
For rates: farmdoc's national work put the 2024 trend nitrogen application rate on corn at 151.8 lb N/acre, against 0.85 lb of N per bushel produced (farmdoc daily, "Trends in Fertilizer Use and Efficiency in the U.S.," May 29, 2025). University of Minnesota Extension's rate guidance for corn following soybean is 150 lb N/acre at a 0.10 N-cost-to-corn-price ratio and 135 lb N/acre at 0.150, where the ratio is N cost per pound divided by corn price per bushel (UMN Extension, Brad Carlson, Oct 21, 2025). At $0.63/lb N anhydrous and $4.61/bu corn, that ratio is 0.137 — squarely in the rate-trimming zone.
Crop Root Zone estimate — the per-acre gap (assumptions stated): at 183 bu/acre and Dec 2026 corn of 464.00 cents/bu, corn gross revenue is roughly $849/acre. At 53 bu/acre and Sep 2026 soybeans of 1185.25 cents/bu, soybean gross revenue is roughly $628/acre — a $221/acre revenue edge to corn. Against that, corn's nitrogen program alone runs $96/acre on anhydrous at 151.8 lb N, $118/acre on urea, or $126/acre on UAN32 at the July retail prints above; soybeans carry no comparable line. Illinois survey budgets put total 2026 per-acre fertilizer spending at roughly $229 for corn against $61 for soybeans (farmdoc/University of Illinois 2026 Illinois crop budgets) — a $168/acre gap that leaves only about $53/acre of corn's revenue edge intact before seed, crop protection and drying are counted. This is a modeled illustration at a single day's futures and a single week's retail prices, not a farm budget; regional basis, N source, owned-versus-rented ground and applied rate will move every line.
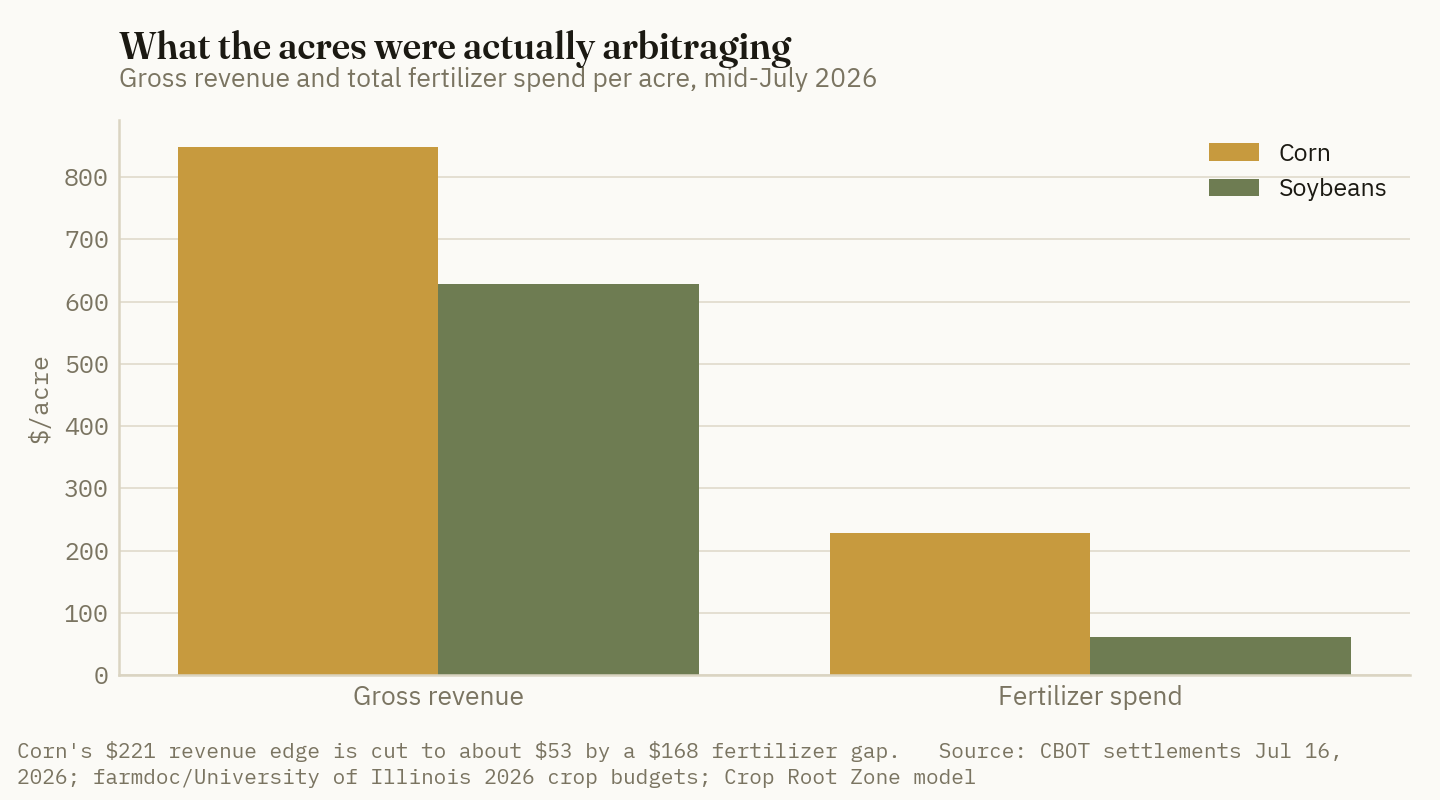
3. The nitrogen tonnage the shift actually removes
What's new: Converted to nutrient tons, a four-million-acre rotation swing is a rounding error against US nitrogen consumption — not a market-clearing event.
Evidence and model (Crop Root Zone estimate — assumptions stated): USDA NASS carried 2026 corn plantings at 95.3 million acres, down 3% from 2025, implying roughly 98.2 million acres in 2025 and a corn-acre decline near 2.9 million. Two framings bracket the answer:
- Corn-acre basis. 2.9 million fewer corn acres × 151.8 lb N/acre (farmdoc 2024 trend rate) = about 440 million lb of N, or roughly 220,000 short tons of N.
- Bean-acre basis, assuming the full 4.2-million-acre soybean gain displaced corn: 4.2 million × 151.8 lb N/acre = about 638 million lb, or roughly 319,000 short tons of N. Soybean starter nitrogen is treated as zero here, which slightly overstates the saving.
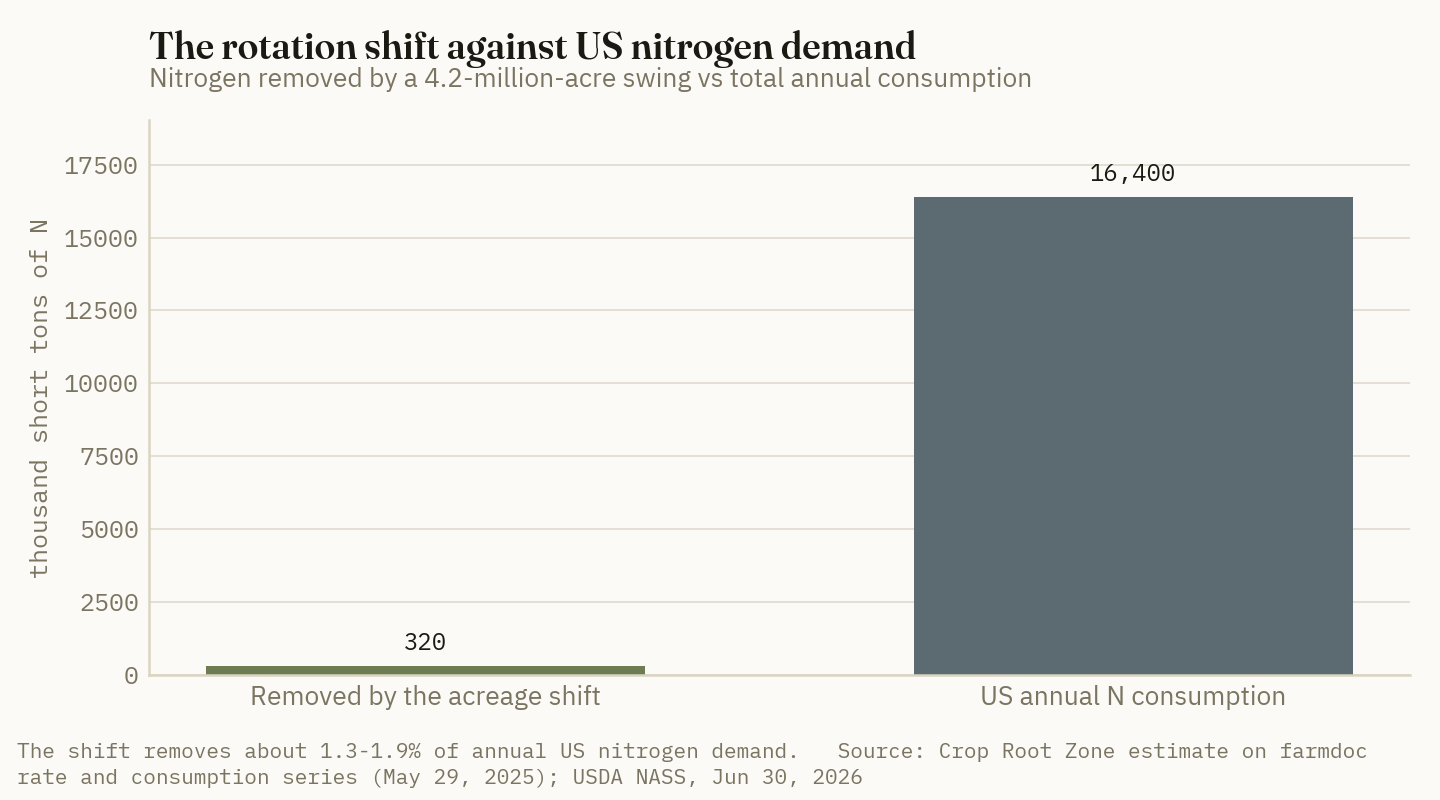
Set that against total US nitrogen use. Farmdoc's series put 2022 US nitrogen consumption at about 14,900 thousand metric tons — roughly 16.4 million short tons of N — with corn accounting for about 78% of nitrogen use among the major row crops (farmdoc daily, May 29, 2025). The acreage shift therefore removes about 1.3% to 1.9% of annual US nitrogen demand.
1.3–1.9%
The share of annual US nitrogen demand removed by a four-million-acre rotation swing — inside the year-to-year noise of application timing alone. (Crop Root Zone estimate on farmdoc rate and consumption series, May 29, 2025) At the anhydrous nutrient cost of $0.63/lb N, the grower-side saving is roughly $277 million to $402 million across the whole US crop — a real number for the ag-retail channel, and almost nothing against a nitrogen complex whose delivered anhydrous price is still up 34% year over year.
Ground Truth: This is the number that should stop the "beans will break nitrogen" argument. A 1.3–1.9% demand reduction is inside the year-to-year noise of application timing alone — a wet fall that pushes anhydrous out of the ground moves more tons than this rotation shift does. The 2026 nitrogen bid is being set on the supply side (turnarounds, gas, and freight), which is exactly what the DTN prints show: five straight weeks of softening against a year-over-year column that is still up 34% on ammonia and 18% on UAN28. Growers waiting for the acreage story to deliver cheap fall nitrogen are waiting on the wrong variable. Buy the seasonal weakness, not the acreage narrative.
Market read: CF Industries Holdings — CF — Hold — the acreage swing subtracts under 2% of US nitrogen demand while ammonia realizations remain up 34% year over year, so the volume hit is real but too small to justify either adding on a demand thesis or trimming on an acreage scare.
4. Why the fertilizer bill does not fall proportionally
What's new: Soybeans fix nitrogen; they do not fix potassium, sulfur, or phosphate. Move four million acres and the nutrient bill does not shrink — it re-sorts, and two of the four legs get bigger.
Evidence: Grain removal rates are the cleanest way to see it. Michigan State Extension's removal table (Jun 18, 2026) puts soybean grain at 0.80 lb P2O5 and 1.15 lb K2O per bushel, against corn grain at 0.35 lb P2O5 and 0.20 lb K2O per bushel; University of Illinois Extension's soybean management guide uses 0.75 lb P2O5 and 1.17 lb K2O per bushel. On sulfur, replicated work summarized by Pioneer puts soybean total S uptake at 0.21 lb S/bu with 0.18 lb S/bu removed in the grain — and sulfur is not merely a yield nutrient in soybeans, it is a cofactor in root-nodule formation, so a short sulfur supply directly restricts the nitrogen fixation the whole rotation argument depends on.
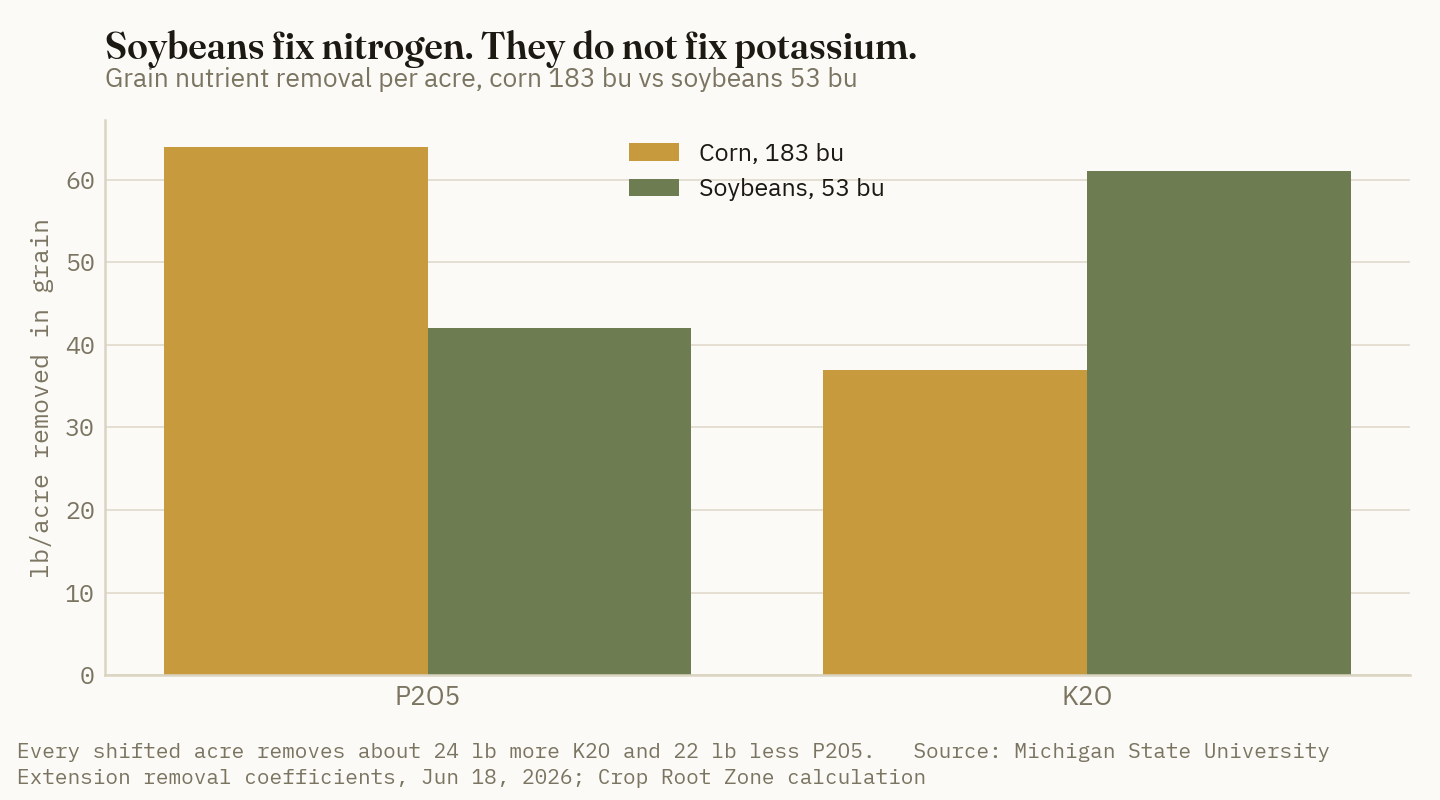
| Nutrient | Corn, 183 bu | Soybeans, 53 bu | Per shifted acre | US total effect |
|---|---|---|---|---|
| P₂O₅ removed | 64 lb | 42 lb | −22 lb | ≈ −46,000 st P₂O₅ |
| K₂O removed | 37 lb | 61 lb | +24 lb | ≈ +51,000 st K₂O |
| Nitrogen applied | 151.8 lb | 0 | −151.8 lb | ≈ −220–320,000 st N |
Source: removal coefficients Michigan State University Extension, Jun 18, 2026; nitrogen rate farmdoc daily, May 29, 2025; yields per USDA WASDE, Jul 10, 2026. Per-acre and national totals are a Crop Root Zone calculation on 4.2 million shifted acres.
Crop Root Zone estimate (assumptions: 53 bu/acre soybeans and 183 bu/acre corn per the July WASDE; MSU grain-removal coefficients; 4.2 million acres shifted; retail potash $494/ton at 60% K2O = $0.412/lb K2O):
- Potassium goes up. A 53-bu soybean crop removes about 61 lb K2O/acre; a 183-bu corn crop removes about 37 lb K2O/acre in grain. That is roughly 24 lb K2O/acre more on every shifted acre — about 102 million lb, or 51,000 short tons of K2O (≈85,000 short tons of muriate) of additional replacement demand, worth roughly $42 million at July retail.
- Phosphate goes down. Corn grain removes about 64 lb P2O5/acre at 183 bu; soybeans about 42 lb at 53 bu. The shift cuts P2O5 removal by roughly 22 lb/acre, or about 46,000 short tons of P2O5 — but with DAP at $912/ton and MAP at $954/ton, both up 13% year over year, price is doing more to the phosphate bill than acreage is.
- Sulfur goes up, into a record market. At 0.18 lb S/bu removed in grain, the full 85.4-million-acre soybean crop removes on the order of 406,000 short tons of sulfur. Replacing it is the most expensive it has ever been: Argus reported the Q3 2026 Tampa molten sulfur contract settled at a record $705/long tonne delivered on Jul 13, 2026, up $50 from Q2's $655, and Chinese spot sulfur was 9,435.67 CNY/T on Jul 20, 2026 — up 310.66% year over year, off a June 2026 all-time high of 11,084.33 (Trading Economics, Jul 20, 2026).
Ground Truth: The rotation shift is not a fertilizer-bill reduction; it is a nutrient substitution that trades a $0.63/lb nitrogen problem for a potassium-and-sulfur problem in a market where sulfur has quadrupled year over year. On a shifted acre the grower avoids roughly $96/acre of anhydrous nitrogen and picks up roughly $10/acre of incremental potash — a clear net win at today's prices, which is why the acres moved. But the sulfur leg is the one that is mispriced in most 2027 budgets: soybeans need sulfur to fix nitrogen at all, and the crop that was planted specifically to dodge the nitrogen line is now exposed to the fastest-inflating nutrient on the board. Expect ammonium sulfate and ATS premiums to widen against urea through the fall — the substitution that looked cheap in April is quietly repricing.
Market read: The Mosaic Company — MOS — Add — the acreage mix moves potash removal up and phosphate removal down, and Mosaic sits on both legs with potash still the cheaper nutrient on a year-over-year basis (+3%) against phosphates at +13%, giving it the better volume/price mix of the two.
5. The 2027 decision, and what reverses it
What's new: The 2026 shift plants a second, delayed nitrogen effect in 2027 — and simultaneously creates the conditions that pull acres back to corn.
Evidence: Corn following soybean requires less applied nitrogen than corn following corn. Nebraska Extension credits 45 lb N/acre on non-sandy soils (25 lb on sandy) where the prior soybean crop yielded above 30 bu/acre; Minnesota credits 30 lb N/acre to a subsequent corn crop; Wisconsin recommends a minimum 40 lb N/acre; Cornell's guidance is a 20–30 lb N/acre reduction in the economic optimum rate versus corn after corn (Nebraska CropWatch; UMN Extension; Cornell NMSP Fact Sheet 30). The mechanism is not fixation carryover but reduced immobilization — soybean residue's lower carbon-to-nitrogen ratio ties up less soil N as it decomposes.
Crop Root Zone estimate (assumptions: 4.2 million additional 2026 soybean acres return to corn in 2027, at a 40 lb N/acre rotation credit): that is roughly 168 million lb of N, or about 84,000 short tons, that 2027 corn does not need — call it another 0.5% of US nitrogen demand, arriving a year after the acreage decision that created it. Stacked with 2026's 220,000–320,000 tons, the two-year total is on the order of 300,000–400,000 short tons of N, still under 2.5% of annual US consumption.
Against that, the forces pulling acres back to corn are already visible. Iowa State's Estimated Costs of Crop Production in Iowa — 2026 raised estimated corn production cost 4% and soybean cost 2% year over year, with fertilizer and chemicals the main driver on corn, machinery up 3–4%, labor up 1%, and land cost slightly lower (Iowa State University Extension, Jan 29, 2026). That cost gap is what the 2026 shift was arbitraging — and it narrows mechanically as nitrogen retreats. Five straight weeks of softer retail nitrogen (urea −6%, anhydrous −6%, UAN28 −7%, UAN32 −7% month over month in the Jul 6–10 survey) is the first leg of that narrowing.
What would reverse the shift, concretely:
- Nitrogen retreating another 15–20% into the fall fill window. At $850/ton anhydrous the N-to-corn price ratio falls near 0.11, restoring the full 150 lb N/acre rate and cutting corn's fertilizer disadvantage by roughly $20/acre on the rate alone.
- Sulfur staying at $705/lt Tampa or higher. Record sulfur is a soybean-specific tax that the nitrogen-avoidance argument does not price.
- A corn price above $4.75–$5.00/bu on the new-crop board. At 183 bu/acre each dime is $18/acre of gross revenue, roughly two-thirds of a UAN32 rate increment.
- Potash firming. At +3% year over year it is the cheapest nutrient in the complex; a move toward $550/ton retail takes another $6–$8/acre out of the soybean case at 61 lb K2O/acre removal.
What would extend it: a further leg up in ammonia on gas or freight disruption, a bean price that holds near $11.40/bu season-average against a record crop, or another year of the phosphate strength that penalizes corn's heavier P2O5 removal.
Ground Truth: The single most useful thing in this data set is that the acreage swing and the nitrogen price are not on the same clock. Acreage responded in spring 2026 to input prices set in late 2025; the nitrogen market is now correcting after the acres were committed, and the rotation credit from those bean acres lands a full year later, in 2027 corn. That double lag is why the fall 2026 fill window is the asymmetric one: growers are buying nitrogen for a corn crop whose acreage decision has not been made, into a market that has already softened five weeks running but is still up 34% year over year on ammonia. Lock a portion of fall anhydrous now against a corn program you have not yet committed to, and let the rotation credit — not the acreage narrative — carry the rest of the rate reduction.
References
- USDA, World Agricultural Supply and Demand Estimates (WASDE), Jul 10, 2026 — https://www.usda.gov/oce/commodity/wasde/wasde0626v2.pdf
- Grain Journal, "USDA Leaves Soybean Outlook Largely Unchanged in July WASDE," Jul 10, 2026 — https://www.grainjournal.com/article/1147996/usda-leaves-soybean-outlook-largely-unchanged-in-july-wasde
- CBOT/CME Group futures settlements, Jul 16, 2026 (Sep '26 corn 441.50c; Dec '26 corn 464.00c; Aug '26 soybeans 1195.00c; Sep '26 soybeans 1185.25c).
- USDA NASS, Acreage report, Jun 30, 2026 — https://www.nass.usda.gov/Newsroom/2026/06-30-2026.php
- USDA NASS, Crop Progress (condition ratings, week ending Jun 8, 2026).
- DTN/Progressive Farmer, "UAN Fertilizers Lead Nutrient Prices," retail fertilizer survey week of Jul 6–10, 2026, published Jul 15, 2026 — https://www.dtnpf.com/agriculture/web/ag/crops/article/2026/07/15/uan-fertilizers-lead-nutrient-prices
- farmdoc daily (Monaco, Paulson, Schnitkey), "Trends in Fertilizer Use and Efficiency in the U.S.," University of Illinois, May 29, 2025 — https://farmdocdaily.illinois.edu/2025/05/trends-in-fertilizer-use-and-efficiency-in-the-us.html
- University of Minnesota Extension (Brad Carlson), "With high nitrogen fertilizer prices and low corn prices, can you decrease your nitrogen rate for 2026?", Oct 21, 2025 — https://blog-crop-news.extension.umn.edu/2025/10/with-high-nitrogen-fertilizer-prices.html
- farmdoc daily / University of Illinois, 2026 Illinois crop budgets (per-acre fertilizer cost, corn vs. soybeans) — https://farmdocdaily.illinois.edu/2025/08/2026-illinois-crop-budgets.html
- Michigan State University Extension, "Nutrient removal rates by grain crops," Jun 18, 2026 — https://www.canr.msu.edu/news/nutrient_removal_rates_by_grain_crops
- University of Illinois Extension, "Illinois Soybean Management" (P2O5/K2O removal coefficients), accessed Jul 2026 — https://extension.illinois.edu/sites/default/files/2026-02/accessibledocuments/illinois-soybean-management.pdf
- Pioneer Seeds Agronomy, "Soybean Nitrogen and Sulfur Uptake, Partitioning, and Removal," accessed Jul 20, 2026 — https://www.pioneer.com/us/agronomy/soybean-nitrogen-sulfur-uptake.html
- Argus Media, Q3 2026 Tampa molten sulfur contract settlement ($705/long tonne delivered), Jul 13, 2026.
- Trading Economics, sulfur (China spot) price series, Jul 20, 2026 — https://tradingeconomics.com/commodity/sulfur
- University of Nebraska–Lincoln CropWatch, "Giving Proper Nitrogen Credit for Legumes in Corn and Milo Rotations," accessed Jul 2026 — https://cropwatch.unl.edu/giving-proper-nitrogen-credit-legumes-corn-and-milo-rotations/
- Cornell University Nutrient Management Spear Program, Agronomy Fact Sheet 30, "Soybean N Credits" — http://nmsp.cals.cornell.edu/publications/factsheets/factsheet30.pdf
- Iowa State University Extension and Outreach, "2026 Iowa Crop Production Costs Increase, Limiting Profit Opportunities for Corn and Soybean Farmers" (Estimated Costs of Crop Production in Iowa — 2026, FM1712), Jan 29, 2026 — https://www.extension.iastate.edu/news/2026-iowa-crop-production-costs-increase-limiting-profit-opportunities-corn-and-soybean-farmers
Disclosures
Crop Root Zone is an independent publication. Nothing here is investment advice. Market calls, where included, reflect the editors' own read and are not a recommendation to buy or sell any security.
The $21 Line: What Custom Application Now Costs — and How Much of Anhydrous's Price Edge It Eats
Kansas custom applicators charged an average of $21.51/acre to knife in anhydrous in 2026 against $8.40 to spread dry — and that spread quietly claws back more than half of anhydrous's product-cost advantage as the cheapest nitrogen
Anhydrous ammonia is the cheapest nitrogen a US grower can buy, and every fertilizer conversation starts there — the product-cost gap to urea and UAN is wide and durable. But almost nobody carries the math one step further to the number that actually hits the field, which is the cost to apply it. In 2026 Kansas custom applicators charged an average of $21.51/acre to knife anhydrous into the ground, against just $8.40/acre to run a spinner spreader over dry fertilizer (Kansas Department of Agriculture / K-State, Kansas Custom Rates 2026) [1]. That $13/acre gap is not a rounding error. On a typical dryland-corn nitrogen rate it claws back more than half of anhydrous's celebrated product-cost advantage — and it is climbing, because the machinery and labor behind custom application are getting more expensive faster than the fertilizer is getting cheaper. The application line is the part of the nitrogen decision that the price-per-pound conversation skips, and in 2026 it is the part that moved.
1. The 2026 rate cards, and which direction they moved
What's new: Two of the most-watched extension custom-rate surveys published their 2026 editions, and both show application work rising. Iowa State's survey — 205 responses and 4,698 individual rates — reported increases across every category, ranging from 0.3% for machinery rental up to 8.5% for pre-harvest operations, the bucket that includes tillage, spraying, fertilizer application and planting (Iowa State University Extension, 2026 Iowa Farm Custom Rate Survey) [2]. Kansas's survey put the state-average dry-fertilizer application at $8.40/acre, up $0.81 (about 11%) from 2024, while liquid fertilizer application held roughly flat at $8.28/acre (Kansas Custom Rates 2026) [1].
Evidence: The headline numbers for the operations growers actually hire out:
| Operation (custom) | 2026 rate | Basis / change |
|---|---|---|
| Apply anhydrous ammonia (KS avg) | $21.51/acre | up YoY [1] |
| Spread dry fertilizer (KS avg) | $8.40/acre | +$0.81 vs 2024 [1] |
| Apply liquid fertilizer (KS avg) | $8.28/acre | −$0.09 vs 2024 [1] |
| Broadcast spray, self-propelled (KS avg) | $10.00/acre | range $6–16 [1] |
| Anhydrous injecting w/ toolbar (IA, 2024 base) | $15.10/acre | range $7–28 [3] |
| Iowa pre-harvest operations, all | — | +8.5% YoY [2] |
Source: Kansas Custom Rates 2026 [1]; Iowa State University Extension, 2026 Iowa Farm Custom Rate Survey [2]; 2024 Iowa Farm Custom Rate Survey (File A3-10) [3]. Iowa's 2026 edition added drone spraying and side-dressed anhydrous as newly surveyed operations [2].
That anhydrous costs far more to apply than dry or liquid is not surprising — it is a pressurized, hazardous gas that has to be knifed below the surface with a heavy toolbar, not thrown off a spinner — but the size of the gap is what growers under-count. At $21.51/acre in Kansas, applying anhydrous costs more than two and a half times what it costs to spread dry fertilizer.
Ground Truth: The direction is the story. In a year when the fertilizer product has fallen for six straight weeks at retail, the cost to apply it went up. Those two lines move on entirely different drivers — the product on global nitrogen supply, the application on machinery prices, diesel and skilled-operator wages — and in 2026 they moved in opposite directions. A grower modeling next year's nitrogen cost off the falling product price alone is going to under-budget the field, because the application half of the bill is on its own, rising track.
2. How much of anhydrous's edge the application line eats
What's new: Put the product cost and the application cost together and anhydrous's advantage shrinks in a way the price-per-pound comparison never shows. Anhydrous is still the cheapest all-in nitrogen — but by a lot less than the product gap implies.
Evidence: A Crop Root Zone calculation on stated assumptions, for a 143-lb-N/acre dryland-corn rate: anhydrous product at $0.59/lb N (DTN anhydrous $967/ton ÷ 1,640 lb N/ton) [4] plus Kansas custom application at $21.51/acre [1]; urea product at $0.74/lb N (DTN urea $682/ton ÷ 920 lb N/ton) [4] plus dry spread at $8.40/acre [1].
| 143 lb N/acre | Product cost | Application | All-in | $/lb N all-in |
|---|---|---|---|---|
| Anhydrous | $84.40 | $21.51 | $105.91 | $0.74 |
| Urea | $105.82 | $8.40 | $114.22 | $0.80 |
| Anhydrous advantage | $21.42 | −$13.11 | $8.31 | — |
Source: Crop Root Zone calculation; product prices DTN/Progressive Farmer, week of Jul 13–17, 2026 [4]; application rates Kansas Custom Rates 2026 [1]. Excludes hauling, nurse-tank logistics, and any product-price basis difference between wholesale and the assumed retail.
The product-cost gap between anhydrous and urea is $21.42/acre. The application gap runs the other way by $13.11/acre. Net it out and anhydrous's real, all-in advantage on this rate is about $8.31/acre — genuine, but roughly a third of what the product-only comparison advertises.
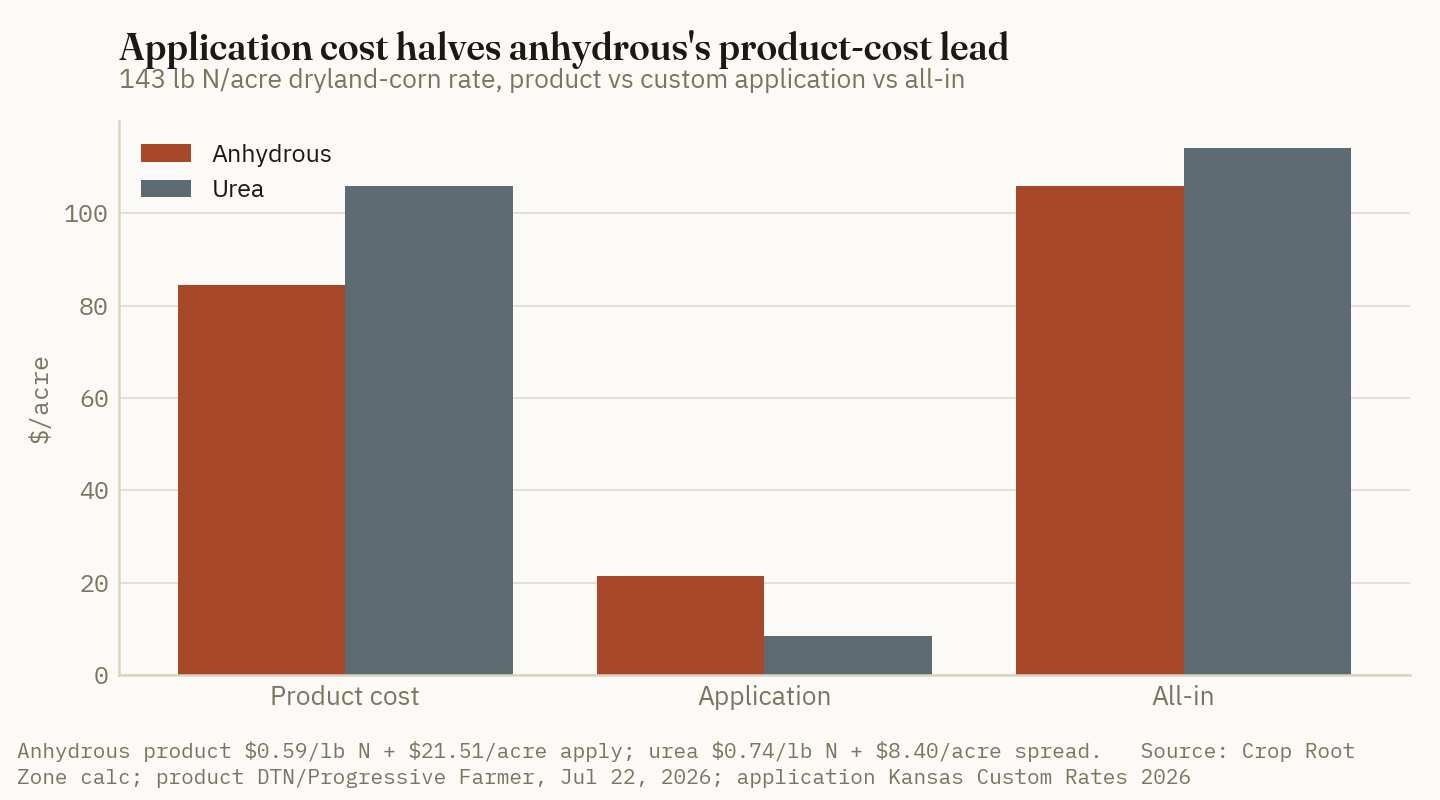
$13/acre
How much more Kansas custom applicators charge to apply anhydrous ($21.51) than to spread dry fertilizer ($8.40) in 2026 — the hidden offset against anhydrous's product-cost edge. (Kansas Custom Rates 2026 [1])
Ground Truth: Anhydrous is still the low-cost nitrogen, and this analysis does not say otherwise — it says the margin is thinner than the sticker implies, and thinning further. For a grower who owns the toolbar and applies their own anhydrous, the full product advantage is intact and the application line is a sunk-equipment question, not a check written to a custom operator. But for the rising share of operations that hire application out — because the applicator fleet is expensive to own and the skilled operators to run it are scarce — the decision between anhydrous and a spread dry product is closer than the fertilizer aisle suggests, and it turns on the application rate at least as much as the product price. Ask your custom operator for the 2026 anhydrous rate before you assume anhydrous wins.
Market read: DE — Hold — the same expensive, aging application-equipment fleet that is pushing custom rates up supports Deere's pricing power on new iron, but high machinery prices are precisely what push growers toward custom hire over ownership and toward demand destruction on replacement; the custom-rate squeeze cuts both ways for the equipment maker. Reflects the editors' read on the equipment economics, not a recommendation to buy or sell the security.
3. The average hides an enormous regional spread
What's new: A single state-average custom rate is nearly useless for a specific operation, because the dispersion around it is huge. The same Kansas survey that reports a $21.51 state-average anhydrous rate shows district figures ranging from under $10/acre to over $20/acre, and Iowa's anhydrous-injection range ran from $7 to $28/acre (Kansas Custom Rates 2026 [1]; 2024 Iowa survey [3]).
Evidence: The drivers of the spread are structural: applicator availability, haul distance from the nurse-tank fill point, field size and shape, and how thick the custom-operator market is in a given county. A grower in a district with one applicator serving a wide territory pays a scarcity premium a grower in a dense custom-operator market never sees.
| Anhydrous application | Low | Typical/avg | High |
|---|---|---|---|
| Kansas 2026, across districts | <$10 | $21.51 (state avg) | >$21 |
| Iowa 2024, reported range | $7 | $15.10 | $28 |
Source: Kansas Custom Rates 2026 [1]; 2024 Iowa Farm Custom Rate Survey [3]. Ranges are the reported low–high across responses; state averages are volume-unweighted survey means.
Here is the practical point as an inline scale — what the application line does to anhydrous's ~$21/acre product edge at different local application rates, on the 143-lb example:
| Local anhydrous apply rate | Anhydrous all-in edge vs urea | |
|---|---|---|
| $8/acre (dense market) | ~$21/acre kept | ██████████ |
| $15/acre (Iowa 2024 avg) | ~$14/acre kept | ███████ |
| $21.51/acre (KS 2026 avg) | ~$8/acre kept | ████ |
| $28/acre (high end) | ~$2/acre kept | █ |
Source: Crop Root Zone calculation on the Section 2 assumptions [1][4]; "edge kept" is anhydrous's all-in advantage over urea after each application rate, holding the dry-spread rate at $8.40.
Ground Truth: The regional dispersion means the anhydrous-versus-dry decision is not a national one — it is a county-level one, and it flips. Where custom anhydrous application runs $8–12/acre, anhydrous keeps nearly its full product advantage and is the obvious call. Where it runs $21–28/acre, the advantage is nearly gone and a spread dry program — often more flexible on timing and safer to handle — is competitive on cost and may win on convenience. The single most valuable number in this whole analysis is not a published state average; it is your own custom operator's 2026 quote, because it is the one that decides the case on your acres.
4. Why the application line keeps rising
What's new: The product price is cyclical and can fall hard, as it has in 2026. The application line is on a structural upward grind, and understanding why tells a grower which half of the nitrogen bill they can wait out and which half they cannot.
Evidence: Three forces sit under custom rates, and all three point up. Machinery is the first: high-clearance applicators and heavy anhydrous toolbars carry six-figure price tags, and the depreciation and interest on that iron is baked into every per-acre charge — Iowa's survey and trade coverage both tie rising custom rates to equipment ownership costs and diesel (Iowa State University Extension [2]; Farm Progress custom-rate coverage [5]). Labor is the second: skilled seasonal applicators are scarce, and the wage to keep one is not falling. Fuel is the third and most cyclical, but even a soft diesel year does not reverse the first two. Iowa's decision to newly survey drone spraying and side-dressed anhydrous in 2026 [2] is itself a signal — the custom-application market is adding higher-tech, higher-cost services, not cheaper ones.
Ground Truth: Separate the two halves of the nitrogen bill and manage them differently. The product half is cyclical — you can time it, wait out a spike, prepay a dip, play the retail-versus-wholesale lag. The application half is structural and sticky — it rose in 2026 while the product fell, and it will not give the timing opportunities the product does. For growers hiring the work out, that argues for locking application capacity and rate early with a trusted operator rather than assuming a competitive spot market will be there at planting, and for taking a hard look at whether owning application equipment — or splitting the cost through a machinery-sharing arrangement — pencils better than a rising annual custom check. The fertilizer will get cheap again on its own schedule. The application won't.
References
- Kansas Department of Agriculture and Kansas State University, Kansas Custom Rates 2026 — 2026, https://www.agmanager.info/sites/default/files/pdf/CustomRates_2026.pdf
- Iowa State University Extension and Outreach, "2026 Iowa Farm Custom Rate Survey Offers Planning Guidance for Iowa Producers" — Mar 2026, https://www.extension.iastate.edu/news/2026-iowa-farm-custom-rate-survey-offers-planning-guidance-iowa-producers
- Iowa State University Extension and Outreach, Iowa Farm Custom Rate Survey (File A3-10) — 2024 edition baseline, https://crops.extension.iastate.edu/files/inline-files/a3-10.pdf
- DTN/Progressive Farmer, "Fertilizer Prices Continue Downward Trend" — retail fertilizer survey, week of Jul 13–17, 2026, published Jul 22, 2026, https://www.dtnpf.com/agriculture/web/ag/crops/article/2026/07/22/fertilizer-prices-continue-downward
- Farm Progress, "What you need to know about rising custom rates" — accessed Jul 2026, https://www.farmprogress.com/farm-operations/what-you-need-to-know-about-rising-custom-rates
Disclosures
Crop Root Zone is an independent publication. Nothing here is investment advice. Market calls, where included, reflect the editors' own read and are not a recommendation to buy or sell any security.
16 Billion Bushels Need Somewhere to Go: On-Farm Storage Economics Into the 2026 Harvest
A record corn crop is landing on a storage system that stopped growing — surplus capacity is down to 5% and harvest basis has widened past $1.50 under. Storage just became a margin input, and the build-rent-sell math is running against a hard fall deadline.
USDA's July WASDE forecast a record 16.0-billion-bushel corn crop for 2026/27 (USDA WASDE, Jul 2026), and it is arriving into a storage system that has quietly stopped expanding. National grain storage capacity is estimated near 25.5 billion bushels, but once you subtract the soybeans, wheat, sorghum and carry-in stocks competing for the same space, the surplus capacity above total production has compressed to roughly 5% — the tightest in more than two decades and a third of the 15% cushion that prevailed for most of this century (farmdoc daily; American Farm Bureau Federation, 2026). The consequence is already showing up where it always does first: basis. At the most pressured elevators, harvest corn bids have been reported more than $1.50 under the board (AFBF Market Intel, 2026). Storage stopped being a convenience this year and became a line item in the margin.
1. The capacity wall a record crop is hitting
What's new: The crop set a record while storage capacity flatlined, so the surplus space that normally absorbs a big harvest is nearly gone.
Evidence: The arithmetic of the squeeze:
| Measure | Figure | Basis |
|---|---|---|
| 2026/27 corn production | 16.0 bil bu | USDA WASDE, Jul 2026 |
| US grain storage capacity | ~25.5 bil bu | All grains, on- + off-farm |
| Surplus capacity above production | ~5% | Down from ~15% avg since 2000 |
| On-farm capacity utilized (Dec 1, 2025) | ~80% | Major crops |
Source: USDA WASDE, Jul 2026; farmdoc daily, "US Grain Storage Capacity Growth Has Stopped," Feb 2026; American Farm Bureau Federation, Market Intel, 2026.
Capacity growth has genuinely stalled — the farmdoc analysis title is literal, not rhetorical. Steel, concrete and construction-labor costs rose through the high-price years, and the return on a new bin looked thin when basis was narrow and carry was small. That underinvestment is now colliding with a record crop. When production plus carry-in stocks approaches total capacity, the marginal bushel has no home except the ground, a bag, or a distress sale at the elevator — and the elevator, knowing the grower is out of options, sets its bid accordingly.
5%
Surplus grain storage capacity above production for 2026 — down from the ~15% cushion that held for most of the century, and the mechanism turning a record crop into a widening harvest basis. (American Farm Bureau Federation / farmdoc daily, 2026)
Ground Truth: A 5% surplus-capacity cushion is not a storage statistic — it is a basis forecast. It says the elevator holds the leverage this harvest, and the grower without owned space is the price-taker of last resort. The number to watch is not the futures board, which the WASDE already told you is holding $4.40 corn; it is your local basis, because that is where the storage shortage is being priced, and it is the part of the $4.40 a short-storage operation gives back.
2. What it costs to carry a bushel to spring
What's new: The decision to store is really a decision to spend a known cost now — drying, shrink, interest, and bin operation — to capture an uncertain basis and carry appreciation later.
Evidence: On-farm storage runs an all-in operating cost of roughly $0.03–0.06 per bushel per month once drying, aeration power, shrink, labor and bin upkeep are counted, before the interest cost of unsold grain (university storage-cost work, 2026). Drying is the front-loaded piece: with propane near $2 per gallon, removing moisture costs on the order of 3 cents per bushel per point, so pulling corn from 20% down to 15% is about $0.15 per bushel in fuel alone (Harvest Profit; extension drying-cost work, 2026). Assemble the stack for carrying corn from October to a May sale:
| Cost to carry corn Oct → May | $/bu (illustrative*) | |
|---|---|---|
| Drying (5 points @ ~$0.03/pt) | 0.15 | ██████ |
| Storage operation (7 mo @ ~$0.045) | 0.32 | █████████████ |
| Interest on unsold grain (7 mo)* | 0.13 | █████ |
| Total carry | ≈ 0.60 | ████████████████████████ |
*Illustrative on-farm cost stack. Operating and drying ranges are sourced (extension/Harvest Profit, 2026); the interest line is an estimate at roughly 8% on ~$4.40 grain for seven months and will vary with rate and price. Bars scaled to total = 24.
Against that ~$0.60 carry, the grower is trying to capture two things: the recovery of a harvest basis that is $1.50-plus under at the worst elevators, and the futures carry from the October contract to the deferred. The point of the exercise is not that storage always wins — it is that the cost of storing is knowable and the harvest basis is observable, so the trade can be evaluated rather than guessed. When the harvest basis is abnormally wide, as it is this year, the basis-recovery half of the return is unusually large — which is precisely the condition under which paying $0.60 to carry is worth it.
Ground Truth: Storage is a spread trade, and this year the spread is being handed to whoever owns a bin. If the harvest basis is $1.50 under and normalizes to $0.40 under by spring, that is $1.10 of basis recovery against roughly $0.60 of carry cost — a net worth capturing that has nothing to do with predicting the futures price. The grower who can store is being paid to arbitrage the elevator's harvest leverage; the grower who can't is the counterparty on the other side of that trade.
3. Build, rent, or sell — the three-way decision
What's new: With owned space scarce, the choice narrows to building capacity that outlives this crop, renting commercial space that eats the recovery, or selling into the harvest low.
Evidence: Building is a long-horizon commitment at a steep number. Erecting a workable grain center from scratch — bin, aeration, drying, legs, concrete, electrical and site work — runs on the order of $9–10 per bushel of capacity, with mid-size bins holding 20,000–60,000 bushels each (Farm Progress; agri-industry cost guides, 2026). At $9/bu, a 50,000-bushel setup is roughly $450,000 in capital before it stores its first load:
| Option | Cost | What you get | |
|---|---|---|---|
| Build on-farm (new) | ~$9–10/bu capacity | Permanent capacity, ~$0.60/bu carry | ██████████ (capital) |
| Rent commercial storage | ~$0.05–0.08/bu/mo + fees | Space now, thinner net recovery | ███ (per-year) |
| Sell at harvest | $0 | Widest basis of the year | `` (no cost, no recovery) |
Source: build cost — Farm Progress / agri-systems cost guides, 2026; commercial rates — representative elevator storage and drying schedules, 2026; illustrative.
A new bin does not pencil on one wide-basis harvest. At $9/bu of capital, the structure has to earn its return across a decade of harvests, and the case for it rests on a view that tight storage and wide harvest basis are becoming structural — that capacity growth has stopped while crops keep setting records. The renting option captures the basis recovery this year but hands a chunk of it to the commercial operator through storage and drying fees, and space itself may be scarce when everyone needs it at once. Selling at harvest is the zero-cost option that also captures zero recovery — and this year, in a $1.50-under basis, it locks in the worst price of the marketing year.
Ground Truth: The build-versus-rent-versus-sell decision should not be made on this harvest alone, but this harvest is the clearest data point in a decade for the structural case. Capacity growth has stopped, crops keep breaking records, and the surplus cushion is at 5%. If that is the new normal rather than a one-year event, a $9/bu bin is buying a widening harvest basis you will otherwise pay every single fall. The grower doing this math should price the bin against ten years of $1.00-plus basis recovery, not one — and should note that the same steel-cost inflation that stalled national capacity is also what makes the bin expensive to build.
4. Storage sits in the same capital line as the fertilizer savings
What's new: The nitrogen relief showing up in the 2027 budget and the storage shortfall showing up at harvest are competing for the same farm capital — and the storage side may have the higher return this year.
Evidence: Retail nitrogen has fallen for a sixth straight week, with anhydrous down 11% in a month (DTN/Progressive Farmer, Jul 22, 2026), freeing perhaps $12–18 per corn acre in the coming budget (see our July WASDE margin analysis). That saving is real, but it is a per-acre operating trim. A wide harvest basis on a record crop is a per-bushel margin event, and on a high-yield corn farm the bushels are the bigger number: 226 bushels an acre times $1.00 of avoidable basis is $226 per acre of value at stake in the storage decision — an order of magnitude larger than the nitrogen line.
The two decisions are linked through the balance sheet. Capital spent on a bin is capital not spent on prepaying inputs, cash rent, or land; capital freed by cheaper nitrogen is capital that could fund storage. In a year when the fertilizer headline is relief and the grain headline is a storage crunch, the operation that routes some of the input savings toward defending the harvest basis is playing the larger of the two margins.
Ground Truth: Do not let the fertilizer relief become the whole 2027 capital story. The nitrogen savings is a real but modest per-acre trim; the harvest-basis exposure on a record crop is a per-bushel event several times larger. The grower who banks the anhydrous savings and then sells a record crop into a $1.50-under basis has optimized the small line and surrendered the big one. Storage is not a grain-marketing footnote this year — it is where the 2026 margin is won or lost, and it belongs in the capital conversation alongside every input decision.
References
- USDA World Agricultural Supply and Demand Estimates (WASDE), July 2026 — 2026/27 corn production. https://www.usda.gov/oce/commodity/wasde
- farmdoc daily (University of Illinois), "US Grain Storage Capacity Growth Has Stopped" — Feb 2026. https://farmdocdaily.illinois.edu/2026/02/us-grain-storage-capacity-growth-has-stopped.html
- American Farm Bureau Federation, Market Intel, "Grain Storage Remains Tight" — 2026. https://www.fb.org/market-intel/grain-storage-remains-tight
- Harvest Profit, "Cost of On-Farm vs. Commercial Grain Drying" — accessed Jul 2026. https://www.harvestprofit.com/blog/cost-of-on-farm-vs-commercial-grain-drying
- Farm Progress, "What will a new grain bin cost?" and agri-systems bin cost guides — 2026. https://www.farmprogress.com/crops/what-will-a-new-grain-bin-cost-
- DTN/Progressive Farmer, "Fertilizer Prices Continue Downward Trend" — Jul 22, 2026. https://www.dtnpf.com/agriculture/web/ag/crops/article/2026/07/22/fertilizer-prices-continue-downward
Disclosures
Crop Root Zone is an independent publication. Nothing here is investment advice. Market calls, where included, reflect the editors' own read and are not a recommendation to buy or sell any security.
$232 for the Same Ton: What Regional Fertilizer Spreads Actually Measure
USDA's July 10 distributor reports show AMS 42% dearer in the Pacific Northwest than Oklahoma and urea 60% dearer — while DAP varies by 4%. Freight cannot explain that pattern. Inventory vintage can.
For the week ending July 10, 2026, USDA's Agricultural Marketing Service published distributor "ask" prices for ammonium sulfate in three regions: $553.75 per ton average in Oklahoma, $644.67 in North Carolina and $786.00 in the Pacific Northwest. Same product, same grade, same week, a $232.25 spread — 42%. Urea in the same three reports ran $686.71, $897.50 and $1,099.80, a $413.09 spread, or 60%. But diammonium phosphate — the highest-value ton of the three — came in at $950.56 in Oklahoma and $987.50 in North Carolina, a gap of $36.94, under 4%. Three products, one week, and the dispersion ranges from 4% to 60%. Whatever is producing that pattern, it is not distance.
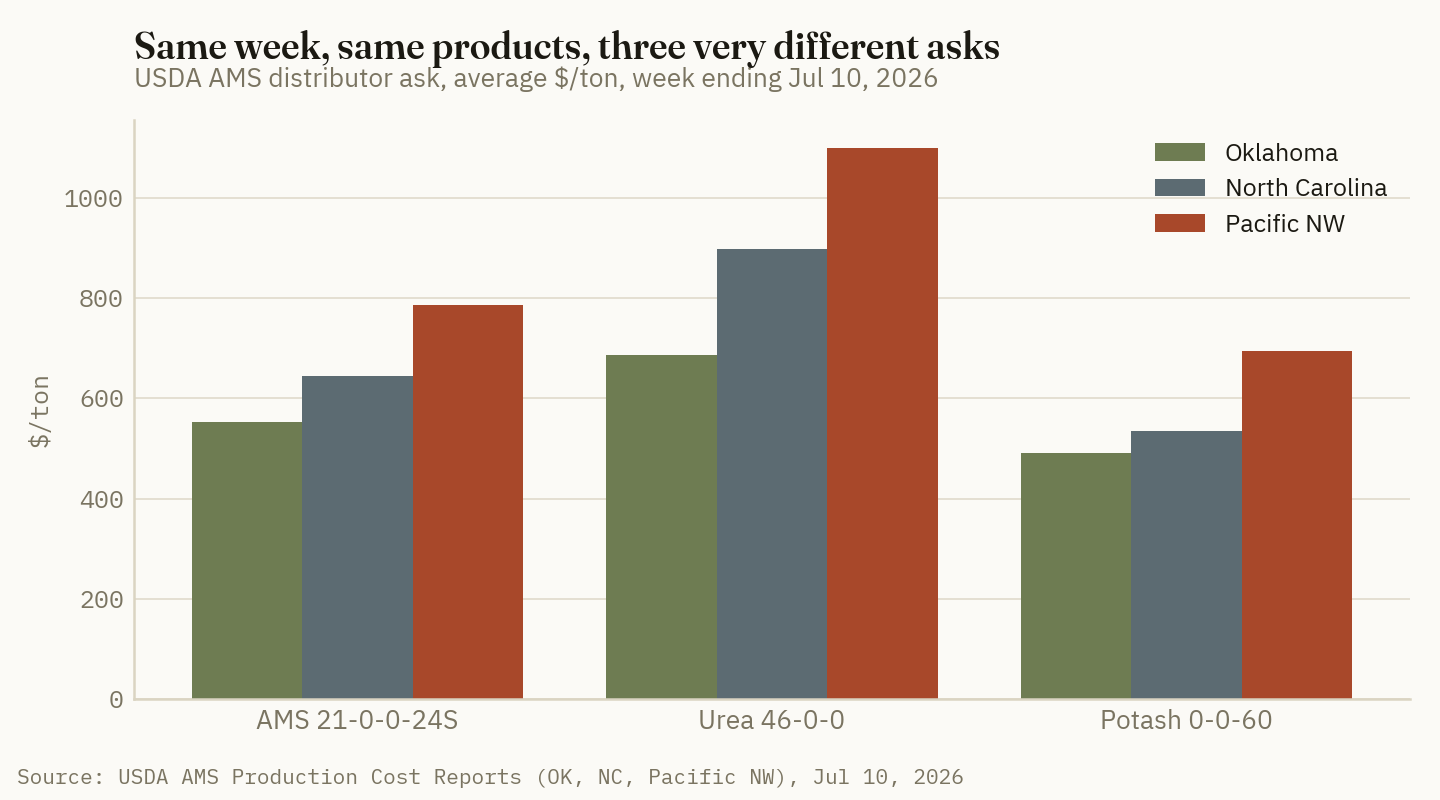
1. The same week, the same products, four sets of numbers
What's new: USDA AMS publishes regional production cost reports on staggered weekly and bi-weekly cycles, and reading four of them side by side turns a set of local price quotes into a national dispersion measurement. It is one of the few genuinely free, genuinely current, apples-to-apples fertilizer datasets available to a buyer.
Evidence: Distributor asks, dollars per ton, week ending July 10, 2026 unless noted (USDA AMS Livestock, Poultry & Grain Market News):
| Product | Oklahoma | North Carolina | Pacific NW | Alabama (Jul 17) | S. Carolina (Jun 26) | Spread |
|---|---|---|---|---|---|---|
| Ammonium sulfate 21-0-0-24S | 553.75 | 644.67 | 786.00 | — | 533.33 | $232 |
| Urea 46-0-0 | 686.71 | 897.50 | 1,099.80 | 809.40 | 745.00 | $413 |
| Potash red 0-0-60 | 490.80 | 535.00 | 694.00 | 529.20 | 466.67 | $203 |
| DAP 18-46-0 | 950.56 | 987.50 | — | 956.83 | 893.33 | $37 |
Distributor "ask" averages, $/ton. Reported low–high ranges behind those averages: AMS $460–595 (OK), $585–684 (NC), $600–1,110 (PNW); urea $520–885 (OK), $825–970 (NC), $875–1,350 (PNW); potash $460–550 (OK), $480–595 (NC), $565–830 (PNW); DAP $820–1,104 (OK), $885–1,090 (NC).
Source: USDA AMS Livestock, Poultry & Grain Market News, regional Production Cost Reports, weeks ending Jun 26 / Jul 10 / Jul 17, 2026. Spread column compares the three same-week (Jul 10) regions only and is a Crop Root Zone calculation.
$232.25
The gap between the highest and lowest regional distributor ask for one ton of ammonium sulfate — same product, same grade, same week. (USDA AMS Production Cost Reports, Jul 10, 2026)
Oklahoma and PNW asks are F.O.B.; South Carolina's are delivered — a basis difference that widens rather than narrows the underlying gap, since the higher-priced regions here are quoting F.O.B.
Two further prints from the Oklahoma report deserve a moment because they rarely appear in public: anhydrous ammonia at $976.00/ton ($900–1,075), against DTN's national retail average of $1,032 for the same period, and ammonium thiosulfate at $425.00/ton ($370–480) — one of the very few publicly posted ATS quotes anywhere in the market.
Ground Truth: The most useful thing in these reports is not any single price — it is that DAP's dispersion (4%) and urea's dispersion (60%) were measured the same week by the same agency using the same method. That rules out survey artifact as the explanation and forces the question onto the products themselves. Any buyer explaining their local price with "we're far from the river" needs to explain why the phosphate on the same pad, hauled on the same truck, does not show the same penalty.
2. The freight explanation fails the arithmetic
What's new: Freight is the reflexive explanation for regional fertilizer spreads. Run the numbers and it accounts for well under a third of the observed gap.
Evidence: Start with fuel, which is the part the same reports let us price directly. Farm diesel in the July 10 PNW report ran $4.67/gal delivered ($3.90–5.40) against $3.81 in Oklahoma ($3.54–4.05) and $3.72 in North Carolina ($3.10–3.96) — a PNW premium of about $0.86/gal.
Crop Root Zone estimate: a 25-ton dry bulk load running a 300-mile inland leg covers roughly 600 miles round trip; at about 6 mpg that is ~100 gallons, so the fuel-price differential alone adds roughly $86 per load — about $3.44 per ton. Even at a punishing 600-mile one-way haul the differential contributes under $7 per ton.
Total freight, not just the differential, is larger but still insufficient. At an indicative dry bulk trucking cost of $0.16–0.20 per ton-mile (our estimate, derived from typical loaded-mile rates on 25-ton loads), a 300-mile inland leg runs roughly $48–60 per ton. That is a real cost. It is also, at most, about a quarter of the $232/ton AMS gap and an eighth of the $413/ton urea gap.
And freight cannot explain the DAP result at all. A truck hauling 18-46-0 from a terminal to a blend plant charges by weight, not by nutrient value — so if freight were the dominant variable, DAP should show a spread in dollars similar to urea's and a smaller spread in percent. Instead DAP's dollar spread is $37 against urea's $413. Freight is not selective by product. Something else is.
Ground Truth: Freight sets the floor under regional dispersion, not the level of it. Roughly $50–60/ton of the AMS gap is genuinely the cost of moving a ton inland from tidewater or a river terminal; the remaining $170-odd is discretionary — inventory position, purchase timing, storage capacity and margin. That distinction matters because only the first part is fixed. The second part is negotiable, and a buyer who treats the whole spread as geography never asks.
3. What actually disperses: inventory vintage
What's new: Rank the four products by how much their wholesale price has moved this quarter, and the ranking reproduces the dispersion ranking almost exactly.
Evidence: Urea is the product that moved. NOLA barges went from roughly $782/t in April to about $350/t in late June, more than 55%, before recovering to $421.50 on July 20 (Fertilizer Daily, Jun 24, 2026; Trading Economics, Jul 20, 2026). Urea shows the widest distributor dispersion in the AMS reports: 60%.
DAP is the product that did not move. DTN's July 6–10 retail survey had DAP at $912/ton, +0.3% month over month — essentially flat, even while up 13% year over year. DAP shows the narrowest dispersion: 4%.
Ammonium sulfate sits between the two, and so does its dispersion at 42% — consistent with a product whose nitrogen leg has been falling while its sulfur leg is at records, with the Q3 2026 Tampa molten sulfur contract settling at $705 per long ton (Argus, Jul 13, 2026).
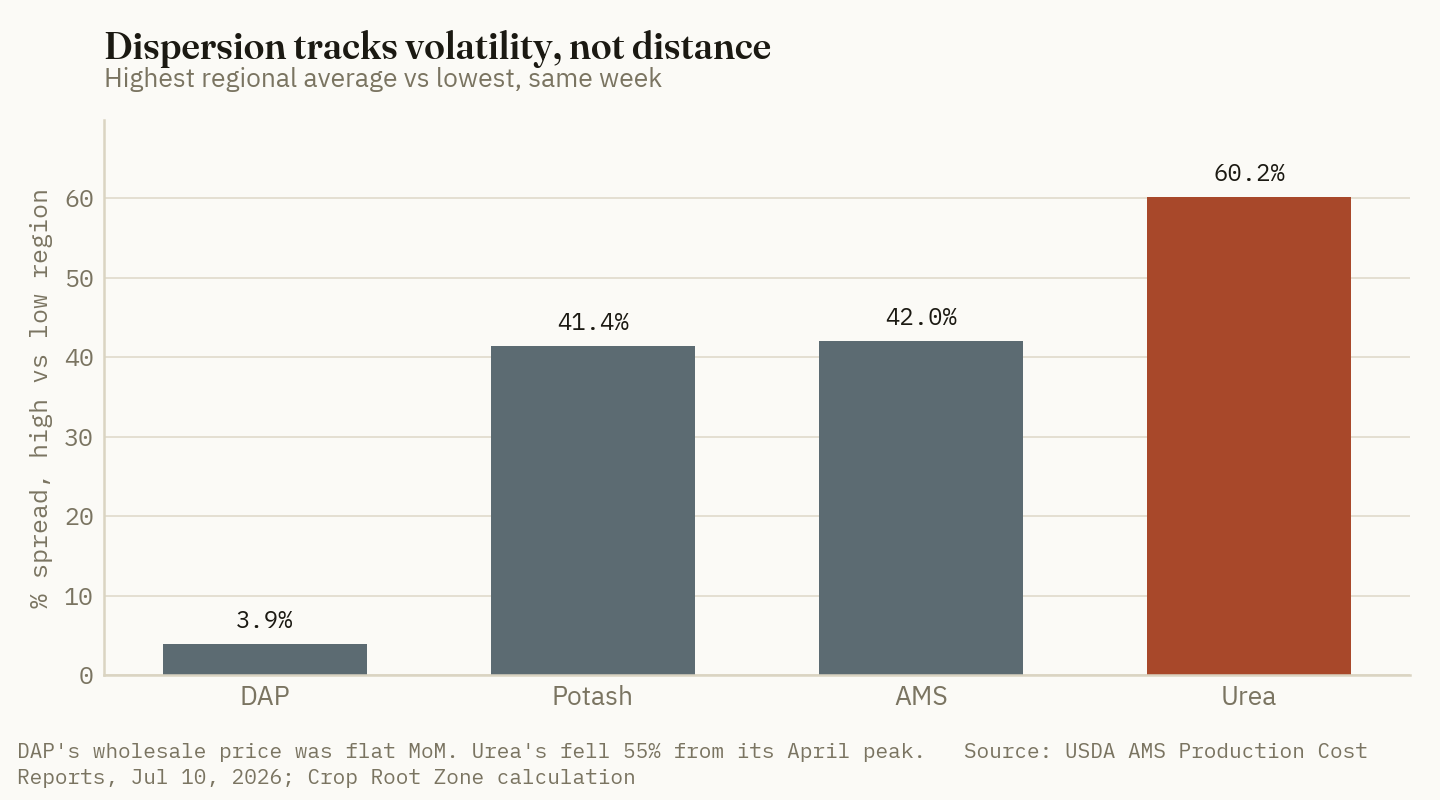
The mechanism is straightforward once stated. A distributor's ask is a function of what they paid, not of what the barge costs today. In a market that has fallen 55% in a quarter, two distributors 50 miles apart can be sitting on tons bought four months apart at prices that differ by hundreds of dollars, and both will quote their own carrying cost plus a margin. In a market that has been flat, every distributor paid roughly the same thing and every ask converges.
Ground Truth: Price dispersion in a falling market is a measurement of inventory vintage, not of geography — and that is a testable claim, not a metaphor. The prediction it makes is specific: as urea's wholesale price stabilizes near the forward curve over the next two quarters, the urea dispersion in these same USDA reports should compress toward DAP's, without a single mile of freight changing. If it does not compress, the geography explanation survives. If it does, the buyer's question was never "where am I" but "when did my supplier buy."
4. The within-region range is the bigger number
What's new: The most striking figure in the July 10 reports is not the spread between regions. It is the spread inside one.
Evidence: Pacific Northwest ammonium sulfate was quoted at $600 to $1,110 per ton — a $510 range within a single reporting region, more than double the $232 gap between the PNW and Oklahoma averages. PNW urea ran $875 to $1,350, a $475 internal range against a $413 between-region spread. Oklahoma urea ran $520–885, a $365 range.
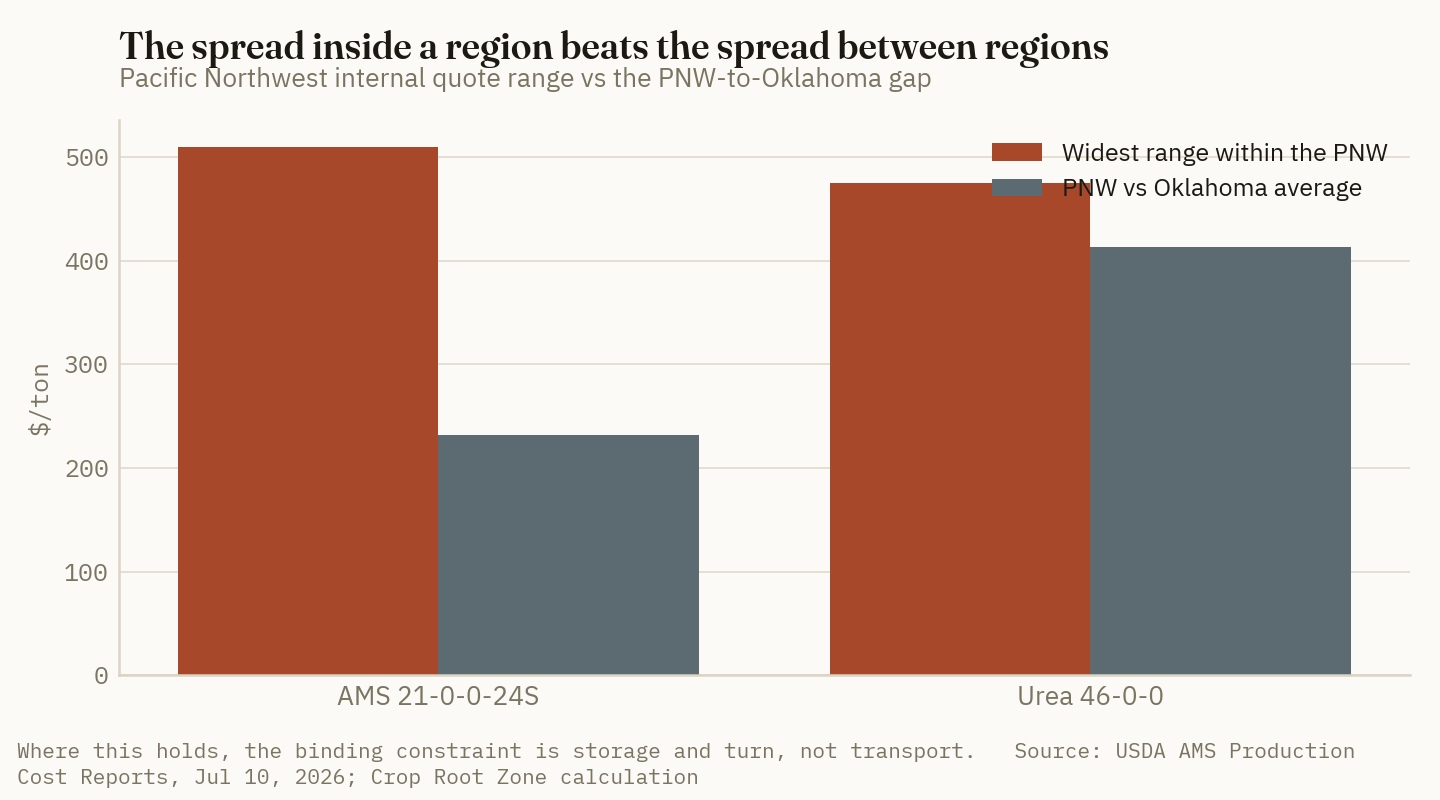
Contrast North Carolina, where the internal ranges are tight: AMS $585–684 (a $99 range) and urea $825–970 ($145).
A grower in the Columbia Basin can therefore face a larger price difference between two suppliers in the same valley than between their valley and Oklahoma. And notice which region is tight and which is loose: the internal range widens where the region's own supply chain is longest and its storage most constrained, because that is where a distributor's individual purchase timing has the most room to diverge from a neighbor's.
Ground Truth: When the within-region range exceeds the between-region spread, the binding infrastructure constraint is storage and turn, not transport — and the return on adding storage is highest exactly where that condition holds. That is the honest capital case for on-farm or retail bin capacity in the Pacific Northwest right now, and it is a materially weaker case in the Carolinas, where the internal ranges are a fifth as wide. The same $500,000 dry bin earns a very different return depending on which of those two dispersion patterns a buyer is standing in.
5. What a buyer does with this
What's new: These reports are free, weekly, and almost nobody outside the trade reads them. Used systematically they replace anecdote with a basis series.
Evidence: Three uses stand out, in ascending order of value.
Bound the negotiation. A distributor quoting the top of their region's published range is quoting a number USDA has already recorded as the regional high. That is not an accusation — a distributor at the top of the range may simply have bought late — but it converts "that seems high" into "the July 10 report has this region at $460 to $595."
Track your own basis, not the national average. The gap between a local ask and the NOLA barge is the number a buyer can actually influence. Our earlier estimate put roughly $305 per short ton between a $421.50/t NOLA urea barge and Oklahoma's $686.71 distributor ask — freight, terminal, storage, financing and margin, stacked. Watching that stack widen or compress week to week is more informative than watching the barge.
Time the purchase against the vintage effect. If dispersion is vintage, then the best time to shop aggressively across suppliers is precisely when the wholesale market has just moved hard — which is now for nitrogen and is emphatically not now for phosphate. Shopping four DAP quotes in a week when DAP dispersion is 4% is a poor use of a morning. Shopping four urea quotes when dispersion is 60% is worth several thousand dollars on a semi-load.
Ground Truth: Shop the products that are dispersed, and accept the posted price on the ones that are not. That sounds trivial and it is the opposite of what most buying programs do — they apply uniform quote-collection effort to every line on the blend sheet. The USDA reports tell a buyer, for free and in advance, which lines have $400 of variance in them and which have $37. Effort should follow the variance.
References
- USDA AMS Livestock, Poultry & Grain Market News — Oklahoma Production Cost Report (bi-weekly), week ending Jul 10, 2026. https://mymarketnews.ams.usda.gov/viewReport/3621
- USDA AMS — North Carolina Production Cost Report (weekly), week ending Jul 10, 2026. https://mymarketnews.ams.usda.gov/viewReport/3159
- USDA AMS — Pacific Northwest Production Cost Report (bi-weekly), week ending Jul 10, 2026. https://mymarketnews.ams.usda.gov/viewReport/3657
- USDA AMS — Alabama Production Cost Report (weekly), week ending Jul 17, 2026. https://mymarketnews.ams.usda.gov/viewReport/3051
- USDA AMS — South Carolina Crop Production Report (monthly), week ending Jun 26, 2026. https://mymarketnews.ams.usda.gov/viewReport/2789
- DTN/Progressive Farmer, "UAN Fertilizers Lead Nutrient Prices Downward" (retail survey, week of Jul 6–10, 2026) — Jul 15, 2026. https://www.dtnpf.com/agriculture/web/ag/crops/article/2026/07/15/uan-fertilizers-lead-nutrient-prices
- Fertilizer Daily, "StoneX: urea could drop another $30–50/t before recovering…" — Jun 24, 2026. https://www.fertilizerdaily.com/20260624-stonex-urea-could-drop-another-30-50t-before-recovering-but-h2-demand-will-pay-for-the-lost-tonnes/
- Trading Economics, Urea commodity price — accessed Jul 20, 2026. https://tradingeconomics.com/commodity/urea
- Argus Media, Q3 2026 Tampa molten sulfur contract settlement, $705/lt delivered — Jul 13, 2026.
Disclosures
Crop Root Zone is an independent publication. Nothing here is investment advice. Market calls, where included, reflect the editors' own read and are not a recommendation to buy or sell any security.
Prepay Is a Short Put: What On-Farm Storage Is Actually Worth in a Split Nutrient Market
Summer-fill discounts of 3-5% don't cover 7% money plus the annualized cost of the building it sits in — and nitrogen is falling while sulfur runs
Retail nitrogen has now fallen for five consecutive weeks. DTN's survey for the week of July 6-10 put urea at $714 a ton, down 6% month over month; anhydrous at $1,032, also down 6%; UAN28 at $493 and UAN32 at $529, both down 7% (DTN/Progressive Farmer, Jul 15, 2026). The sulfur complex went the other way: the Q3 2026 Tampa molten sulfur contract settled at a record $705 per long tonne delivered, up 8% from Q2's $655 and 42% from Q1's $495.69 (Argus Media, Jul 13, 2026). Into that split arrive the fall-fill and prepay offers. They are not discounts. They are options — a fixed strike on a commodity, bundled with a lease on the balance sheet and the building that carry it — and on nitrogen, at current numbers, the grower is on the wrong side of the trade.
1. What a ton of on-farm storage costs to build
What's new: The industry's dedicated builders — Stueve Construction, which claims more than 1,400 fertilizer projects from 500 to 100,000+ tons, and Greystone Construction, which quotes the same range — publish no per-ton pricing at all (company websites, accessed Jul 20, 2026). That silence is a finding: dry fertilizer storage is quoted per project, because the corrosion package, the pad, the reclaim conveyor and the load-out dominate the number, not the square footage.
Evidence: The public data points that exist are anecdotal and should be treated that way. Growers on the AgTalk trade forum report a roughly 150-ton dry shed with a 30-foot belt conveyor built for under $30,000 — under $200 per ton of capacity — and Saskatchewan fertilizer hopper bins at roughly CAD 15,000 per 100 tonnes (AgTalk grower forum threads, undated). For a floor reference, farm grain bins ran $2.00 to $4.50 per bushel in extension interviews as of October 2025 (industry price guides, 2026). Crop Root Zone estimate: converting that band at an assumed 55 lb/ft³ bulk density — midway between urea at ~46 and potash at ~65, or 29.2 bushel-volumes per short ton — gives $58 to $131 per ton for uncoated steel with no corrosion protection. A floor, not a quote: fertilizer-service steel and an impervious floor push a real build toward the $200 figure and above.
Liquid is worse per ton, because the product is heavy and the tank is only half the job. A Norwesco 15,000-gallon vertical poly fertilizer tank lists at $21,299.99 and a 20,000-gallon at $34,799.99 — $1.42 and $1.74 per gallon (Plastic-Mart listed pricing, accessed Jul 20, 2026). UAN32 weighs 11.06 lb/gal, or 180.8 gallons per short ton (Mississippi State Extension, Fluid Fertilizers), so the 15,000-gallon tank holds 83.0 tons and the bare vessel runs $257 per ton of capacity before a yard of concrete. Purdue's engineering costing for on-farm fluid containment — still the cleanest published breakdown of the structure, though the dollars are old — put dike construction at $6,324 and a load/unload pad at $1,473 for a 6,000-gallon installation, and total containment investment at $9,712 for a 10,000-gallon tank (Rogers & Akridge, Purdue PAER-1992-7, Jun 16, 1992). Crop Root Zone estimate: inflated roughly 2.2-2.5x on a general price basis, that package is on the order of $21,000-$24,000 in 2026 dollars — a floor, since non-residential construction has outrun general inflation. Stack it on the vessel and an installed 15,000-gallon UAN system lands near $520 per ton of UAN32 capacity (Crop Root Zone estimate; one tank, one dike, one pad, plumbing and freight, no scale or blending).
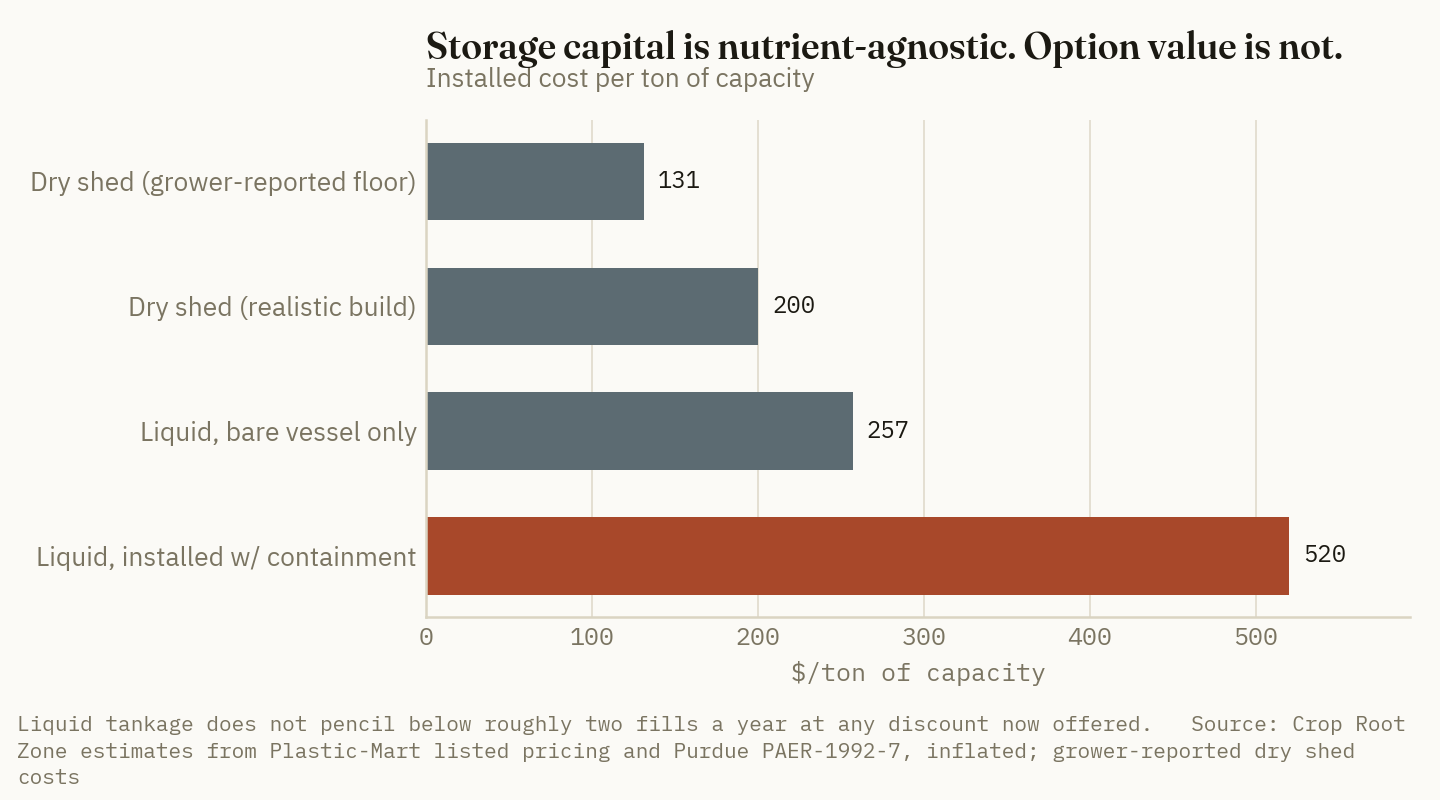
Ground Truth: Storage capital is nutrient-agnostic; option value is not. A grower sizing tankage off this year's UAN prepay offer is capitalizing a 20-year asset against the one nutrient where holding inventory currently destroys value. Size liquid tankage to the sulfur and micronutrient program — which needs it and rewards it — and let the nitrogen ride in the retailer's tank until the offer is worth taking.
2. The carry: interest first, then shrink, then the regulator
What's new: Money is the largest single line and it is no longer cheap. Kansas City Fed's Survey of Terms of Lending to Farmers put the Q2 2026 average rate on farm operating loans above $100,000 at slightly under 7%, with smaller loans slightly above 7% (Federal Reserve Bank of Kansas City, Agricultural Finance Update, Q2 2026). Bank prime stood at 6.75%, federal funds at 3.50-3.75% (Federal Reserve H.15, Jul 17, 2026).
Evidence: At 7% APR, a five-month hold from an August 1 summer fill to a January 1 draw costs 2.92% of invoice value in interest alone — $20.83 per ton on $714 urea, $30.10 on $1,032 anhydrous, $15.43 on $529 UAN32 (Crop Root Zone calculation; simple interest, 7% APR, 5/12 year, DTN Jul 15, 2026 prices). Annualized capital recovery on the building is the second line. Crop Root Zone estimate: at $200 per ton installed, a 20-year life and 7% capital, the capital recovery factor is 0.0944 — $18.88 per ton-year, plus ~1.5% of capital for insurance, maintenance and tax, or about $22 per ton-year of dry capacity: $22 per ton stored at one turn a year, $11 at two. Liquid at $520 per ton of capacity annualizes to roughly $57 per ton-year — 10.8% of a $529 UAN32 ton at one fill, 3.6% at three.
Shrink is the line nobody prints. Urea's critical relative humidity is roughly 73% at 30°C — above it, prills absorb moisture, dissolve at the surface and reform as cake — and guidance is to hold storage RH below 60%, with a three-to-six-month practical window (FerTech Inform; Nutrien eKonomics, caking and bridging guidance). No public source publishes a shrink percentage for on-farm dry fertilizer; Crop Root Zone assumption: 0.5-1.5% of tons over a five-month humid-climate hold, stated as an assumption because it is one, and higher for segregated blends than for straight product.
Then the regulator. Federal SPCC governs oil, not fertilizer — its farm thresholds of 2,500 and 6,000 gallons aggregate aboveground capacity and its 20,000-gallon self-certification ceiling apply to petroleum and animal/vegetable oils (U.S. EPA, SPCC Fact Sheet for Farms). Fertilizer containment is a state matter, and the states are stricter. Minnesota exempts up to 6,000 gallons of liquid bulk fertilizer stored on a farmer's own property for his own use; above that, a $100 permit and MDA-approved containment sized at 125% of the largest tank plus displacement, plus a written incident response plan — and a permit is required for any amount of on-farm dry bulk fertilizer, stored on an impervious surface under roof (Minnesota Department of Agriculture). Iowa requires non-liquid fertilizer stored outside a fully enclosed building to drain to containment holding 12 inches of runoff, plus an approved load pad (Iowa Administrative Code 21-44).
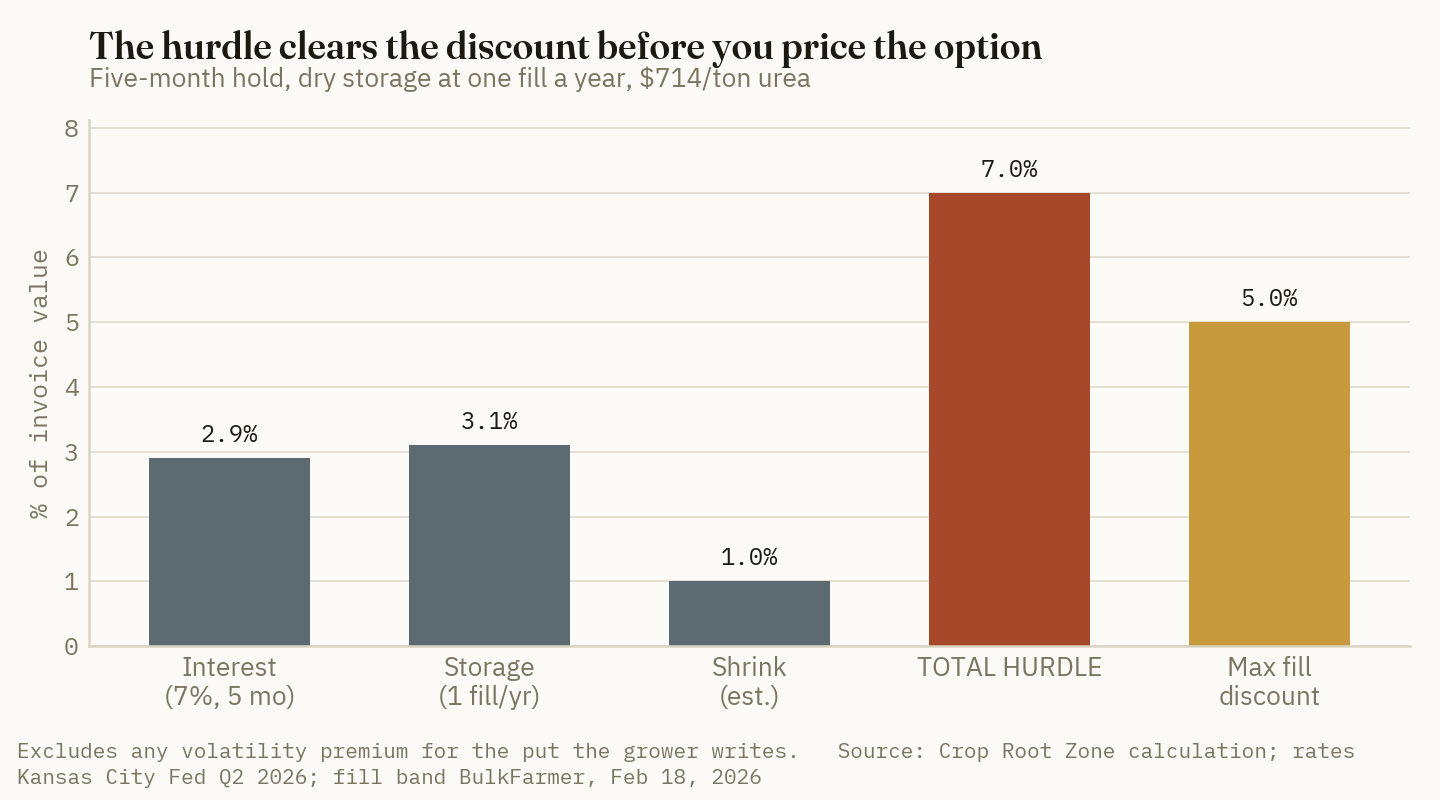
7%
The all-in cost of carrying a prepaid nitrogen ton five months in a once-a-year dry shed — against a fill discount that tops out at 5%. (Crop Root Zone calculation; rates Kansas City Fed, Q2 2026)
Ground Truth: Add the lines and the discount is gone before you have an opinion about price. Interest at 2.92% over five months, plus $22 per ton-year of dry building at one turn — 3.1% of a $714 urea ton — plus 1% shrink totals roughly 7% of invoice value, against a fill discount that tops out near 5%. On-farm storage is not a capacity business, it is a turns business: at two fills a year the building line halves to 1.5% and the math flips to break-even; at three it is comfortably positive. The right question at the fall-fill desk is not how many tons you can hold, but how many times the asset will fill in twelve months — and for the operation that fills once each August, the storage never pays for the nitrogen discount.
3. Why a nitrogen prepay is a short put, not a discount
What's new: The advance-purchase discount is small and set by the wrong variable. Pipeline fills in February were reported at a 3-5% discount versus March spot (BulkFarmer market data, updated Feb 18, 2026) — a fair proxy for the structural band, since fill programs are priced off the seller's carry, not the buyer's risk.
Evidence: Decompose the trade. A grower who prepays fixes his strike and keeps every dollar above it; he also absorbs every dollar below it, with no right to walk. That is the payoff of a written put, and the "discount" is the premium he collects for writing it — $21 to $36 per ton at 3-5% on $714 urea. Now price the exposure: urea fell 6% in a month, or $43 per ton; anhydrous 6%, or $62; UAN28 7%, or $34 (DTN, Jul 15, 2026). One month of the current downtrend in urea exceeds the entire maximum prepay premium, and the grower is short the option for five.
The demand side does not argue for a reversal. USDA's July 10 WASDE carried 2026 U.S. planted soybean acreage at 85.4 million acres against 81.2 million in 2025 — a 4.2-million-acre shift toward the crop that buys no nitrogen — with corn yield at 183.0 bu/acre and December 2026 corn closing $4.61 after the report (USDA WASDE, Jul 10, 2026). A four-million-acre rotation swing away from corn and a sub-$5 December board is not the setup in which a nitrogen seller has to bid for tons.
Ground Truth: The mispricing is structural, not situational. A retailer sets the fill discount off its own cost of carry — 7% money and a few months of storage — so the premium is anchored to interest rates. But the fair value of the option the grower writes is a function of nitrogen volatility, far above 7% annualized in a market that moved anhydrous up 34% year over year and then down 6% in four weeks. Whenever realized nitrogen vol exceeds the seller's carry — most of the time, and emphatically now — a fixed-percentage fill discount systematically underpays the grower for the put. Prepay is not always wrong; but its price is set by a variable with nothing to do with what the grower is selling, so he must supply his own volatility premium rather than treat the posted number as an offer to accept or decline.
4. The sulfur exception: where inventory is genuinely in the money
What's new: The same storage asset, filled with a sulfur-bearing product, sits on the other side of every calculation in Section 2. Trading Economics' China spot sulfur benchmark printed 9,435.67 CNY/T on July 20, 2026 — up 4.44% on the month and 310.66% year over year, off an all-time high of 11,084.33 in June 2026, with the site's model pointing to 10,370.73 in twelve months (Trading Economics, Jul 20, 2026). Tampa confirms the direction in a U.S. delivered price: $495.69/lt in Q1, $655 in Q2, $705 in Q3 (Argus Media, Jul 13, 2026).
Evidence: Run the Tampa escalation against the carry. The realized quarter-on-quarter move into Q3 was +8%; at that pace a five-month hold implies roughly +13% on the raw sulfur input against a 2.92% interest carry — a spread of about ten points before storage, versus nitrogen's negative spread (Crop Root Zone calculation; extrapolates the realized Q2-to-Q3 Tampa move, not a forecast). The caveat is pass-through: no public weekly print covers ammonium thiosulfate or ammonium sulfate at the farm gate, so the grower cannot observe how much of a $50/lt molten move reaches a delivered ATS ton, and the relationship is partial and lagged. What is observable is the tankage arithmetic — ATS at 12-0-0-26S runs 11.2 lb/gal, or 180 gallons per short ton (Kugler Company ATS technical sheet) — so the same 15,000-gallon vessel that holds 83.0 tons of UAN32 holds 83.3 tons of ATS. Identical steel, identical dike, opposite option.
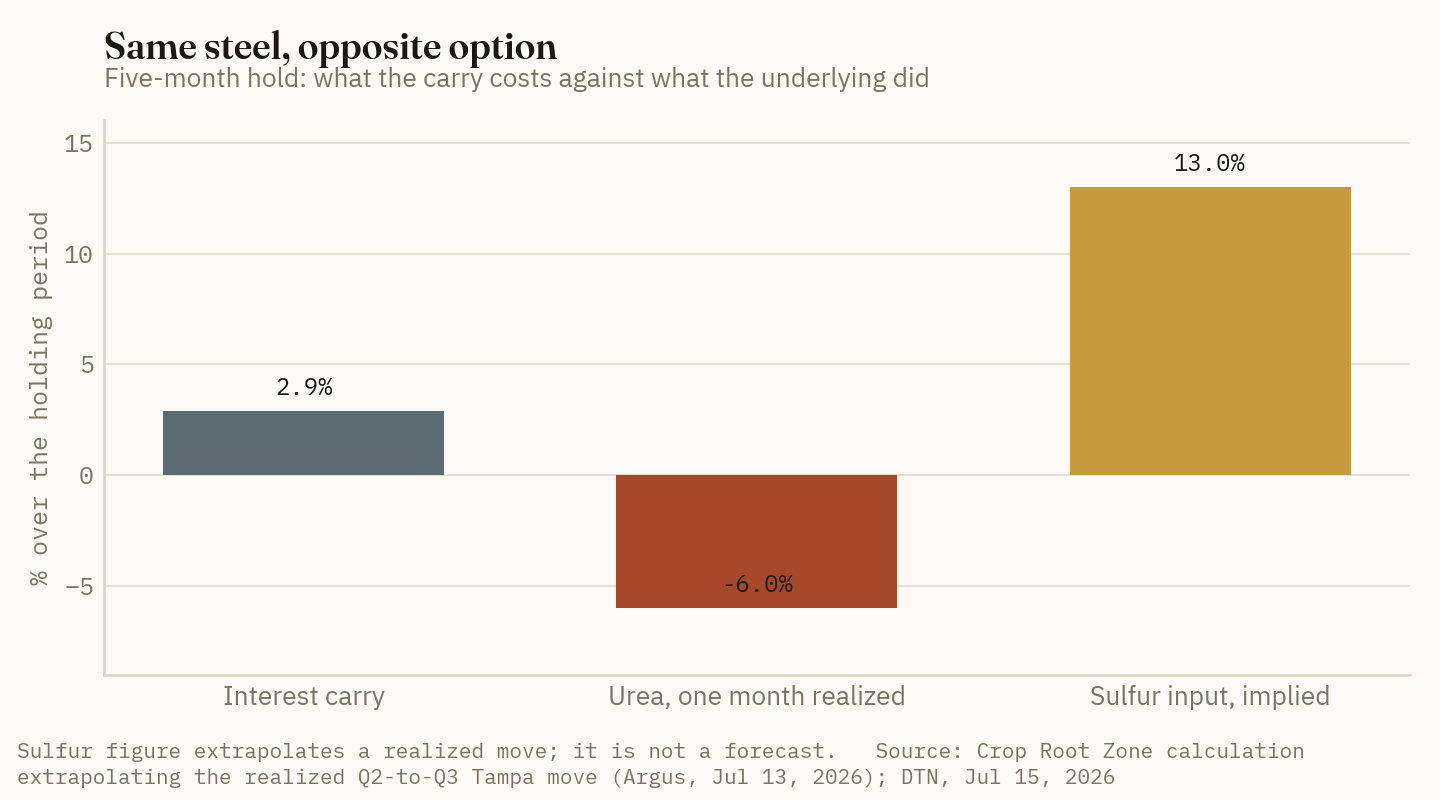
Ground Truth: This fill season is the first in years where the right answer differs by nutrient rather than by grower. The reflex heuristic — prepay when you can afford to, skip it when cash is tight — treats fill as a liquidity decision and gets both halves of this market wrong. On nitrogen, falling five straight weeks with the acreage mix leaning soybean, the discount is compensation for writing a put you should not write. On sulfur, up 42% at Tampa in three quarters against a world benchmark that has quadrupled, buying early is the trade and the storage is the enabling asset, not the cost. The grower who prepays everything and the one who prepays nothing are making the same error in opposite directions.
5. What the retailer is actually selling — and a decision rule for fall fill
What's new: Ag retail's inventory posture is why the offer exists in this shape. The Fertilizer Institute's president and CEO, Corey Rosenbusch, described a supply chain gone "from flexible and predictable, to strained and reactive," and said the industry "may move less just in time," with grower-retailer commitments happening earlier "so that we can pre position some of this product" (Brownfield Ag News, May 27, 2026). Mosaic told its first-quarter call that North American channel inventories were expected to stay tight through the second quarter (Mosaic Q1 2026 call, May 11, 2026). Nutrien's first-quarter disclosure shows the funding stack: short-term debt up on commercial paper for seasonal working capital, payables down on settlement of a Retail supplier-financing arrangement, partly offset by higher Retail customer prepayments received in anticipation of crop input price increases (Nutrien Ltd., Q1 2026 results, Apr 28, 2026).
Evidence: Read those three together and the mechanism is plain: the channel runs lean on owned tons, funds what it does own with commercial paper and supplier finance, and collects grower prepayments as a third funding leg. The consequence for the grower is availability risk — a channel that is not pre-positioned cannot compress an application window agronomy has already fixed at four to six weeks. That is the genuine, non-financial argument for prepay and for on-farm storage: not the discount, but the certainty that the ton is on your pad when the field is fit.
Market read: NTR (NYSE/TSX) — Hold — Retail converts grower prepayments and supplier financing into cheap seasonal working capital, a real structural advantage, but a falling nitrogen tape compresses the same Retail nutrient margin those prepayments were struck against.
Ground Truth: A 3-5% fill discount is the cheapest committed working capital in agriculture. The retailer borrows from the grower unsecured, no covenant, no collateral, at an implied annualized cost under its own commercial-paper rate — and in exchange hands the grower a five-month put on a falling commodity. This is not a discount for buying early. It is an invitation to fund the distributor's balance sheet and insure its price risk in one payment.
The rule for fall fill 2026. Compute the hurdle before looking at the offer: the discount must exceed (APR × months ÷ 12) + (annualized storage $/ton ÷ fills per year ÷ delivered price) + expected shrink + a volatility premium for the put you are writing. Worked at current numbers (Crop Root Zone calculation):
- Storage already built and paid for, nitrogen, five-month hold: hurdle = 2.9% interest + 1.0% shrink = 3.9%, before any volatility premium. A 5% offer clears it thinly, a 3% offer not at all — and in a market printing −6% months, nothing in the 3-5% band clears it once the put is priced honestly.
- Storage must be built, dry, one fill per year: add ~3.1% of a $714 urea ton. Hurdle above 7%. Decline.
- Storage must be built, liquid, one fill per year: add ~10.8% of a $529 UAN32 ton. Decline outright; liquid tankage does not pencil below roughly two fills a year at any discount now offered.
- Sulfur-bearing products (ATS, AMS): a 2.9% carry against an underlying up 42% at Tampa in three quarters. Fill early, fill full, and size the tank for this, not for UAN.
- Buy the availability, not the discount. If the case for prepay is that the ton is on the pad in a compressed spring window, price that as insurance and buy only the volume covering the window — the first pass, not the season.
Summarised, with the offer band held at its 3–5% maximum:
| Scenario | Hurdle | Offer clears it? |
|---|---|---|
| Storage built and paid for, nitrogen | 3.9% | Thinly at 5%, never at 3% — and not once the put is priced |
| Storage must be built, dry, 1 fill/yr | >7.0% | No |
| Storage must be built, liquid, 1 fill/yr | >13.7% | No — decline outright |
| Sulfur-bearing (ATS, AMS) | 2.9% carry vs +42% at Tampa in three quarters | Yes — fill early, fill full |
Source: Crop Root Zone calculation. Rates Kansas City Fed Q2 2026; fill discount band BulkFarmer, Feb 18, 2026; Tampa settlements Argus Media, Jul 13, 2026. Shrink is an assumption, not a sourced figure.
What not to do is treat the posted fill discount as a verdict. It is a quote from a counterparty whose carrying cost, not your risk, set the number.
References
- DTN/Progressive Farmer, "UAN Fertilizers Lead Nutrient Prices Downward" (retail fertilizer survey, week of Jul 6-10, 2026), Jul 15, 2026 — https://www.dtnpf.com/agriculture/web/ag/crops/article/2026/07/15/uan-fertilizers-lead-nutrient-prices
- Argus Media, Q3 2026 Tampa molten sulfur contract settlement ($705/long tonne delivered), Jul 13, 2026.
- Trading Economics, Sulfur (China spot benchmark) price series and model forecast, accessed Jul 20, 2026 — https://tradingeconomics.com/commodity/sulfur
- USDA, World Agricultural Supply and Demand Estimates (WASDE), Jul 10, 2026 — https://www.usda.gov/oce/commodity/wasde
- Federal Reserve Bank of Kansas City, Agricultural Finance Update / Survey of Terms of Lending to Farmers, Q2 2026 — https://www.kansascityfed.org/agriculture/agfinance-updates/
- Board of Governors of the Federal Reserve System, H.15 Selected Interest Rates, Jul 17, 2026 — https://www.federalreserve.gov/releases/h15/
- BulkFarmer.com, Fertilizer Prices market data page (pipeline fill discount and fall-fill inventory commentary), updated Feb 18, 2026 — https://www.bulkfarmer.com/market-data/fertilizer-prices
- Rogers, D. & Akridge, J.T., "Bringing On-Farm Fluid Fertilizer Storage into Compliance: What Will It Cost?", Purdue Agricultural Economics Report PAER-1992-7, Jun 16, 1992 — https://ag.purdue.edu/commercialag/home/paer-article/bringing-on-farm-fluid-fertilizer-storage-into-compliance-what-will-it-cost-2/
- Minnesota Department of Agriculture, "On-Farm Storage of Liquid Bulk Fertilizer" — https://www.mda.state.mn.us/farm-storage-liquid-bulk-fertilizer
- Minnesota Department of Agriculture, "Dry Bulk Fertilizer Storage Requirements" — https://www.mda.state.mn.us/pesticide-fertilizer/dry-bulk-fertilizer-storage-requirements
- Iowa Department of Agriculture and Land Stewardship, "On Farm Fertilizer Storage," Feb 2020, and Iowa Administrative Code 21-44 — https://iowaagriculture.gov/sites/default/files/feeds/Commercial%20Fertilizer/On%20Farm%20Fertilizer%20Storage.pdf
- U.S. EPA, "Spill Prevention, Control, and Countermeasure (SPCC) Fact Sheet for Farms" — https://www.epa.gov/oil-spills-prevention-and-preparedness-regulations/spill-prevention-control-and-countermeasure-fact
- Plastic-Mart, Liquid Fertilizer Tanks listed pricing (Norwesco 15,000 gal and 20,000 gal), accessed Jul 20, 2026 — https://www.plastic-mart.com/chemical-storage-tanks/liquid-fertilizer-tanks/
- Mississippi State University Extension, "Fluid Fertilizers" (UAN densities) — https://extension.msstate.edu/publications/fluid-fertilizers
- Kugler Company, ATS 12-0-0-26S Ammonium Thiosulfate technical sheet (11.2 lb/gal; 180 gal/ton) — https://www.kuglercompany.com/images/tech_sheets/ats%20tech%20sheet.pdf
- Nutrien eKonomics, "Top Causes of Fertilizer Caking and Bridging" — https://nutrien-ekonomics.com/news/top-causes-of-fertilizer-caking-and-bridging/
- FerTech Inform, "Urea Caking and How to Prevent It" (critical relative humidity ~73% at 30°C) — https://fertechinform.org/knowledgebase/urea-caking-and-how-to-prevent-it/
- Agri-Systems, "How Much Does a Grain Bin Cost? Price Guide 2026" ($2.00-$4.50/bu farm bins; Oct 2025 extension interviews cited) — https://agri-systems.com/how-much-does-a-grain-bin-cost/
- Stueve Construction, dry and liquid fertilizer storage building solutions (1,400+ projects, 500 to 100,000+ tons), accessed Jul 20, 2026 — https://stueve.com/
- Greystone Construction, Dry Fertilizer Storage Buildings (500 to 100,000 tons), accessed Jul 20, 2026 — https://www.greystoneconstruction.com/markets/agribusiness/dry-fertilizer-storage-buildings.html
- AgTalk grower trade forum, on-farm dry fertilizer facility cost threads (grower-reported, undated) — https://talk.newagtalk.com/forums/thread-view.asp?tid=600925
- Brownfield Ag News, "Fertilizer Institute CEO says just-in-time supply chain has hit tipping point" (Corey Rosenbusch), May 27, 2026 — https://www.brownfieldagnews.com/news/fertilizer-institute-ceo-says-just-in-time-supply-chain-has-hit-tipping-point/
- Mosaic Company, Q1 2026 earnings call transcript, May 11, 2026 — https://www.fool.com/earnings/call-transcripts/2026/05/11/mosaic-mos-q1-2026-earnings-call-transcript/
- Nutrien Ltd., "Nutrien Reports First Quarter 2026 Results," Apr 28, 2026 — https://www.nutrien.com/news/press-releases/nutrien-reports-first-quarter-2026-results-1746
Disclosures
Crop Root Zone is an independent publication. Nothing here is investment advice. Market calls, where included, reflect the editors' own read and are not a recommendation to buy or sell any security.
Polymer-Coated Urea's Second Look: It Pays One Year in Four — and a Blend Beats Buying It Straight
ESN carries a $0.16–0.20/lb-N premium and out-yields urea in only about a quarter of Minnesota site-years, all of them wet — but the research says a 2:1 ESN-to-urea blend returns more than either pure product, because you should buy the coating only for the nitrogen that has to survive
Controlled-release nitrogen is the input that comes back into fashion on a schedule — every time the nitrogen bill spikes, polymer-coated urea gets a fresh round of promotion as the way to make each pound count. The mechanism is real and well understood: a polymer membrane encapsulates the urea granule, water diffuses in, and dissolved nitrogen diffuses back out over roughly six weeks, with the release rate governed by soil temperature (University of Wisconsin Extension) [1]. Metering nitrogen out over weeks instead of dumping it in one soluble slug keeps a smaller fraction exposed to leaching and denitrification at any moment — which, in a wet spring, is exactly the loss that eats a urea program. The trouble is that the field record does not support the brochure. Across a large Minnesota dataset, polymer-coated urea beat plain urea only about a quarter of the time, and the times it won were the wet ones. At $0.16–0.20 more per pound of nitrogen, that is not a product you buy by default. It is one you buy for a specific risk — and the research points to buying it as a blend, not straight.
1. The premium, and how often it actually earns it back
What's new: The honest starting point is the hit rate, and it is lower than the marketing implies. In a study spanning 35 locations across Minnesota from 2014 to 2018, polymer-coated urea (ESN) showed a yield advantage over urea 26% of the time for corn-following-corn and 28% of the time for corn-following-soybean (University of Minnesota Extension) [2]. The rest of the time it tied urea — and it never tied cheap.
Evidence: Polymer-coated urea carries a premium of roughly $0.16–0.20 per pound of nitrogen over conventional urea (University of Minnesota Extension) [2]. On a 143-lb-N/acre corn rate applied entirely as ESN, that is about $23–29/acre of extra cost bought before a single bushel of response — a Crop Root Zone calculation on the cited premium.
| Metric | Value | Source |
|---|---|---|
| ESN premium over urea | $0.16–0.20/lb N | UMN [2] |
| Extra cost, 143 lb N all-ESN | ~$23–29/acre | CRZ calc on [2] |
| Yield win vs urea, corn/corn | 26% of site-years | UMN, 35 sites 2014–18 [2] |
| Yield win vs urea, corn/soy | 28% of site-years | UMN [2] |
| When it wins | wet years / high-loss soils | UMN [2] |
Source: University of Minnesota Extension, polymer-coated urea corn research, 35 Minnesota site-years 2014–2018 [2]; premium and extra-cost figures as cited/calculated.
The pattern behind the hit rate is not random: in wet years, when urea is losing nitrogen to leaching and denitrification, polymer-coated urea usually outperforms; in dry years, when little nitrogen is being lost either way, the two products perform similarly [2]. ESN is insurance against a loss event, and like any insurance it pays only when the event happens.
~1 in 4
How often polymer-coated urea out-yielded plain urea across 35 Minnesota corn site-years — and it won only in wet conditions. (University of Minnesota Extension, 2014–2018 [2])
Ground Truth: Treat polymer-coated urea as a priced insurance policy, not a yield-booster. The premium is the annual insurance cost you pay every year; the yield response is the claim you collect only in the roughly one-in-four years — the wet ones — when urea would have lost nitrogen. That framing immediately tells you who should buy it: growers whose specific fields carry high loss risk most years — sandy, irrigated, tile-drained, or chronically wet-spring ground — where the "one in four" is really "most years for me." For a grower on heavy, well-drained ground that loses little nitrogen in a normal spring, the same product is a premium paid against a claim rarely filed.
2. The finding that matters: blend it, don't buy it straight
What's new: The single most useful result in the Minnesota economic work is not about pure ESN at all. A blend of polymer-coated urea and conventional urea returned more than either product alone — and by a wide margin.
Evidence: Using the study's stated assumptions — a $0.20/lb premium for ESN, the same $0.50/lb application cost for both products, and $3.50/bu corn — the Minnesota analysis found that straight ESN increased revenue by $49.50/acre over straight urea, a 1:2 ESN-to-urea blend increased it by $72.50/acre, and a 2:1 ESN-to-urea blend increased it by $85.50/acre — the best of the four programs (University of Minnesota Extension) [2].
| Nitrogen program | Revenue vs urea | |
|---|---|---|
| Straight urea (baseline) | $0 | |
| Straight ESN | +$49.50/acre | ██████ |
| 1:2 ESN:urea blend | +$72.50/acre | ████████ |
| 2:1 ESN:urea blend | +$85.50/acre | ██████████ |
Source: University of Minnesota Extension [2], assuming a $0.20/lb ESN premium, equal $0.50/lb application cost, and $3.50/bu corn. Revenue is relative to a straight-urea program on the same rate.
The logic is intuitive once stated: pure ESN can meter too slowly, holding some nitrogen back past the crop's peak-demand window, while pure urea exposes everything to early-season loss. A blend gives the crop a slug of immediately available nitrogen from the uncoated urea and a protected reserve from the ESN that survives the loss window and releases later. You are buying the coating only for the fraction of nitrogen that needs to outlast the wet weeks — and spreading the premium across fewer pounds than an all-ESN program while capturing most of the protection.
Ground Truth: "Blend it" is the practical takeaway that changes the purchase, and it inverts the usual instinct. A grower who has decided ESN is worth trying should not order a straight-ESN program — the research says a roughly 2:1 ESN-to-urea blend returned more than pure ESN in the Minnesota data, because it pairs early availability with late-season protection and dilutes the premium. That also softens the cost: a 2:1 blend on 143 lb N carries maybe two-thirds of the all-ESN premium — on the order of $15–19/acre rather than $23–29 — for the higher modeled return. The brochure sells the pure product; the data sells the blend. And at 2026 corn prices north of the study's $3.50 assumption, the value of protecting a wet-spring yield is larger than these figures show, which widens the blend's edge, not narrows it.
3. Where it fits — and where the money is wasted
What's new: Because the response is conditional on loss, the fit is a soil-and-water map, not a product decision. Polymer-coated urea earns its premium in a defined set of conditions and is dead weight outside them.
Evidence: The environments where controlled-release nitrogen consistently pays are the high-loss ones: sandy and coarse-textured soils with high leaching risk, and intensive irrigated production — the University of Wisconsin's work centers on the state's Central Sands region for exactly this reason (University of Wisconsin Extension) [1]. The mechanism reinforces the map: release is temperature-driven and completes in about six weeks, so the product's value is highest where a soluble alternative would have leached or denitrified in that same window [1].
| Field condition | ESN fit | Why |
|---|---|---|
| Sandy / coarse, high leaching | Strong | soluble N leaches before uptake [1] |
| Irrigated (e.g. Central Sands) | Strong | added water drives loss [1] |
| Tile-drained / chronically wet spring | Good | denitrification window [2] |
| Heavy, well-drained, normal spring | Weak | little N lost either way [2] |
| Dry-year dryland | Weak | products tie [2] |
Source: University of Wisconsin Extension [1]; University of Minnesota Extension [2].
There is also a genuine logistics benefit that is easy to under-count: because it releases slowly and resists early loss, polymer-coated urea allows earlier application without the loss penalty a soluble source would take, which can cut the number of in-season passes and the associated fuel and labor [1][3]. On operations where a spring application window is tight or a second side-dress pass is hard to schedule, that flexibility has real value independent of the yield response — but it should be priced as a logistics saving, not double-counted as a yield claim.
Ground Truth: Map your loss risk before you price the product. The single question that decides whether polymer-coated urea belongs in your program is not "is nitrogen expensive this year?" — it is "does this field lose nitrogen in a normal-to-wet spring?" On sandy, irrigated, or chronically wet ground the answer is yes and the premium is well spent, ideally as a blend. On heavy, well-drained ground that holds its nitrogen, the answer is no and the same dollars buy nothing but a smaller slug of exposed N you could have gotten from a nitrification inhibitor at a fraction of the cost. This is a field-by-field input, and treating it as a whole-farm default in either direction — all-in or never — is how growers either overspend on protection they don't need or eat an avoidable loss on the acres that do.
4. The category is growing — for a reason, and with a caveat
What's new: Controlled-release and stabilized nitrogen are the fastest-growing corner of the fertilizer market, and the growth is not just marketing — but the reason matters for how a grower should read the trend.
Evidence: Industry analysis expects polymer-coated and inhibitor-stabilized products together to capture 55–65% of incremental nitrogen demand growth by 2030 (industry market analysis, 2025–2026) [4], driven by tightening nitrogen-loss and water-quality regulation as much as by agronomics. That regulatory tailwind is real and durable — it is not going to reverse — but it means some of the category's growth is being pulled by compliance and environmental pressure, not purely by a per-acre yield return the grower captures.
Ground Truth: Distinguish the two reasons the category is growing, because only one of them shows up on your yield monitor. Where controlled-release nitrogen is adopted to hit a water-quality or loss-reduction target, the value accrues partly to the watershed and the regulator, and the grower's private return can be thin even when the public benefit is large. Where it is adopted because a specific sandy or irrigated field genuinely loses nitrogen, the private return is real and the blend economics above apply. Both are legitimate reasons to use the product — but a grower deciding on their own dollar, absent a regulatory mandate, should hold it to the private-return test: high-loss field, blended not straight, priced as insurance. Meet that test and it is one of the better-supported inputs in the enhanced-efficiency aisle. Miss it and it is a premium paid for a claim you will rarely file.
Market read: NTR — Hold — Nutrien owns the ESN franchise and is positioned in the fastest-growing nitrogen segment with a regulatory tailwind behind it, but ESN remains a modest slice of a company whose earnings are set by the potash and bulk-nitrogen cycle; the controlled-release growth story is a real long-run positive that is unlikely to move the near-term print. Reflects the editors' read on the product's market position, not a recommendation to buy or sell the security.
References
- University of Wisconsin Extension, Soil Science, "Polymer-Coated Urea (ESN) for Corn" — accessed Jul 2026, https://extension.soils.wisc.edu/wcmc/polymer-coated-urea-esn-for-corn-2/
- University of Minnesota Extension, "High Nitrogen Prices – Is Now the Time to Try Polymer-Coated Urea?" and "Are controlled-release nitrogen fertilizers worth it?" (35 Minnesota site-years, 2014–2018; premium, hit-rate, and blend economics) — 2022, https://blog-crop-news.extension.umn.edu/2022/03/high-nitrogen-fertilizer-prices-is-now.html
- NutrientStar, ESN product performance summary (reduced applications, labor, and compaction) — accessed Jul 2026, https://nutrientstar.org/tool-finder/esn/
- Industry market analysis of slow-release and stabilized nitrogen granules (polymer-coated and inhibitor-stabilized products projected to capture 55–65% of incremental demand growth by 2030) — 2025–2026, https://www.indexbox.io/store/european-union-slow-release-nitrogen-granules-market-analysis-forecast-size-trends-and-insights/
Disclosures
Crop Root Zone is an independent publication. Nothing here is investment advice. Market calls, where included, reflect the editors' own read and are not a recommendation to buy or sell any security.
Poultry Litter Is a Phosphate Product, and Phosphate Isn't Falling: What a Ton Is Worth at Mid-2026 Prices
Retail nitrogen is down six weeks running, but litter draws most of its value from the P and K lines — which are flat near highs. A ton pencils near $85 in first-year nutrients, and the haul radius that pays just widened.
The fertilizer headline of the summer is that nitrogen is falling — retail anhydrous, urea and UAN have declined for six straight weeks (DTN/Progressive Farmer, Jul 22, 2026). That headline does not describe manure. A ton of poultry litter is only lightly a nitrogen product; it draws the larger share of its worth from phosphate and potash, and those two lines are sitting flat near multi-year highs while nitrogen drops. The result is a quiet divergence: as commercial N gets cheaper, the animal-manure that competes mostly with P and K is holding its value — and in the poultry belt, where litter is the cheapest phosphate a row-crop grower can buy, that changes the haul-radius math this fall.
1. Litter is mostly P and K, so price it that way
What's new: Valuing litter on its nitrogen misses most of the ton. The phosphate and potash it carries — both firm — are where the money is.
Evidence: A representative ton of broiler litter analyzes near 60 lb N, 55 lb P2O5 and 45 lb K2O, though it varies widely by bird type, bedding and region (extension litter-analysis work; UGA, NC State, Oklahoma State, 2026). To value it, price each nutrient off the commercial product that supplies it, using mid-July 2026 retail boards:
| Nutrient | Litter (lb/ton) | Retail value ($/lb)* | Source product |
|---|---|---|---|
| Nitrogen (N) | 60 | 0.74 | Urea, 46-0-0 |
| Phosphate (P2O5) | 55 | 0.70 | DAP, 18-46-0 (net of N) |
| Potash (K2O) | 45 | 0.41 | Potash, 0-0-60 |
*Crop Root Zone calculation from DTN retail prices, Jul 22, 2026: N from urea $682/ton; P2O5 backed out of DAP $911/ton net of its N value; K2O from potash $494/ton. Litter analysis is a representative average, not farm-specific — test every source.
The important fact is in the second column: phosphate at $0.70/lb and potash at $0.41/lb did not participate in the nitrogen markdown. DAP and MAP were flat-to-slightly-higher month over month and up 12–13% on the year; potash was flat and up 3% (DTN, Jul 22, 2026). Litter is roughly 55% P2O5-and-K2O by nutrient weight in value terms, so its worth tracks the firm half of the fertilizer complex, not the falling half.
Ground Truth: The falling-nitrogen story is a commercial-N story, and litter is not a commercial-N product. Anyone valuing manure off this summer's cheaper urea is marking down an asset whose value is actually holding — because two-thirds of what a ton of litter replaces is phosphate and potash, and neither of those came down. In a split fertilizer market, the manure-rich operation is quietly long the nutrients that didn't fall.
2. What a ton is worth right now
What's new: At mid-2026 prices, a ton of litter pencils near $85 in first-year-available nutrients and above $100 counting all of its nitrogen — well above the ~$63 the same ton was worth at the lower prices in prior extension examples.
Evidence: Two honest numbers, because nitrogen availability from manure is not 100% in year one. Phosphate and potash in litter are essentially fully plant-available the year of application, but only about 50–70% of the nitrogen mineralizes in the first season, with the rest releasing slowly over following years (NC State / Oklahoma State extension, 2026). Value the ton both ways:
| Basis | N counted | Value/ton |
|---|---|---|
| First-year available | 60% of N (36 lb) | ≈ $84 |
| All nutrients (full N) | 100% of N (60 lb) | ≈ $101 |
Source: Crop Root Zone calculation, nutrient prices from DTN retail Jul 22, 2026; N availability from extension guidance. First-year: (36×0.74)+(55×0.70)+(45×0.41). Full: (60×0.74)+(55×0.70)+(45×0.41).
≈ $84/ton
First-year-available nutrient value of a typical ton of broiler litter at mid-July 2026 retail nutrient prices — up sharply from the ~$63 the same analysis penciled at prior-cycle prices, almost entirely because phosphate repriced higher. (Crop Root Zone calculation; nutrient prices DTN, Jul 22, 2026)
Where does the value come from? Not nitrogen — phosphate leads, even after discounting the N for availability:
| Value source (first-year basis) | $/ton | |
|---|---|---|
| Phosphate (P2O5) | 38.50 | ██████████ |
| Nitrogen (first-year available) | 26.64 | ███████ |
| Potash (K2O) | 18.45 | █████ |
Source: Crop Root Zone calculation from DTN retail nutrient prices, Jul 22, 2026. Bars scaled to phosphate = 10.
That ordering — phosphate first, nitrogen second, potash third — is the whole argument. A grower thinking of litter as "cheap nitrogen" has the ton upside down. It is cheap phosphate with nitrogen and potash attached, and phosphate is the nutrient the commercial market is charging the most for right now relative to a year ago.
Ground Truth: Litter's value rose this year for the same reason DAP did — the phosphate complex repriced — and it will hold up as long as phosphate does, regardless of what nitrogen does next. The grower with a litter source is hedged against exactly the input line (P) that is not falling, which is worth more in 2026 than the more familiar pitch that manure saves on nitrogen.
3. The haul radius that pays just widened
What's new: Litter's economics are set by hauling distance, because it is bulky and dilute. When the nutrient value rises, the distance over which it pays to move a ton stretches — and it stretched this year.
Evidence: Litter is roughly a 6-4-3 grade material — a lot of tonnage per pound of nutrient — so freight, not the litter itself, usually decides whether it pencils. Hauling and spreading commonly runs on the order of $10–20 per ton delivered within a local radius, rising with distance until the freight eats the nutrient value (representative custom-haul rates, 2026). Against an ~$84/ton first-year nutrient value, the breakeven distance is generous:
| Delivered haul + spread cost | Net value/ton (vs ~$84 nutrients)* |
|---|---|
| $15 (near, <15 mi) | ≈ $69 |
| $25 (mid, ~30 mi) | ≈ $59 |
| $40 (far, ~50+ mi) | ≈ $44 |
*Illustrative: nutrient value from Section 2 (first-year basis); haul/spread costs are representative ranges and vary with fuel, distance, load size and custom rates. Net = nutrient value − delivered cost.
The point is that even at a $40/ton delivered cost — a genuinely long haul — the ton still nets more than $40 in first-year nutrients, and that math got better this year because the numerator (nutrient value) rose while diesel was relatively contained. A year ago, at lower phosphate prices, the same $40 haul left a thinner margin; at 2026 P and K prices it clears comfortably. That is how a firm phosphate market quietly extends the geography over which manure is worth moving.
Ground Truth: Rising phosphate does not just raise litter's value — it widens the circle around every poultry house within which that litter out-competes commercial P. The row-crop grower who dismissed a litter source as "too far to haul" at last year's prices should re-run the number, because the breakeven distance moved out with the phosphate market. The constraint on manure has always been freight, and 2026's firm P-K complex loosened it.
4. The two cautions that keep this honest
What's new: Litter's value is real but conditional — on a soil test that actually needs phosphate, and on nutrient ratios that rarely match crop removal.
Evidence: Litter delivers its nutrients in a roughly 60-55-45 ratio, which does not match what a corn crop removes (nitrogen-heavy) or a soybean crop removes (potash-heavy relative to its low N need). Apply litter to hit the nitrogen rate and you over-apply phosphate; apply it to hit the phosphate rate and you under-supply nitrogen and top up with commercial N. On fields already testing high in phosphorus — common where litter has been applied for years — the P in the ton is worth far less than its market price, because the crop will not respond to phosphate it does not need, and in many watersheds regulation caps P application regardless of value.
That is the discipline the $84/ton figure requires: it is the value of the nutrients if the field needs them. On a low-P field short of its phosphate target, the number is real and the haul math in Section 3 holds. On a high-P field, the phosphate line — the largest piece of the ton — collapses to near zero agronomic value, and the litter is worth its nitrogen and potash alone, roughly $45/ton, before hauling.
Ground Truth: Value litter against the soil test, not the market board. The $84 ton is an $84 ton only on a field that needs the phosphate; on a field already high in P, most of that value is regulatory risk rather than agronomic return. The right buyer for a poultry-belt litter source this year is the low-P row-crop grower a county away, not the neighbor who has spread it for a decade — and the firm phosphate market is exactly what makes it worth trucking to that low-P field instead of the nearest one.
References
- DTN/Progressive Farmer, "Fertilizer Prices Continue Downward Trend" (retail survey, week of Jul 13–17, 2026) — Jul 22, 2026. https://www.dtnpf.com/agriculture/web/ag/crops/article/2026/07/22/fertilizer-prices-continue-downward
- University of Georgia Extension (CAES), "Calculating the Fertilizer Value of Broiler Litter" — 2026. https://fieldreport.caes.uga.edu/publications/C933/calculating-the-fertilizer-value-of-broiler-litter/
- NC State Extension, "Poultry Litter as a Fertilizer Source" — accessed Jul 2026. https://content.ces.ncsu.edu/poultry-litter-as-a-fertilizer-source
- Oklahoma State University Extension, "Using Poultry Litter as Fertilizer" — accessed Jul 2026. https://extension.okstate.edu/fact-sheets/using-poultry-litter-as-fertilizer
- Livestock and Poultry Environmental Learning Community, "Impact of Fluctuating Fertilizer Prices on Poultry Manure Nutrient Value" — accessed Jul 2026. https://lpelc.org/impact-of-fluctuating-fertilizer-prices-on-poultry-manure-nutrient-value/
Disclosures
Crop Root Zone is an independent publication. Nothing here is investment advice. Market calls, where included, reflect the editors' own read and are not a recommendation to buy or sell any security.
Struvite's Agronomy Question Is Settled. Its Tonnage Question Isn't.
With DAP at $912 and up 13% year over year, recovered phosphorus finally pencils on paper. The constraint was never the crop response — it's that the entire global category is a rounding error against 4 million tons of US P₂O₅ demand.
Diammonium phosphate averaged $912 per ton in DTN's July 6–10 retail survey — flat month over month but up 13% year over year — and MAP sat at $954, also +13% (DTN, Jul 15, 2026). Phosphate has held near its highs through an entire nitrogen collapse. That is the price environment in which recovered phosphorus, a category that has spent roughly 150 years being "almost economic," finally clears a nutrient-replacement breakeven on paper. The agronomic question that dogged it is now largely answered by field data. The question that replaces it is arithmetic, and it is less flattering: there is not remotely enough of the stuff to matter.
1. What struvite is, and what the trials found
What's new: The agronomic case has moved from contested to broadly settled in the past three years, on the strength of multi-site, multi-crop replicated field work rather than manufacturer trials.
Evidence: Struvite is magnesium ammonium phosphate hexahydrate — a biogenic mineral of low solubility that precipitates out of phosphorus-rich wastewater. The commercial reference product, Ostara's Crystal Green, analyzes 5-28-0 with roughly 10% magnesium (16.7% MgO); the company reports more than 170 replicated small-plot and field trials across North America and Europe.
Independent work carries more weight. University of Arkansas researchers — Kristofor Brye, Lauren Greenlee and Jennie Popp, with NSF support — ran field studies from 2018 to 2020 on corn, rice and soybeans in east Arkansas, comparing electrochemically precipitated struvite, chemically precipitated struvite (Crystal Green) and conventional mined phosphate sources. The headline result, published March 2023: "no major differences in yield performance between the electrochemically precipitated struvite and all the other mined phosphate sources" across the three crops, with the electrochemical material performing somewhat better on corn and soybeans than on rice.
University of Wisconsin Extension's soils review goes further on efficiency grounds, reporting that struvite outperforms DAP on a unit-for-unit basis in dry matter production, phosphorus uptake and extractable residual P — a consequence of its low solubility releasing P gradually rather than flushing it. The same review is candid about the history: struvite has been proposed as a fertilizer for about 150 years, and its use stayed confined to high-value crops because of manufacturing cost.
The literature has kept moving. A 2026 study in Agrosystems, Geosciences & Environment reports electrochemically recovered struvite matching conventional fertilizers in soil nutrient supply (Kharal et al., 2026).
Ground Truth: Notice which direction the burden of proof has shifted. Five years ago the question was whether a low-solubility recovered mineral could feed a row crop; the Arkansas and Wisconsin work has answered that, and the honest reading of "no major differences" is that struvite is now a substitutable P source, not an experimental one. The interesting consequence is that every remaining argument against struvite is an argument about supply chains, granule handling and price — the same arguments that apply to any commodity input. It has graduated from an agronomy discussion into a procurement discussion, and most of the industry has not updated.
2. Pricing the ton: a $560–700 breakeven
What's new: With DAP at $912, the nutrient-replacement value of a struvite ton can be calculated rather than asserted — and it lands in a band that a specialty product can plausibly hit.
Evidence: The following is a Crop Root Zone model. Product analyses are as published; nutrient unit values are derived from cited market prices; the magnesium credit is our estimate.
A ton of 5-28-0 with 10% Mg contains 100 lb N, 560 lb P₂O₅ and 200 lb Mg.
Value the phosphate two ways, because the honest answer depends on whether you credit DAP's nitrogen:
- Uncredited: DAP at $912/st ÷ 2,000 lb ÷ 0.46 = $0.99 per lb P₂O₅.
- N-credited: DAP's 360 lb of N per ton, valued at anhydrous's $0.63/lb N (DTN, Jul 2026), is worth $227; the residual $685 over 920 lb P₂O₅ = $0.745 per lb P₂O₅.
Apply both to the struvite ton, adding $63 for its nitrogen (100 lb at $0.63) and an estimated $80 for magnesium (200 lb at an assumed $0.40/lb Mg — our estimate, and the softest number here):
| Basis | P₂O₅ (560 lb) | + N (100 lb) | + Mg (200 lb) | Replacement value |
|---|---|---|---|---|
| N-credited DAP, $0.745/lb P₂O₅ | 417 | 63 | 80 | ≈ 560 |
| Uncredited DAP, $0.99/lb P₂O₅ | 554 | 63 | 80 | ≈ 697 |
All figures $/ton of struvite. Source: DAP and anhydrous prices DTN/Progressive Farmer, Jul 15, 2026; product analysis per Ostara published literature. The arithmetic and the $0.40/lb magnesium credit are a Crop Root Zone model — the Mg credit is the softest input here and a grower with adequate soil Mg should treat that $80 as zero.
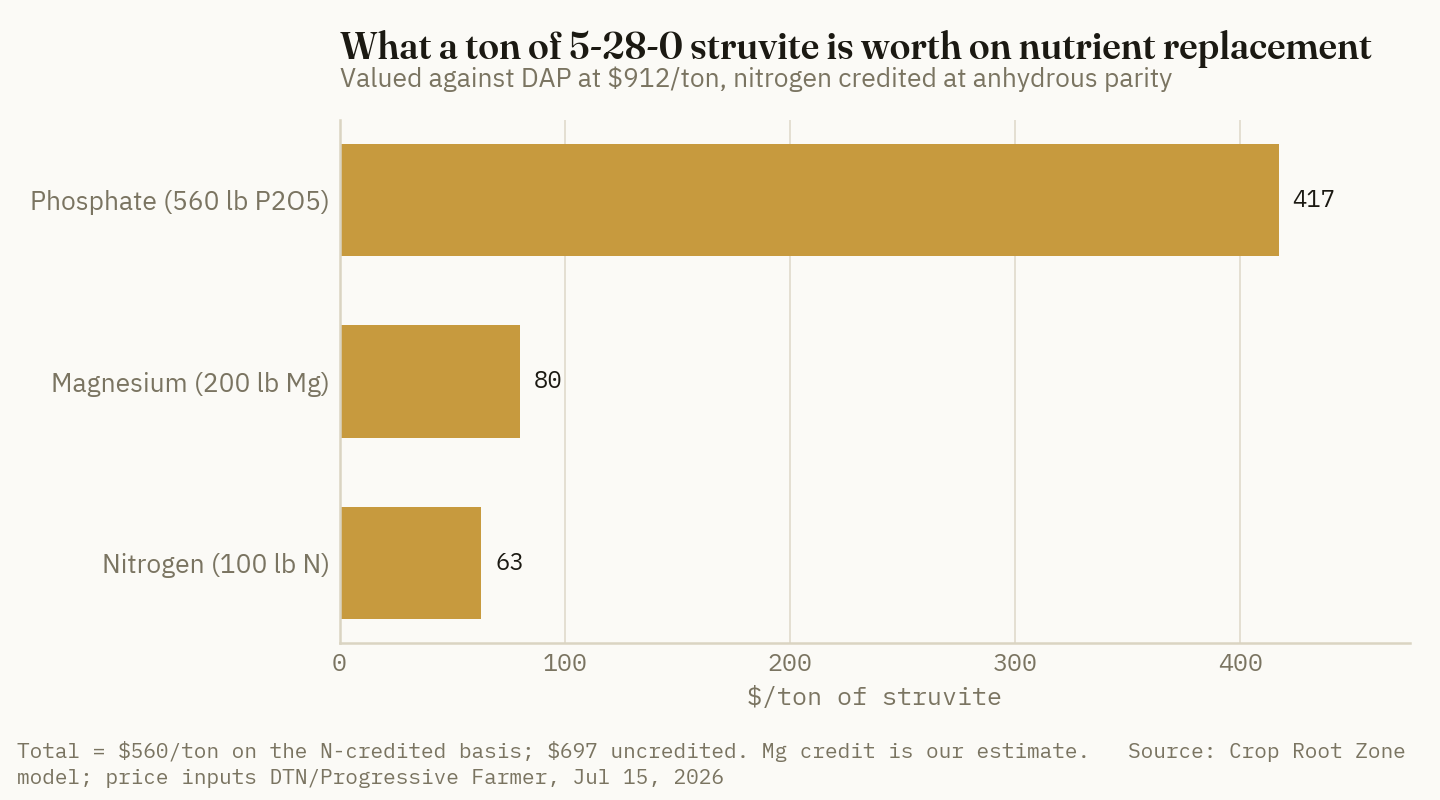
So a struvite ton is worth roughly $560–700 at today's phosphate prices, purely on nutrient replacement and before any credit for slow release, reduced tie-up in high-pH or high-calcium soils, or runoff benefit.
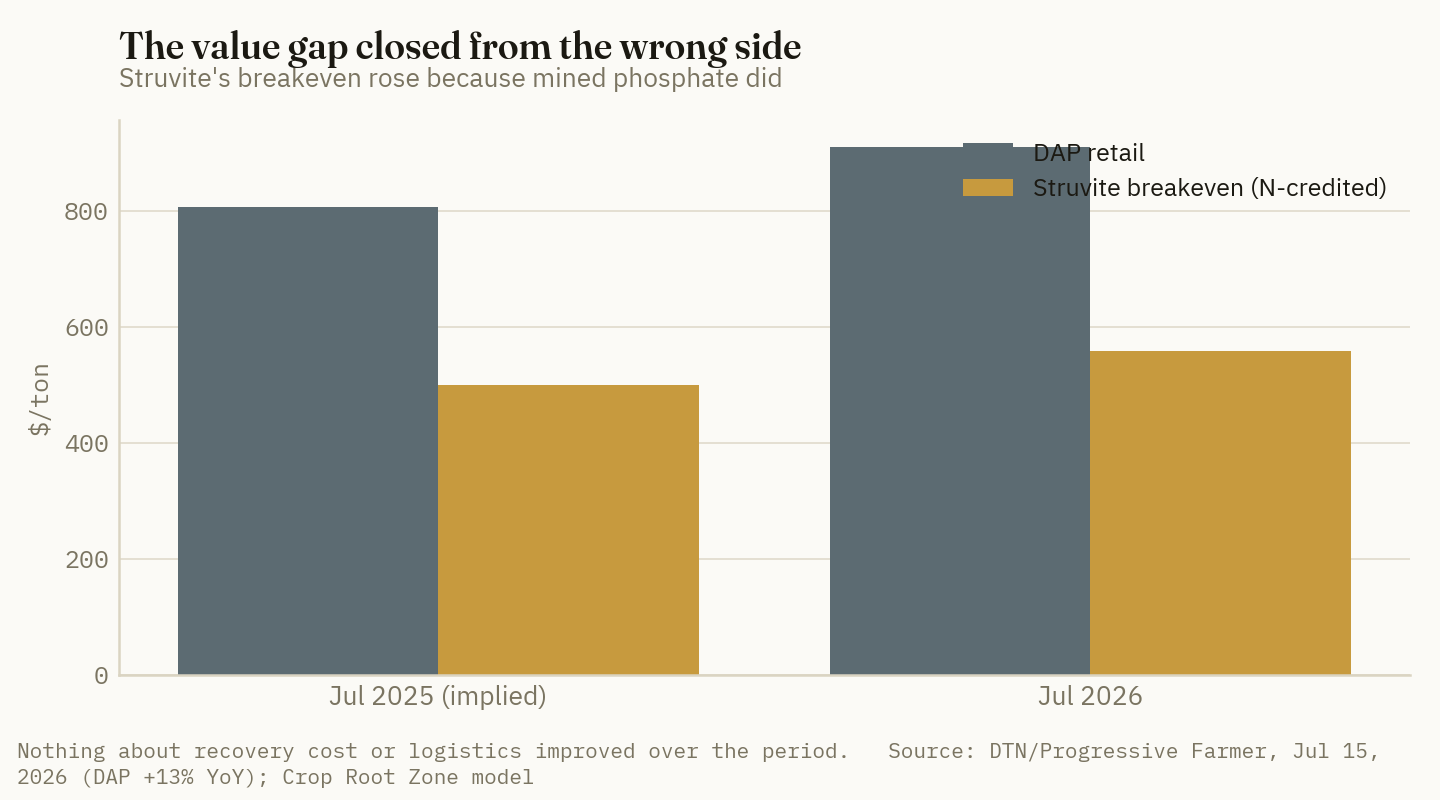
The year-over-year move matters as much as the level. Because DAP and MAP are both up 13% year over year, that replacement band has widened by roughly $60–80 per ton in twelve months without struvite doing anything at all.
Ground Truth: The struvite value gap closed from the wrong side. Nothing about recovery cost, granulation or logistics improved — mined phosphate simply got 13% more expensive and stayed there through a quarter in which nitrogen fell 55% at the barge. That makes today's struvite economics a derivative of the phosphate market, not an independent achievement, and it means the category's apparent progress reverses the moment DAP does. A buyer evaluating recovered P should price it as a phosphate-linked instrument, not as a technology that has come down a cost curve.
3. The tonnage problem
What's new: Set the entire global recovered-struvite category against a single national demand figure and the scale mismatch is three orders of magnitude.
Evidence: US consumption of contained P₂O₅ has run at roughly 4 million tons per year for the past decade (USGS Mineral Commodity Summaries). At DAP-implied values around $0.75–0.99 per pound of P₂O₅, that is a domestic phosphate nutrient bill on the order of $6–8 billion a year — a Crop Root Zone estimate, derived by applying the unit values above to the USGS consumption figure.
Against that, a third-party market study puts the global struvite-based slow-release phosphorus fertilizer market at $265.4 million in 2026, projected to reach $497.6 million by 2031 and $933.3 million by 2036 at a 13.4% CAGR (Future Market Insights, 2026). We report that as a vendor-side market projection, not a verified statistic — such forecasts are systematically optimistic, and the base-year figure is the only part worth leaning on.
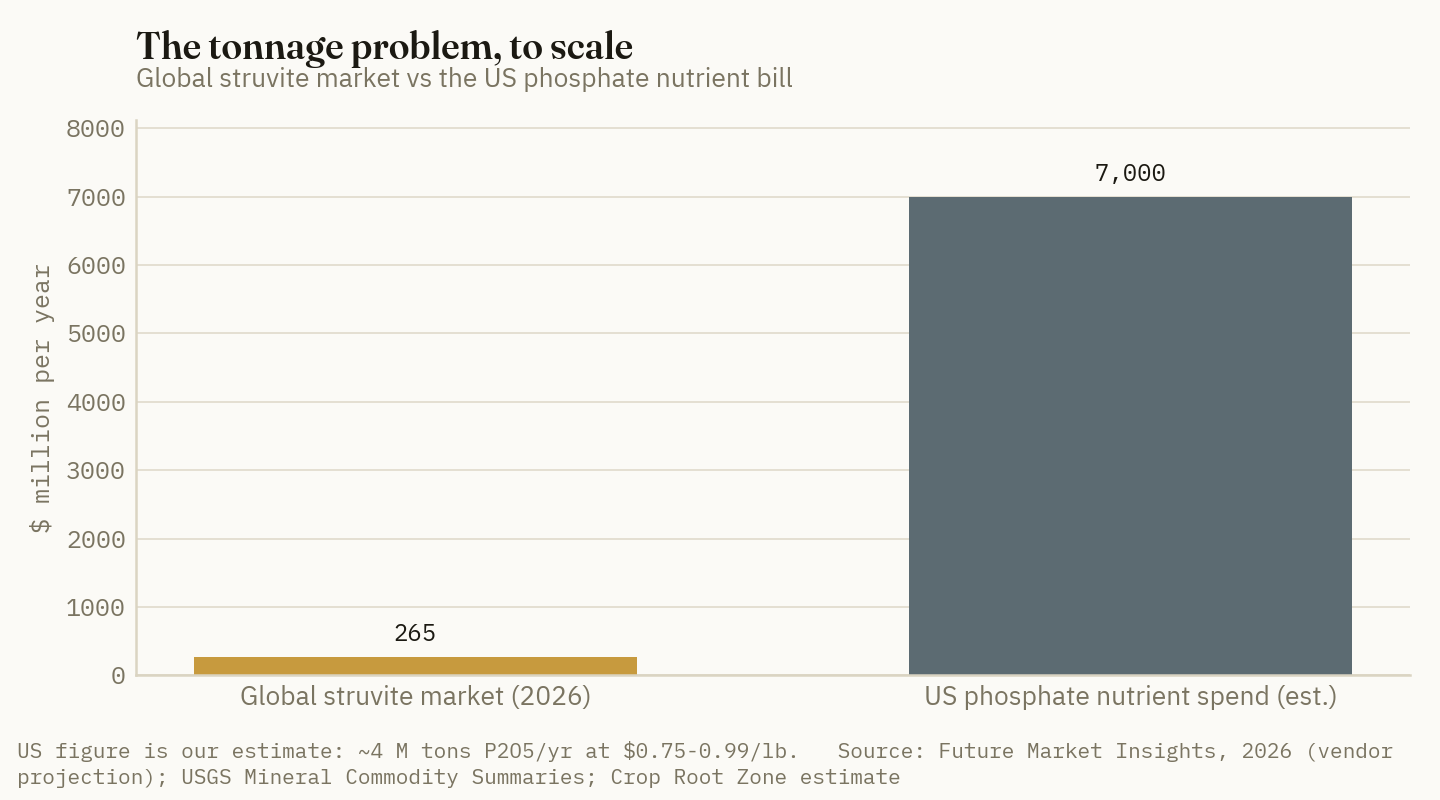
~4%
The entire world's struvite market, measured against the United States' phosphate nutrient spend alone. (Future Market Insights, 2026; USGS Mineral Commodity Summaries; Crop Root Zone estimate)
Even taking the base year at face value: the entire world's struvite market is roughly 3–4% of the United States' phosphate nutrient spend alone. And struvite is only about 28% P₂O₅, so its physical contribution to P supply is smaller still.
The supply constraint is structural rather than commercial. Commercial recovery performs most robustly on high-strength sidestreams — digester supernatant, dewatering centrate and filtrate — where crystallization has demonstrated recovery of about 93% of phosphorus and 40% of nitrogen from the treated stream (peer-reviewed review, 2026). Excellent recovery efficiency, applied to a small stream. The binding limit is the number of wastewater plants large enough, anaerobic-digestion-equipped enough and capital-willing enough to install a reactor — not the chemistry.
Ground Truth: Struvite cannot be a phosphate program and there is no plausible path by which it becomes one this decade — the feedstock is municipal and livestock waste streams, which do not scale with crop demand. What it can be is a high-value placement product: an in-furrow or starter P source on soils where conventional P ties up fast, where its low solubility and magnesium content are genuine agronomic advantages rather than tolerated compromises. Growers should evaluate it against a starter fertilizer budget, not against the DAP line. Anyone pitching it as a hedge against phosphate prices is selling a supply that does not exist.
Market read: MOS — Hold — recovered phosphorus volumes are immaterial to mined-phosphate pricing at this scale, so the circular-nutrient narrative is not a demand risk to Mosaic this decade; the near-term case rests on phosphate holding +13% YoY with a flat monthly tape, which is support, not momentum.
4. Regulation is ahead of supply, and that is the tell
What's new: The legal pathway for recovered fertilizers has been built out faster than the tonnage, which is unusual and diagnostic.
Evidence: In the European Union, Regulation (EU) 2019/1009 established a pathway for placing recovered fertilizing products on the market under defined quality and safety criteria, including categories covering precipitated phosphate salts. That is a fully articulated regulatory regime for a product class that, globally, moves a few hundred million dollars a year.
The US picture is more fragmented — recovered products navigate state fertilizer registration and biosolids-derived-material rules rather than a single federal category — and the first US installation of note was at a wastewater plant in Oregon, framed at the time as the first in the country to recycle nutrients into a commercial fertilizer product (Ostara).
The order of events is worth noting. In most input categories, commercial volume arrives first and regulation catches up. Here the framework arrived first, driven by nutrient-discharge policy rather than by fertilizer demand — which is a reminder of who the actual customer is. A municipal utility installing a struvite reactor is usually buying phosphorus removal from its effluent, with a saleable granule as a byproduct that improves the payback. The fertilizer market is downstream of a compliance decision.
Ground Truth: That inversion sets the ceiling and also identifies the one variable that could break it. Struvite volume will track wastewater phosphorus-discharge regulation, not fertilizer prices — so the forecast worth watching is not DAP, it is the next tightening of nutrient-discharge limits in the Great Lakes and Chesapeake basins. If effluent P limits tighten materially, hundreds of plants face a capital decision in which a struvite reactor becomes the cheapest compliance route, and the supply curve moves for reasons that have nothing to do with agriculture. That is the only realistic mechanism by which this category gets big, and it is a policy trigger, not a market one.
5. What a buyer should actually do this fall
What's new: There is a defensible small position in recovered P for a specific kind of operation, and a clear case for ignoring it entirely for most.
Evidence: The decision reduces to four questions.
Is your P tying up? High-pH calcareous soils and high-free-calcium situations are where struvite's low solubility converts from a drawback into the product's central advantage. This is where the Wisconsin unit-for-unit result is most likely to reproduce on a working farm.
Do you need the magnesium? At an estimated $80/ton of the replacement value, Mg is over 10% of the ton's worth. On soils already adequate in magnesium, that portion of the value is real on paper and worthless in the field — and the breakeven band above should be reduced accordingly.
Can you get it, granulated, in the quantity you need, on your delivery date? For most operations outside the handful of regions near a recovery facility, this is where the evaluation ends. Freight on a specialty granule from a distant plant will consume the entire margin the breakeven math produces.
What is the quoted price against $560–700? If a quote lands above the uncredited breakeven, the seller is charging for the slow-release and environmental attributes rather than the nutrients — which may be worth paying on a starter program and is not worth paying on a broadcast one.
Ground Truth: The right size for a first struvite position is a strip trial on the worst P-tie-up ground on the farm, not a percentage of the P budget. That is not timidity — it is the only structure that generates information you can act on, because the entire economic case rests on a soil-specific response that a whole-field application would average away. And it costs almost nothing: on 40 acres of starter P, the downside of being wrong is a few hundred dollars, while the upside is a documented answer for the one soil type where the published trials say the advantage should be largest.
References
- DTN/Progressive Farmer, "UAN Fertilizers Lead Nutrient Prices Downward" (retail survey, week of Jul 6–10, 2026) — Jul 15, 2026. https://www.dtnpf.com/agriculture/web/ag/crops/article/2026/07/15/uan-fertilizers-lead-nutrient-prices
- University of Arkansas System Division of Agriculture, "Arkansas Field Studies Show Strengths of Alternative Fertilizer for Corn, Rice and Soybeans" (Brye, Greenlee, Popp; field studies 2018–2020, published Mar 17, 2023). https://aaes.uada.edu/news/struvite-study-brye/
- University of Wisconsin–Madison Extension, Soil Science, "Struvite: A Recovered and Recycled Phosphorus Fertilizer." https://extension.soils.wisc.edu/wcmc/struvite-a-recovered-and-recycled-phosphorus-fertilizer/
- Kharal et al., "Electrochemically recovered struvite matches conventional fertilizers in soil nutrient supply," Agrosystems, Geosciences & Environment, 2026. https://acsess.onlinelibrary.wiley.com/doi/10.1002/agg2.70340
- "Phosphorus Recovery from Wastewater in the Circular Economy: Focus on Struvite Crystallization," MDPI, 2026. https://www.mdpi.com/2673-8783/6/2/32
- Ostara, Crystal Green product literature (5-28-0, 16.7% MgO; >170 trials) and Oregon wastewater plant announcement. https://ostara.com/
- Future Market Insights, "Struvite-Based Slow-Release P Fertilizer Program Market" — 2026 base year $265.4M; vendor-side projection, reported as such. https://www.futuremarketinsights.com/reports/struvite-based-slow-release-p-fertilizer-program-market
- U.S. Geological Survey, Mineral Commodity Summaries — Phosphate Rock (US P₂O₅ consumption ~4 million tons/yr). https://pubs.usgs.gov/periodicals/mcs2024/mcs2024-phosphate.pdf
- Regulation (EU) 2019/1009 on EU fertilising products, including recovered precipitated phosphate salts.
Disclosures
Crop Root Zone is an independent publication. Nothing here is investment advice. Market calls, where included, reflect the editors' own read and are not a recommendation to buy or sell any security.
Sulfur at Three Times the Price: How to Pick the Form Now That the Rate Isn't the Decision
Sulfur is up 311% year-over-year and the Q3 Tampa contract just printed a record $705/lt — which means the cheapest $/lb S on the sheet is no longer the right answer
The sulfur benchmark that most North American growers have never looked at is now the most consequential number on their input sheet. The China spot sulfur reference stood at 9,435.67 CNY/T on July 20, 2026 — up 2.17% on the day, 4.44% on the month, and 310.66% year-over-year, off an all-time high of 11,084.33 CNY/T set in June (Trading Economics, Jul 20, 2026) [1]. The North American print confirms it: Argus reported the Q3 2026 Tampa molten sulfur contract settled at a record $705/long tonne delivered, up $50/lt or 8% from Q2's $655/lt, against $495.69/lt in Q1 (Argus Media, Jul 13, 2026) [2]; Gulf refinery spot exports were assessed at $1,100–1,150/t fob on Jul 9 [2]. Roughly half of global sulfur supply originates in the Strait-of-Hormuz-constrained region, and China and Russia export restrictions have compounded it [1]. Sulfur stopped being a free byproduct of dirty air about twenty years ago and became a purchased primary nutrient. At three times last year's price, the rate decision — 15 or 25 lb S/acre — is the easy part. The form decision is where the money is.
1. Why sulfur became a bill in the first place
What's new: Nothing about the agronomy changed. The atmosphere changed. Clean Air Act Amendment enforcement cut U.S. SO₂ emissions by roughly 83% from 1990–1992 to 2014–2016, and total sulfur deposition in the eastern U.S. fell about 77% from 2000–2002 to 2017–2019 as measured across the NADP and CASTNET monitoring networks (Atmospheric Chemistry and Physics, 2022) [3]. Free-of-charge atmospheric sulfur that once covered a meaningful share of a corn crop's requirement is essentially gone.
Evidence: Three other structural changes compounded it. High-analysis, sulfur-free nitrogen and phosphate products — urea (46-0-0) and DAP (18-46-0) — displaced the older grades that carried incidental sulfur; sulfur has consequently shifted from a secondary to a primary nutrient in fertility planning (ChemAnalyst/IMARC, Jun 2026) [4]. Yields rose, so removal rose. And soil organic matter — the mineralization reserve that buffers a sulfur-short year — has drawn down on continuously cropped and eroded ground. Iowa State's synthesis is direct: across roughly 150 Iowa corn trials, about 50% showed a statistically significant yield increase from applied sulfur, with reduced atmospheric deposition named as the leading driver, and lower-OM (<3.5%), sandy, and eroded-surface soils the most likely responders (Iowa State University Extension, Integrated Crop Management) [5].
Ground Truth: The deposition curve is the thing to understand, because it is monotonic and it is not coming back. Every year the free sulfur allowance shrinks a little more, the responsive-acre share creeps up, and a grower who has "never needed sulfur" moves closer to the response threshold without changing a single practice. Treat sulfur the way you treat a nitrogen program — an annual purchase decision with a form and a timing — not as a corrective you buy when you see stripes.
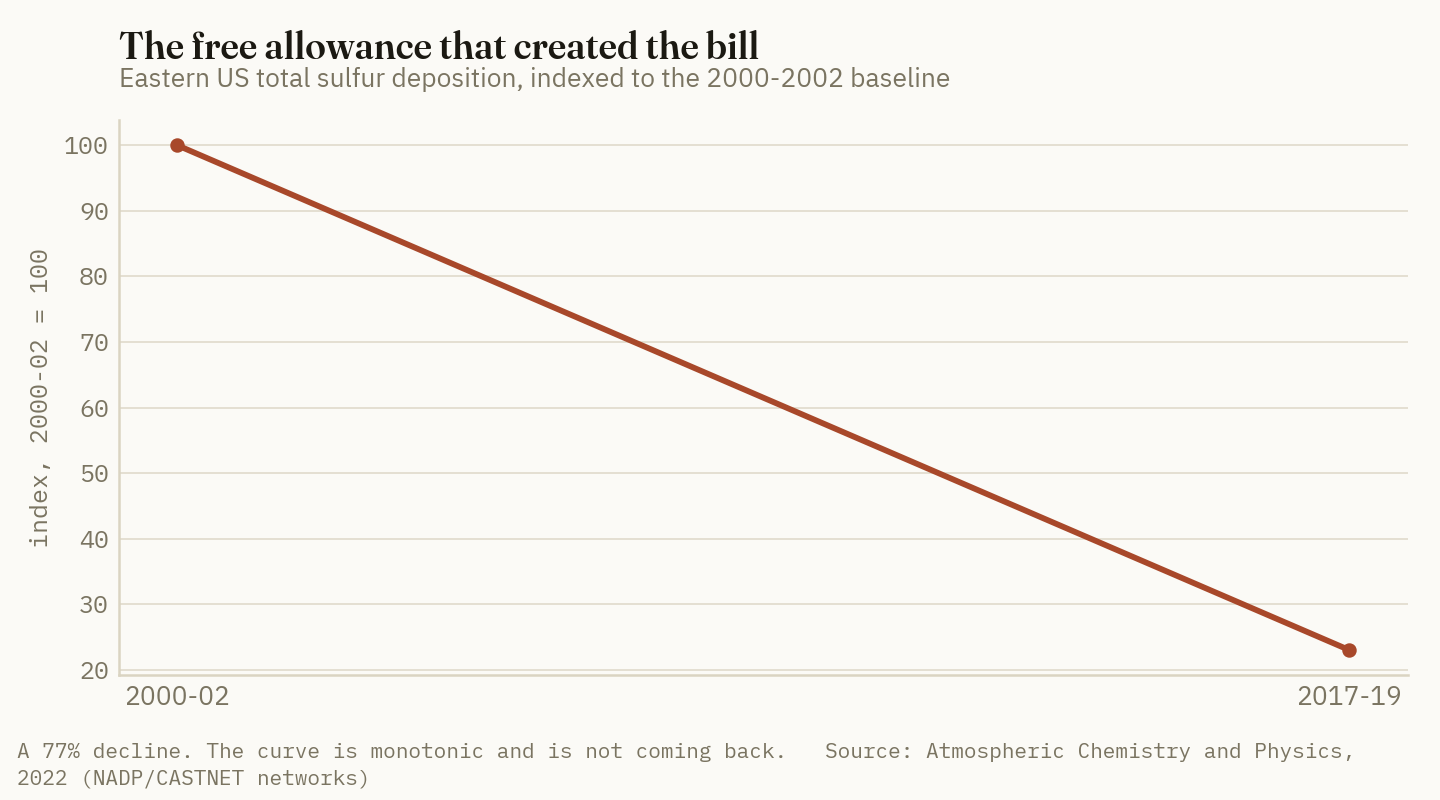
2. The form menu, and the only agronomic distinction that matters
What's new: Every sulfur product on the market sorts into two buckets, and the sort is binary: sulfate-sulfur (SO₄²⁻), which the plant takes up immediately, and elemental sulfur (S⁰), which does not feed anything until soil microbes oxidize it to sulfate. Everything else — granule size, coating, brand — is a second-order argument about how fast the second bucket becomes the first.
Evidence: The sulfate side of the menu, by analysis:
- Ammonium sulfate (AMS), 21-0-0-24S — 24% S, all sulfate, plus 21% N. The workhorse.
- Ammonium thiosulfate (ATS), 12-0-0-26S — 26% S, liquid, 12% N; the thiosulfate converts rapidly in soil and is the standard UAN-compatible and fertigation carrier.
- Gypsum (CaSO₄·2H₂O) — roughly 18% S and 22% Ca; sulfate-form, pH-neutral (MSU Extension) [6].
- Potassium sulfate / SOP, 0-0-50-17S — 17% S plus chloride-free potassium; bought for the K on chloride-sensitive specialty crops, with the S as a co-benefit.
- Potassium thiosulfate (KTS) — the liquid analogue, same logic.
- Co-granulated MES-type products — Mosaic's MicroEssentials SZ (12-40-0-10S-1Zn) is MAP-based with sulfate and elemental sulfur in equal proportions, so half the S is immediately available and half is on the oxidation clock (Mosaic technical data sheet) [7].
Elemental sulfur (Tiger 90CR-type bentonite pastilles, 0-0-0-90) is a different product class. It is 90% S — the highest analysis available — and none of it is plant-available on delivery. Oxidation is a microbial, surface-area-dependent process requiring microbes, water, and oxygen; it runs faster in warm, moist, higher-OM, higher-pH soils, and slower in everything else (Mosaic Crop Nutrition) [8]. Particle size dominates: particles under about 150 microns convert quickly when well mixed with soil, and oxidation rate falls as particle size and in-granule S concentration rise — which is why a 90% S granule oxidizes more slowly than a 5% S co-granulated one at identical particle size, and why non-pelleted powder has been measured at two to four times the oxidation rate of the pelleted equivalent [8]. Minnesota's guidance puts the practical window bluntly: optimal oxidation runs from late June through August, when soils are warmest, which means elemental S applied for a spring-planted crop can leave stripes showing before V10 (University of Minnesota Extension Crop News, Sep 2019) [9]. NDSU is more categorical — for canola it recommends 20–30 lb S/acre "as a sulfate or thiosulfate form" and states plainly that it does not recommend elemental sulfur because it breaks down too slowly, with trial data showing ammonium sulfate consistently outyielding elemental S across soil types and tillage systems (NDSU Extension) [10].
One more elemental-S problem gets no attention and should. At 90% S against AMS's 24%, matching a sulfur rate takes roughly one-quarter the tonnage — Minnesota notes AMS requires "almost four times the mass" for the same S rate [9]. That sounds like a freight advantage. In the spreader it is a uniformity liability: at 20 lb S/acre you are spreading about 22 lb/acre of physical product across a 60-foot-plus swath.
3. The $/lb S math, with the N and K credits taken out honestly
What's new: USDA's Agricultural Marketing Service publishes dated distributor asks that let us build this comparison from public prints rather than a vendor's spreadsheet. For the week ending July 10, 2026: Oklahoma distributor ammonium sulfate averaged $553.75/st FOB (range $460–595), ATS averaged $425.00/st FOB (range $370–480), urea averaged $686.71/st, and red potash averaged $490.80/st (USDA AMS Oklahoma Production Cost Report, Jul 10, 2026) [11]. Freight-disadvantaged regions run far higher — the Pacific Northwest report the same day put AMS at $786.00/st average, range $600–1,110 (USDA AMS Pacific Northwest Production Cost Report, Jul 10, 2026) [12]. Nationally, DTN's retail survey for the week of Jul 6–10 (published Jul 15) put urea at $714/ton, or $0.78/lb N, and potash at $494/ton — the fifth straight week of mostly lower retail nutrient prices (DTN/Progressive Farmer, Jul 15, 2026) [13].
Evidence — Crop Root Zone calculation. Assumptions, stated: standard label analyses; 2,000 lb short ton; nitrogen credited at DTN's urea-derived $0.78/lb N [13]; potassium credited at $0.412/lb K₂O (DTN potash $494/ton ÷ 1,200 lb K₂O per 60% ton) [13]; product cost only, no application or freight-to-farm; Oklahoma AMS/ATS prints as the reference [11]. The credit is subtracted from the ton price and the remainder is charged entirely to sulfur.
| Form | Analysis | lb S/ton | Ton price | Co-nutrient credit | Net $/lb S |
|---|---|---|---|---|---|
| AMS (Oklahoma) | 21-0-0-24S | 480 | $553.75 [11] | 420 lb N × $0.78 = $327.60 | $0.47 |
| AMS (Pac. NW) | 21-0-0-24S | 480 | $786.00 [12] | $327.60 | $0.96 |
| ATS (Oklahoma) | 12-0-0-26S | 520 | $425.00 [11] | 240 lb N × $0.78 = $187.20 | $0.46 |
| Gypsum (bulk) | ~18% S | 360 | $140–195 [14] | none valued (Ca uncredited) | $0.39–0.54 |
| SOP (tote retail) | 0-0-50-17S | 340 | $1,295 [15] | 1,000 lb K₂O × $0.412 = $412 | $2.60 |
| Elemental S | 0-0-0-90 | 1,800 | see below | none | see below |
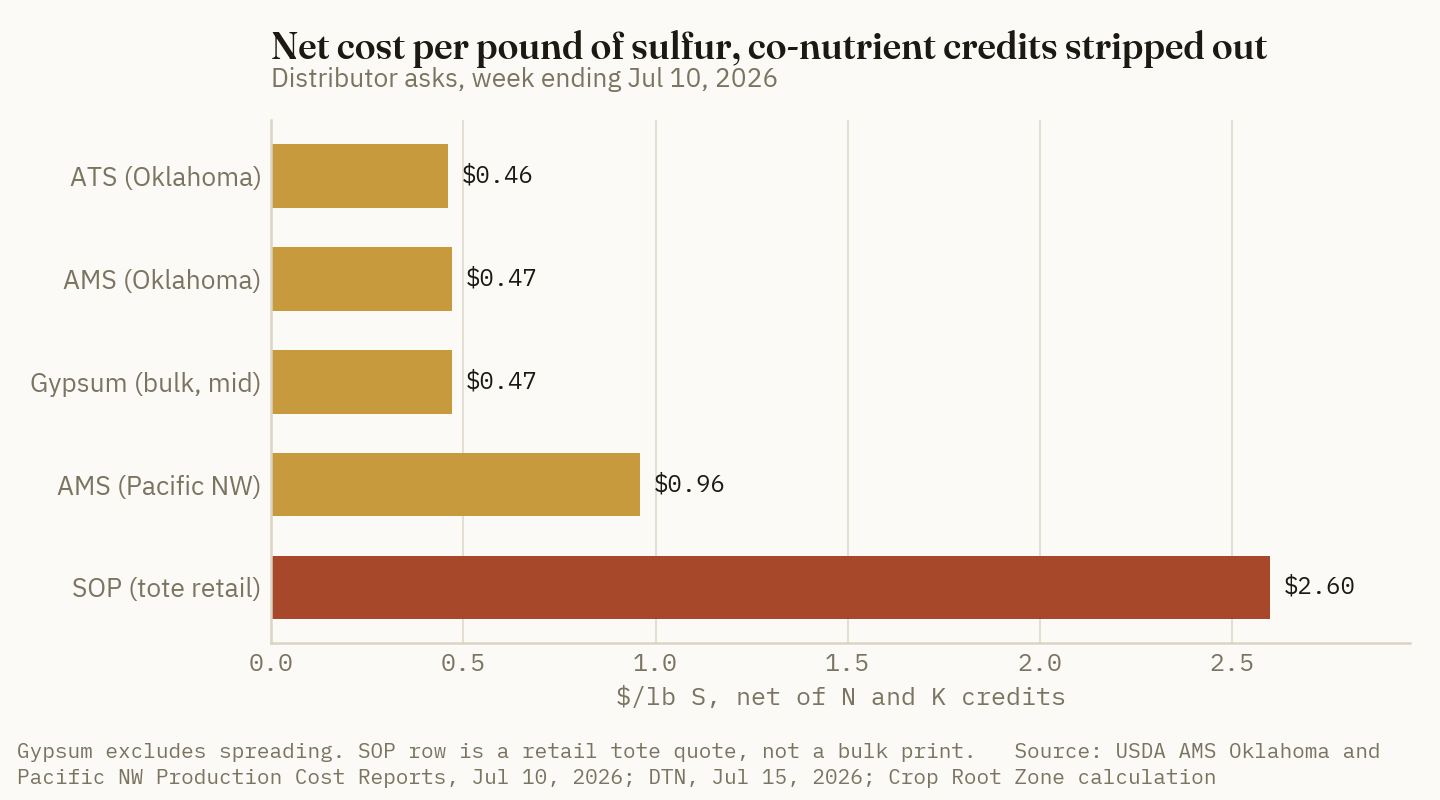
Two rows need flags rather than confidence. The gypsum band comes from a general trade compilation, not a dated exchange print, and excludes spreading — MSU's soybean trial carried $9.29/acre in application on top of $22.50/acre of product [6][14]. The SOP row is a 2,200-lb organic-market tote quote, not a commercial bulk print [15]; it is in the table only to make the point that nobody should buy SOP for sulfur. At $2.60/lb S net of the potassium credit, SOP is a chloride-avoidance product with a sulfur label.
Elemental sulfur is the row we cannot fill from a public print, and we will say so rather than invent it. The visible Tiger 90CR quote is horticultural bag pricing — $38.75 per 50 lb, or $1,550/ton equivalent and $0.86/lb S — which has nothing to do with bulk ag pastilles [16], and ag-bulk pastille quotes are not publicly assessed. What we can anchor is the floor. At the Q3 Tampa contract of $705/long tonne delivered (2,240 lb), the raw sulfur inside any product costs $0.315/lb S before a single step of processing [2] — against a $180/ton U.S. shipment value for all of 2025, itself up from $46/ton in 2024 (USGS Mineral Commodity Summaries 2026) [17].
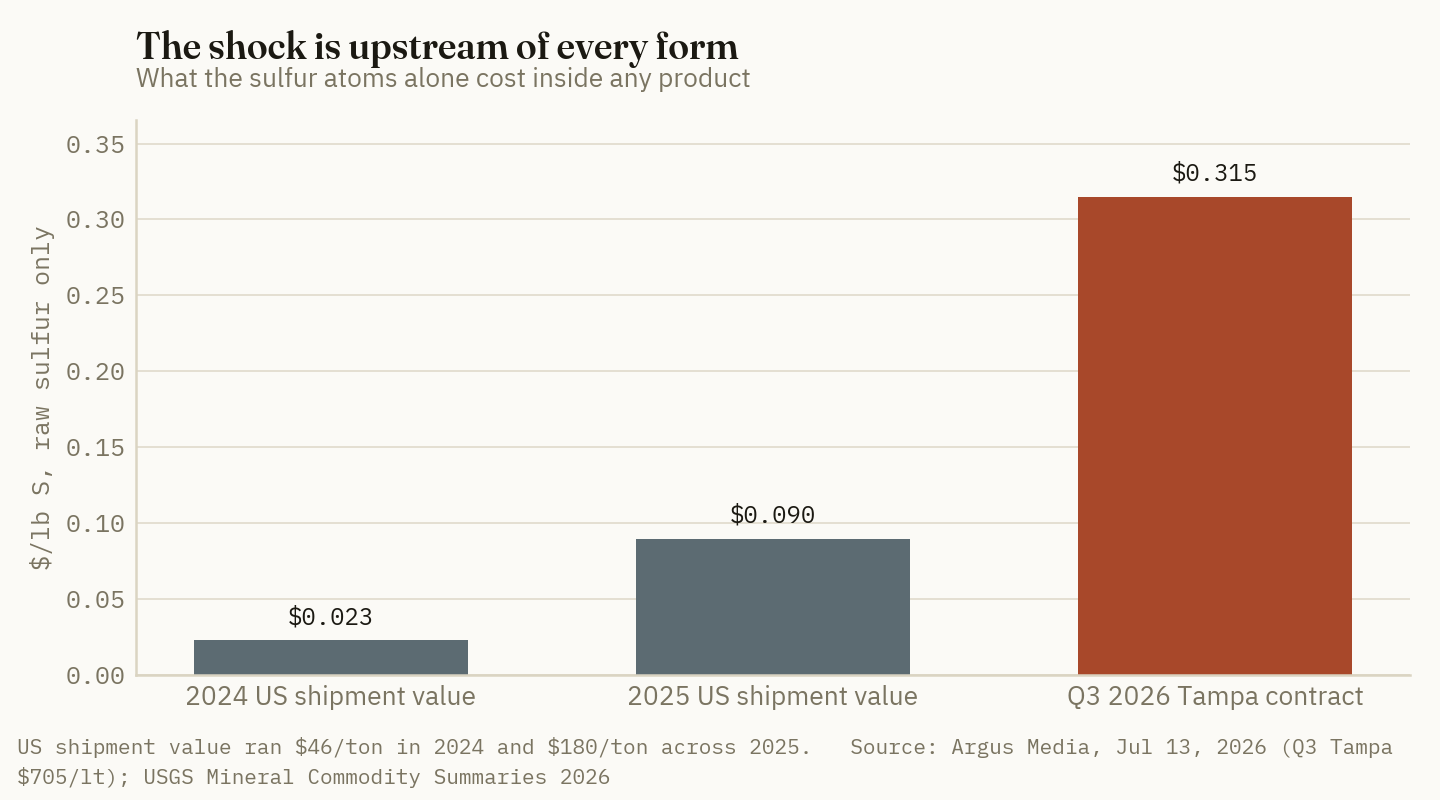
$0.315/lb S
What the sulfur atoms alone cost inside any product at the Q3 Tampa contract — before prilling, bentonite, bagging, freight or margin. (Crop Root Zone calculation on Argus Media, Jul 13, 2026)
Ground Truth: Run the headroom. For 90% elemental S pastilles to beat Oklahoma AMS at $0.47/lb S net, the finished delivered product has to land under about $848/ton — of which $567/ton is now just the sulfur atoms at the Tampa contract price. That leaves roughly $281/ton for prilling, bentonite, bagging, freight and two layers of margin. A year ago, with sulfur benchmarks 311% lower [1], that headroom was multiples wider, which is exactly why elemental S built its reputation as the cheap way to buy sulfur. The price shock is upstream of every form, so switching forms does not escape it — the only thing that escapes it is the nitrogen credit. AMS and ATS are the two forms whose sulfur cost is partially paid for by a co-nutrient, and urea-derived nitrogen is falling (−6% month-over-month) [13] while sulfur rips. That is the single most important relative-price fact in this market, and it cuts against elemental S for the first time in a decade.
4. What the shock actually changes in the recommendation
What's new: Not the rate. The published rate guidance is stable, cheap to satisfy, and worth restating because at these prices the temptation is to cut it:
- Corn — 10–15 lb S/acre broadcast on medium-to-fine textured soils; ~25 lb S/acre on sandy soils and low-OM ground (University of Minnesota Extension) [18]. Iowa research supports ~15 lb S/acre on fine-textured and ~25 lb S/acre on coarse soils [5].
- Soybean — the same 15–25 lb S/acre band as corn [5].
- Canola — 20–30 lb S/acre as sulfate or thiosulfate, applied regardless of soil test, because no soil test has been shown to be diagnostic (NDSU) [10].
- Wheat — a base 10 lb S/acre for spring wheat and durum is prudent, particularly following normal-to-above-normal pre-seeding precipitation (NDSU) [19].
- Alfalfa and forages — responsive, but 20–40 lb S/acre will generally correct a deficiency across crops (MSU Extension) [6].
Evidence: At 20 lb S/acre and Oklahoma AMS at $0.47/lb S net of the nitrogen credit, the sulfur line is about $9.40/acre — a Crop Root Zone calculation on the assumptions above. That is the whole argument for not cutting the rate. Even tripled, sulfur is a single-digit-dollar line against a corn program running $912/ton DAP and $954/ton MAP [13]. Banding, meanwhile, can cut the required rate by as much as half [18] — a bigger lever on the sulfur bill than any form switch in the table.
Where the shock genuinely changes the answer is timing and placement. Two rules fall out of the agronomy above. If the sulfur has to work in the season it is applied, buy sulfate — AMS, ATS, gypsum, or the sulfate half of a co-granulated product. And elemental S only earns its analysis advantage on a fall application, into warm-enough soil, at fine particle size, on a field still in your rotation next year — and even then Minnesota advises 20 lb S/acre or greater, or double the sulfate-equivalent rate, paired with a sulfate source to cover early-season demand [18].
Ground Truth: In a spring application, $/lb S on the invoice is the wrong metric entirely; the right one is $/lb S available before the crop's uptake window closes. Sensitivity, as a Crop Root Zone calculation: a nominally $0.40/lb S elemental product that delivers only 25% of its sulfur as sulfate before the corn crop's peak demand is effectively $1.60/lb S of delivered nutrition that season, with the balance carried as an unpriced receivable against next year's crop — and it is a receivable, not a loss, only if you farm the same acre. Cash-rented ground on a one-year lease should not be buying elemental sulfur at any price. That is not an agronomy argument. It is a balance-sheet one, and it is the argument that most sulfur-form conversations skip.
5. The emerging products: do they pencil?
What's new: Three categories are being sold hard into this price environment, and they deserve different verdicts.
Co-granulated MES-type products. The agronomic claim is real and specific: fusing MAP, sulfate-S, elemental S and zinc into one granule eliminates the segregation that happens when separate MAP, AMS and zinc sulfate particles ride the same spreader [9][7], and dispersed, low-concentration elemental S in a co-granulated matrix converts faster than a high-analysis 90% granule at the same particle size [8]. The catch is that the 50/50 sulfate/elemental split leaves half the labeled sulfur on the microbial clock [7], so a 10S product delivers roughly 5 lb of immediately available S per 100 lb of product. Verdict: buy it for the phosphate and the placement uniformity, price the sulfur at the sulfate half, and do not pay a specialty premium for the elemental half.
Micronized elemental S suspensions. The mechanism is the one part of the elemental-S story that is unambiguously supported: sub-150-micron particles oxidize fast, and non-pelleted powder runs two to four times the oxidation rate of pelleted product [8]. A liquid suspension is the logical vehicle for that particle size. What we could not find is independent, replicated, multi-site North American field data showing a yield advantage over an equal rate of AMS or ATS at a defensible price differential. Verdict: mechanistically credible, commercially unproven. Demand the check strip before the acre-wide order.
Biological sulfur-oxidizer inoculants. Here the evidence base is weakest where the marketing is loudest. The most-cited number — a 35% canola yield increase from a PGPR-plus-elemental-S treatment over a sulfate-sulfur control, with the inoculant alone delivering 9% — comes from a 2001 field trial reported inside a patent filing by the technology's own assignee (USPTO 7,534,612) [20]. That is an inventor's disclosure, not independent replication, and a 35% response over a sulfate control should itself raise an eyebrow, because it implies the control was badly deficient. Verdict: skip it. The rate-limiting variables in elemental S oxidation are surface area and temperature [8], not microbial population, and you cannot inoculate your way out of a cold April.
Market read: MOS — Hold — Mosaic's co-granulated MicroEssentials franchise gets a relative pull from growers reaching for sulfur-bearing phosphate, but Mosaic also buys sulfur as a phosphate feedstock at the same record Tampa contract, and Argus is already flagging weakening phosphate demand on affordability at $912–954/ton DAP/MAP [2][13]; the sulfur shock is a cost line and a product tailwind at the same time, which nets to neither.
A note on sourcing discipline: Green Markets publishes a U.S. Gulf NOLA ammonium sulfate barge range of $375–390/st FOB, but the publicly visible quote at that level dates to January 2025 and current 2026 barge assessments are subscriber-only [21] — we have not used it above. The current wholesale index, ChemAnalyst's U.S. ammonium sulfate assessment at roughly $383/MT in June 2026 on tight domestic supply [4], is a bulk number, not a farmgate price; the gap to the $553.75–786.00/st distributor asks [11][12] is the distribution chain, not a data error. Argus reckons sulfur cost alone adds $40–50/st or more to amsul production cost depending on grade [22]. Expect the retail AMS ask to keep grinding up even as urea and potash fall.
References
- Trading Economics, Sulfur (China spot benchmark) — Jul 20, 2026, https://tradingeconomics.com/commodity/sulfur
- Argus Media, Q3 2026 Tampa molten sulfur contract settlement and US Gulf spot assessments — Jul 13, 2026 (spot assessment Jul 9, 2026), https://www.argusmedia.com/
- Atmospheric Chemistry and Physics, "Long-term regional trends of nitrogen and sulfur deposition in the United States from 2002 to 2017" — 2022, https://acp.copernicus.org/articles/22/12749/2022/
- ChemAnalyst / IMARC Group, U.S. Ammonium Sulphate price assessment — Jun 2026, https://www.chemanalyst.com/Pricing-data/ammonium-sulphate-64
- Iowa State University Extension, Integrated Crop Management, "Crop Sulfur Fertilization This Spring" and "Who needs sulfur? You might need sulfur." — accessed Jul 2026, https://crops.extension.iastate.edu/cropnews/2020/03/crop-sulfur-fertilization-spring
- Michigan State University Extension, "Gypsum offers an economic source of sulfur for deficient soybean acres" — accessed Jul 2026, https://www.canr.msu.edu/news/gypsum_offers_an_economic_source_of_sulfur_for_deficient_soybean_acres
- The Mosaic Company, MicroEssentials SZ (12-40-0-10S-1Zn) Technical Data Sheet — accessed Jul 2026, https://mosaicco.com/fileLibrary/publicFiles/0-MESZ-Specification-Sheet.pdf
- Mosaic Crop Nutrition, "Oxidation of Elemental Sulfur in Soils" — accessed Jul 2026, https://www.cropnutrition.com/resource-library/oxidation-of-elemental-sulfur-in-soils/
- University of Minnesota Extension Crop News, "Fall sulfur application: Selecting the best product" — Sep 2019, https://blog-crop-news.extension.umn.edu/2019/09/fall-sulfur-application-selecting-best.html
- North Dakota State University Extension, "Fertilizing Canola and Mustard" (SF1122) — accessed Jul 2026, https://www.ndsu.edu/agriculture/extension/publications/fertilizing-canola-and-mustard
- USDA Agricultural Marketing Service, Oklahoma Production Cost Report (Bi-Weekly), week ending 07/10/2026 — Jul 10, 2026, https://www.ams.usda.gov/mnreports/ams_3621.pdf
- USDA Agricultural Marketing Service, Pacific Northwest Production Cost Report (Bi-Weekly), week ending 07/10/2026 — Jul 10, 2026, https://www.ams.usda.gov/mnreports/ams_3657.pdf
- DTN/Progressive Farmer, retail fertilizer survey, week of Jul 6–10, 2026 — published Jul 15, 2026, https://www.dtnpf.com/agriculture/web/ag/crops/article/2026/07/15/uan-fertilizers-lead-nutrient-prices
- General trade compilation of bulk agricultural gypsum pricing, $140–195/ton for natural high-volume standard product — accessed Jul 2026 (undated trade estimate, not an exchange print), https://engineerfix.com/how-much-does-gypsum-cost-price-by-form-application/
- Seven Springs Farm Supply, Potassium Sulfate Granular (SOP) 0-0-50 + 17% S, 2,200 lb tote, $1,425 — accessed Jul 2026, https://www.7springsfarm.com/products/potassium-sulfate-granular-sop-0-0-50-s17-1-ton-tote
- Green Earth Ag & Turf, Tiger 90CR Elemental Sulfur, 50 lb bag at $38.75 — accessed Jul 2026, https://greenearthagandturf.com/products/tiger-90cr-elemental-sulfur
- U.S. Geological Survey, Mineral Commodity Summaries 2026 — Sulfur — 2026, https://pubs.usgs.gov/periodicals/mcs2026/mcs2026-sulfur.pdf
- University of Minnesota Extension, "Sulfur for Minnesota soils" and "Fertilizing corn in Minnesota" — accessed Jul 2026, https://extension.umn.edu/micro-and-secondary-macronutrients/sulfur-minnesota-soils
- North Dakota State University Extension, "Fertilizer Rates when Costs are High (Part 3 — specifics for crops)" — Apr 28, 2022, https://www.ndsu.edu/agriculture/ag-hub/ag-topics/crop-production/crop-pest-report/soils/fertilizer-rates-when-costs-are-high-part-3
- U.S. Patent 7,534,612, "Sulfur-oxidizing plant growth promoting rhizobacteria for enhanced canola performance" — assignee field-trial data, 2001 trials, https://image-ppubs.uspto.gov/dirsearch-public/print/downloadPdf/7534612
- Green Markets, U.S. Gulf NOLA ammonium sulfate barge range $375–390/st FOB — publicly visible quote dated January 2025; current 2026 assessments subscriber-only
- Argus Media, "Viewpoint: Sulfur costs to support amsul prices in 2026" — accessed Jul 2026, https://www.argusmedia.com/en/news-and-insights/latest-market-news/2770651-viewpoint-sulfur-costs-to-support-amsul-prices-in-2026
Disclosures
Crop Root Zone is an independent publication. Nothing here is investment advice. Market calls, where included, reflect the editors' own read and are not a recommendation to buy or sell any security.
Discussion
Anhydrous is the cheapest nitrogen on the board at $0.59/lb N against UAN32's $0.73 — but Kansas custom applicators are charging an average of $21.51/acre to knife it in versus $8.40/acre to spread dry, which eats a large share of that edge before the crop ever sees it. On your ground this fall, at your N rate and your custom or owned-equipment cost, does anhydrous still win? Post the three numbers that decide it — delivered price, rate, and applied cost — and say which way you went.
Corrections and pushback are welcome and useful. The sharpest replies get answered in next week's Letters & Responses.